J. P. Lees
V. Poireau
V. Tisserand
Laboratoire d’Annecy-le-Vieux de Physique des Particules (LAPP), Université de Savoie, CNRS/IN2P3, F-74941 Annecy-Le-Vieux, France
E. Grauges
Universitat de Barcelona, Facultat de Fisica, Departament ECM, E-08028 Barcelona, Spain
A. Palano
INFN Sezione di Bari and Dipartimento di Fisica, Università di Bari, I-70126 Bari, Italy
G. Eigen
University of Bergen, Institute of Physics, N-5007 Bergen, Norway
D. N. Brown
Yu. G. Kolomensky
Lawrence Berkeley National Laboratory and University of California, Berkeley, California 94720, USA
H. Koch
T. Schroeder
Ruhr Universität Bochum, Institut für Experimentalphysik 1, D-44780 Bochum, Germany
C. Hearty
T. S. Mattison
J. A. McKenna
R. Y. So
University of British Columbia, Vancouver, British Columbia, Canada V6T 1Z1
V. E. BlinovabcA. R. BuzykaevaV. P. DruzhininabV. B. GolubevabE. A. KravchenkoabA. P. OnuchinabcS. I. SerednyakovabYu. I. SkovpenabE. P. SolodovabK. Yu. TodyshevabBudker Institute of Nuclear Physics SB RAS, Novosibirsk 630090a, Novosibirsk State University, Novosibirsk 630090b, Novosibirsk State Technical University, Novosibirsk 630092c, Russia
A. J. Lankford
University of California at Irvine, Irvine, California 92697, USA
J. W. Gary
O. Long
University of California at Riverside, Riverside, California 92521, USA
A. M. Eisner
W. S. Lockman
W. Panduro Vazquez
University of California at Santa Cruz, Institute for Particle Physics, Santa Cruz, California 95064, USA
D. S. Chao
C. H. Cheng
B. Echenard
K. T. Flood
D. G. Hitlin
J. Kim
T. S. Miyashita
P. Ongmongkolkul
F. C. Porter
M. Röhrken
California Institute of Technology, Pasadena, California 91125, USA
Z. Huard
B. T. Meadows
B. G. Pushpawela
M. D. Sokoloff
L. Sun
Now at: Wuhan University, Wuhan 43072, China
University of Cincinnati, Cincinnati, Ohio 45221, USA
J. G. Smith
S. R. Wagner
University of Colorado, Boulder, Colorado 80309, USA
D. Bernard
M. Verderi
Laboratoire Leprince-Ringuet, Ecole Polytechnique, CNRS/IN2P3, F-91128 Palaiseau, France
F. BettiabAlso at: Laboratoire de l’Accélérateur Linéaire, F-91898 Orsay Cedex, France
D. BettoniaC. BozziaR. CalabreseabG. CibinettoabE. FioravantiabI. GarziaabE. LuppiabV. SantoroaINFN Sezione di Ferraraa; Dipartimento di Fisica e Scienze della Terra, Università di Ferrarab, I-44122 Ferrara, Italy
A. Calcaterra
R. de Sangro
G. Finocchiaro
S. Martellotti
P. Patteri
I. M. Peruzzi
M. Piccolo
M. Rotondo
A. Zallo
INFN Laboratori Nazionali di Frascati, I-00044 Frascati, Italy
S. Passaggio
C. Patrignani
Now at: Università di Bologna and INFN Sezione di Bologna, I-47921 Rimini, Italy
INFN Sezione di Genova, I-16146 Genova, Italy
B. Bhuyan
Indian Institute of Technology Guwahati, Guwahati, Assam, 781 039, India
U. Mallik
University of Iowa, Iowa City, Iowa 52242, USA
C. Chen
J. Cochran
S. Prell
Iowa State University, Ames, Iowa 50011, USA
H. Ahmed
Physics Department, Jazan University, Jazan 22822, Kingdom of Saudi Arabia
A. V. Gritsan
Johns Hopkins University, Baltimore, Maryland 21218, USA
N. Arnaud
M. Davier
F. Le Diberder
A. M. Lutz
G. Wormser
Laboratoire de l’Accélérateur Linéaire, IN2P3/CNRS et Université Paris-Sud 11, Centre Scientifique d’Orsay, F-91898 Orsay Cedex, France
D. J. Lange
D. M. Wright
Lawrence Livermore National Laboratory, Livermore, California 94550, USA
J. P. Coleman
E. Gabathuler
D. E. Hutchcroft
D. J. Payne
C. Touramanis
University of Liverpool, Liverpool L69 7ZE, United Kingdom
A. J. Bevan
F. Di Lodovico
R. Sacco
Queen Mary, University of London, London, E1 4NS, United Kingdom
G. Cowan
University of London, Royal Holloway and Bedford New College, Egham, Surrey TW20 0EX, United Kingdom
Sw. Banerjee
D. N. Brown
C. L. Davis
University of Louisville, Louisville, Kentucky 40292, USA
A. G. Denig
M. Fritsch
W. Gradl
K. Griessinger
A. Hafner
K. R. Schubert
Johannes Gutenberg-Universität Mainz, Institut für Kernphysik, D-55099 Mainz, Germany
R. J. Barlow
Now at: University of Huddersfield, Huddersfield HD1 3DH, UK
G. D. Lafferty
University of Manchester, Manchester M13 9PL, United Kingdom
R. Cenci
A. Jawahery
D. A. Roberts
University of Maryland, College Park, Maryland 20742, USA
R. Cowan
Massachusetts Institute of Technology, Laboratory for Nuclear Science, Cambridge, Massachusetts 02139, USA
R. Cheaib
S. H. Robertson
McGill University, Montréal, Québec, Canada H3A 2T8
B. DeyaN. NeriaF. PalomboabINFN Sezione di Milanoa; Dipartimento di Fisica, Università di Milanob, I-20133 Milano, Italy
L. Cremaldi
R. Godang
Now at: University of South Alabama, Mobile, Alabama 36688, USA
D. J. Summers
University of Mississippi, University, Mississippi 38677, USA
P. Taras
Université de Montréal, Physique des Particules, Montréal, Québec, Canada H3C 3J7
G. De Nardo
C. Sciacca
INFN Sezione di Napoli and Dipartimento di Scienze Fisiche, Università di Napoli Federico II, I-80126 Napoli, Italy
G. Raven
NIKHEF, National Institute for Nuclear Physics and High Energy Physics, NL-1009 DB Amsterdam, The Netherlands
C. P. Jessop
J. M. LoSecco
University of Notre Dame, Notre Dame, Indiana 46556, USA
K. Honscheid
R. Kass
Ohio State University, Columbus, Ohio 43210, USA
A. GazaM. MargoniabM. PosoccoaG. SimiabF. SimonettoabR. StroiliabINFN Sezione di Padovaa; Dipartimento di Fisica, Università di Padovab, I-35131 Padova, Italy
S. Akar
E. Ben-Haim
M. Bomben
G. R. Bonneaud
G. Calderini
J. Chauveau
G. Marchiori
J. Ocariz
Laboratoire de Physique Nucléaire et de Hautes Energies, IN2P3/CNRS, Université Pierre et Marie Curie-Paris6, Université Denis Diderot-Paris7, F-75252 Paris, France
M. BiasiniabE. ManoniaA. RossiaINFN Sezione di Perugiaa; Dipartimento di Fisica, Università di Perugiab, I-06123 Perugia, Italy
G. BatignaniabS. BettariniabM. CarpinelliabAlso at: Università di Sassari, I-07100 Sassari, Italy
G. CasarosaabM. ChrzaszczaF. FortiabM. A. GiorgiabA. LusianiacB. OberhofabE. PaoloniabM. RamaaG. RizzoabJ. J. WalshaINFN Sezione di Pisaa; Dipartimento di Fisica, Università di Pisab; Scuola Normale Superiore di Pisac, I-56127 Pisa, Italy
A. J. S. Smith
Princeton University, Princeton, New Jersey 08544, USA
F. AnulliaR. FacciniabF. FerrarottoaF. FerroniabA. PilloniabG. PireddaaINFN Sezione di Romaa; Dipartimento di Fisica, Università di Roma La Sapienzab, I-00185 Roma, Italy
C. Bünger
S. Dittrich
O. Grünberg
M. Heß
T. Leddig
C. Voß
R. Waldi
Universität Rostock, D-18051 Rostock, Germany
T. Adye
F. F. Wilson
Rutherford Appleton Laboratory, Chilton, Didcot, Oxon, OX11 0QX, United Kingdom
S. Emery
G. Vasseur
CEA, Irfu, SPP, Centre de Saclay, F-91191 Gif-sur-Yvette, France
D. Aston
C. Cartaro
M. R. Convery
J. Dorfan
W. Dunwoodie
M. Ebert
R. C. Field
B. G. Fulsom
M. T. Graham
C. Hast
W. R. Innes
P. Kim
D. W. G. S. Leith
S. Luitz
V. Luth
D. B. MacFarlane
D. R. Muller
H. Neal
B. N. Ratcliff
A. Roodman
M. K. Sullivan
J. Va’vra
W. J. Wisniewski
SLAC National Accelerator Laboratory, Stanford, California 94309 USA
M. V. Purohit
J. R. Wilson
University of South Carolina, Columbia, South Carolina 29208, USA
A. Randle-Conde
S. J. Sekula
Southern Methodist University, Dallas, Texas 75275, USA
M. Bellis
P. R. Burchat
E. M. T. Puccio
Stanford University, Stanford, California 94305, USA
M. S. Alam
J. A. Ernst
State University of New York, Albany, New York 12222, USA
R. Gorodeisky
N. Guttman
D. R. Peimer
A. Soffer
Tel Aviv University, School of Physics and Astronomy, Tel Aviv, 69978, Israel
S. M. Spanier
University of Tennessee, Knoxville, Tennessee 37996, USA
J. L. Ritchie
R. F. Schwitters
University of Texas at Austin, Austin, Texas 78712, USA
J. M. Izen
X. C. Lou
University of Texas at Dallas, Richardson, Texas 75083, USA
F. BianchiabF. De MoriabA. FilippiaD. GambaabINFN Sezione di Torinoa; Dipartimento di Fisica, Università di Torinob, I-10125 Torino, Italy
L. Lanceri
L. Vitale
INFN Sezione di Trieste and Dipartimento di Fisica, Università di Trieste, I-34127 Trieste, Italy
F. Martinez-Vidal
A. Oyanguren
IFIC, Universitat de Valencia-CSIC, E-46071 Valencia, Spain
J. Albert
A. Beaulieu
F. U. Bernlochner
G. J. King
R. Kowalewski
T. Lueck
I. M. Nugent
J. M. Roney
N. Tasneem
University of Victoria, Victoria, British Columbia, Canada V8W 3P6
T. J. Gershon
P. F. Harrison
T. E. Latham
Department of Physics, University of Warwick, Coventry CV4 7AL, United Kingdom
R. Prepost
S. L. Wu
University of Wisconsin, Madison, Wisconsin 53706, USA
Abstract
Using a sample of pairs, we measure the decay branching fraction , where the first uncertainty is statistical and the second is systematic. Our measurement will be helpful in studies of lepton universality by measuring using decays, normalized to .
pacs:
13.20.He, 14.40.Nd
The BABAR Collaboration measured the branching fraction ratios for semileptonic decays to
and
(1)
where is an electron or a muon, to be in excess of standard model (SM) predictions ref:babarDstartaunu . The use of charge conjugate reactions is implied throughout this article. After combining the results for and , the excess is inconsistent with lepton universality at the 3.4 level. The Belle Collaboration ref:Belle and the LHCb Collaboration ref:LHCb conducted similar measurements with comparable results. A measurement of using decays, normalized to , may yield the observation of a further deviation from the SM. Such a measurement has not been done before and may make use of a clean kinematic signature. This possibility relies in part on a measurement of , for which the current world average value is ref:pdg . The LHCb Collaboration measured this value to be (stat.)(syst.)(norm.)) ref:LHCb2 , where the final uncertainty is due to using decays for normalization purposes. This measurement has not been included in the world average value as yet. In this article, we report on a measurement of .
We use data recorded with the BABAR detector at the PEP-II asymmetric-energy collider at SLAC. The BABAR detector is described in detail elsewhere ref:detector ; ref:detector2 . The data sample corresponds to an integrated luminosity of collected at the resonance Lees:2013rw , which corresponds to the production of pairs. We use Monte Carlo (MC) simulations to understand background processes and signal reconstruction efficiencies. The EvtGen event generator ref:evtgen is used to simulate particle decays. This includes a sample of events, where is a or quark, with an equivalent luminosity of 2,589 and a sample of pairs. The detector response is simulated with the Geant4 ref:geant4 suite of programs.
We fully reconstruct the decay chain by adding the four-momenta of particle candidates. The mesons are reconstructed in the and final states. A candidate is reconstructed from two charged-particle tracks, of which one is identified as a meson based on information obtained using the tracking and Cherenkov detectors. We require candidates to have an invariant-mass value within of the nominal mass ref:pdg , which corresponds to 3 standard deviations in its mass resolution. Each candidate is combined with a charged-particle track with momentum less than 0.45 in the center-of-mass (CM) frame to form a candidate. We require the difference between the reconstructed mass of the candidate and the reconstructed mass of the candidate to lie between 0.1435 and 0.1475. The candidate is combined with three other charged-particle tracks to form a candidate. We do not explicitly apply particle identification to select charged pions, but assign the pion mass hypothesis to all tracks other than the daughter
of the . All other reconstructed tracks and neutral clusters in the event are collectively referred to as the rest of the event (ROE). We use a neural network classifier ref:TMVA to suppress non- backgrounds. The classifier makes use of nine variables, each of which is calculated in the CM frame:
•
the cosine of the angle between the candidate’s thrust axis ref:thrust and the beam axis;
the sum over the ROE of , where is the magnitude of a particle’s momentum;
•
the sum over the ROE of , where is the polar angle of a particle’s momentum;
•
the cosine of the angle between the thrust axis of the candidate and the thrust axis of the ROE;
•
the cosine of the angle between the sphericity axis of the candidate and the thrust axis of the ROE;
•
the ratio of the second-order to zeroth-order Fox-Wolfram moment using all reconstructed particles ref:r2all ;
•
the cosine of the angle between the thrust axis calculated using all reconstructed particles and the beam axis.
Each of these nine variables contributes to separating decays from non- decays. We apply a selection on the output of the neural network classifier that rejects 69% of reconstructed signal candidates from non- decays, and retains 80% of correctly reconstructed candidates. Finally, we require the candidate to have a CM frame energy within of , where is the nominal invariant-mass of the initial state. This corresponds to 4 standard deviations in the energy resolution. We retain all candidates that pass our selection criteria instead of selecting a best candidate for each event. In MC-simulated signal and background events that have at least one candidate passing all selection criteria, there are on average 1.57 and 1.37 candidates per event, respectively.
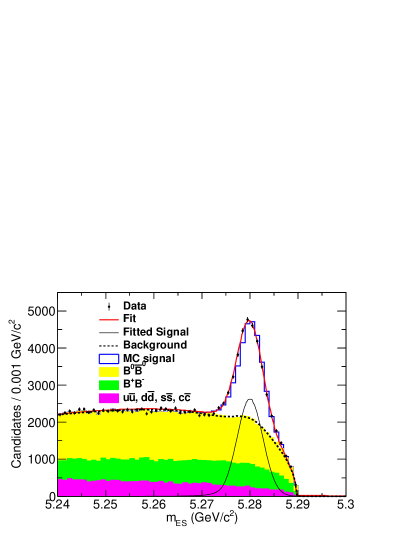
After applying all selection criteria, we determine the energy-substituted mass for the selected candidates, where is the CM-frame momentum of a . Figure 1 shows the distribution for the data and for MC-simulated events. The distribution of correctly reconstructed signal candidates has a peak near the mass.
Figure 1:
(color online) The distribution of candidates for data (points), MC simulations (histograms), and the unbinned extended-maximum-likelihood fit to the data (curves). The MC distributions are shown as stacked histograms. The with decays are part of the MC signal. The MC signal contribution is normalized such that its stacked histogram has the same integral as the data. The components of the MC simulations and the fit are described in the legend. The peak of the MC signal is slightly above that of the data. This shift has a negligible effect on the signal yield.
The distribution of signal events is modeled using a Crystal Ball ref:crys probability density function (PDF), with cutoff and power-law parameters determined using MC-simulated events. We consider only candidates that are correctly reconstructed. We model the background distribution as follows. The non-peaking backgrounds from events and from pairs are modeled using an ARGUS function ref:argus . Each of the peaking backgrounds from and is modeled by a Gaussian distribution for which the normalization, mean, and width, are determined by a fit to the corresponding simulated event sample. We perform a one-dimensional unbinned extended-maximum-likelihood fit in order to estimate the number of signal candidates. We allow the mean and width parameters of the Crystal Ball function, the curvature parameter of the ARGUS function, and the normalization of the non-peaking background, to vary in the fit. The cutoff parameter for the ARGUS function is fixed to , and the peaking background PDF shapes and normalizations are fixed to their MC-estimated values. The peaking backgrounds contributions are estimated to be and candidates from and decays, respectively; some originate from signal decays where one or more pion is misreconstructed even when there is a correctly reconstructed candidate. There is also a contribution from and decays, where denotes any combination of and mesons other than or . The fit to the distribution shown in Fig. 1 results in a signal yield of .
The distribution for the MC signal peaks at a higher value than the data. We repeat the fit procedure on our MC sample where we correct for this difference. The effect on the signal yield is negligible.
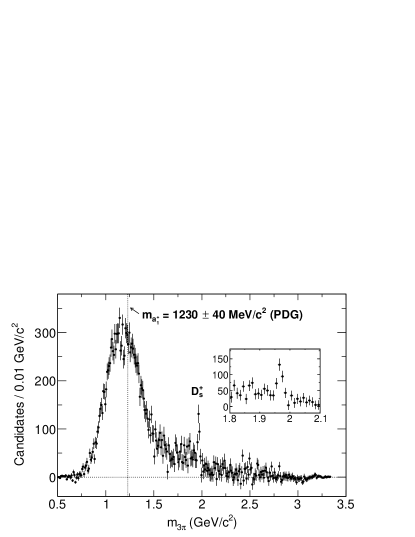
We define the signal region to be , and a sideband region to be . About 97.6% of signal events are contained within the signal region. To obtain the invariant mass distribution for the signal events in Fig. 2, we subtract the events in the sideband region of the in Fig. 1, normalized to the fitted background component in the signal region, from the total mass distribution. By integrating the dashed line in Fig. 1, we obtain events in the sideband-region and background events in the signal region. These values make use of the peaking background estimates described in the previous paragraph.
Figure 2:
The background-subtracted invariant-mass spectrum of the system. The indicated mass value of the is obtained from Ref. ref:pdg . The decay, which is removed in the final result, is visible in the spectrum. The spectrum is obtained prior to the efficiency correction. The inset shows the distribution around the region.
As expected from the branching fractions in Ref. ref:pdg , the main contribution comes from decays, and a contribution from the decay is also apparent. There is as well activity in the 1.7–1.9 region, which may be due to the meson. The analysis of the region is complicated and will be the subject of a separate study.
The events result from the doubly-charmed decay in which the decays weakly to . Since the decay results from an entirely different decay mode, it represents a contamination of our sample. We remove the contribution by subtracting the events in the 1.9–2.0 region of the invariant-mass distribution of Fig. 2 that exceed the interpolation of the bin contents in the 1.8–1.9 and 2.0–2.1 regions. The removed contribution amounts to events, and the remaining events in the 1.9–2.0 region total .
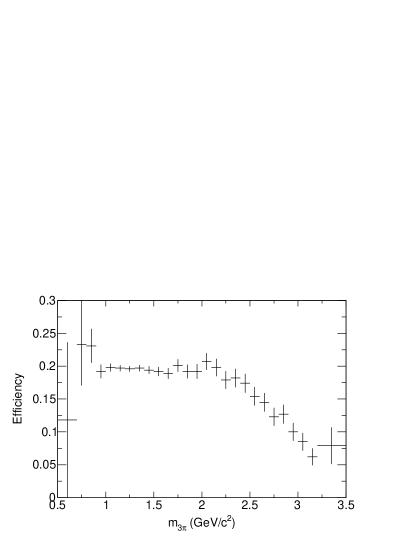
We estimate the reconstruction efficiency as a function of invariant-mass using MC-simulated events. This is shown in Fig. 3. Since we model the PDF of the signal only considering candidates that are correctly reconstructed, we apply exactly the same procedure of determining the signal yield in our study of the reconstruction efficiency in order to determine the branching fraction correctly. The efficiency of the decay channel , where the decays to and the to was studied. The simulation assumes a mass of 1.230 and a width of 400 MeV for the ref:pdg . The reconstruction efficiencies of and decays are consistent with decays. Taking into account the efficiency as a function of the mass, and removing the background, the total number of produced events is estimated to be .
Figure 3:
The reconstruction efficiency as a function of invariant-mass using MC-simulated events. The uncertainties are statistical.
Table 1: Summary of systematic uncertainties. The uncertainties are assumed to be uncorrelated, and so are added in quadrature.
Source
Uncertainty (%)
Fit algorithm and peaking backgrounds
2.4
Track-finding
2.0
invariant-mass modeling
1.7
and decay branching fractions
1.3
decay branching fraction
1.2
identification
1.1
Signal efficiency MC statistics
0.9
Sideband subtraction
0.7
counting
0.6
Total
4.3
Table 2: Fit parameters obtained from MC-simulated events. These parameters are fixed to the central values in the signal extraction procedure. We perform a toy study where we simultaneously vary these by the quoted uncertainties (along with their correlations, which are not shown in the table) to study systematic effects on the signal yield.
Parameter
Value
peaking background Gaussian mean
peaking background Gaussian width
Number of peaking background
peaking background Gaussian mean
peaking background Gaussian width
Number of peaking background
Signal’s Crystal Ball PDF cutoff value
Signal’s Crystal Ball PDF power-law value
Table 1 summarizes the systematic uncertainties for this analysis. The uncertainties of our extended-maximum-likelihood fit algorithm and peaking backgrounds are estimated together by taking into account the uncertainties of the fixed parameters in the fit. The values we used are shown in Table 2. These values are obtained entirely from studies of MC-simulated background samples. Therefore, we consider varying the mean and width of the distributions for the peaking and backgrounds, the number of and peaking background events, and the Crystal Ball PDF cutoff and power-law parameter values for the signal. These values are sampled from an eight-dimensional Gaussian function with means, widths, and correlations that correspond to the fit results for the PDF’s for signal and peaking backgrounds simulated events. The systematic uncertainty is taken as the standard deviation of the distribution of the number of signal events from an ensemble of fits, and is found to be 2.4%. The systematic uncertainty due to track finding consists of two components: 1.54% for laboratory momenta less than 0.18 , a region dominated by tracks from the decay , and 0.26% for greater than this value ref:tracking . The two components are added in quadrature. The pion from the decay has momentum less than 0.180 62% of the time. The corresponding fraction for other pions in the signal decay is 5%. There are differences between the reconstructed invariant-mass spectrum for the data and that obtained from MC-simulated events. We studied the signal yield before and after reweighting the invariant-mass spectrum in the MC-simulated events to match the data. The observed change due to the reweighting of the mass distribution is 1.7%, which we assign as the associated systematic uncertainty. This also accounts for uncertainties in the relative contributions of the different decay modes and the mass and width of the resonance. We use the and decay branching fraction uncertainties from Ref. ref:pdg . We use the value of from Ref. ref:pdg for the branching fraction of the decay , which has a relative uncertainty of 1.2%. The kaon identification uncertainty is estimated by comparing the number of events in data and MC simulations with and without implementing identification requirements. According to dedicated studies using BABAR data control samples, we correct for kaon-identification efficiency differences between data and MC simulation by a factor of , where the uncertainty is chosen to be half the difference from unity. The signal efficiency MC statistical uncertainty is 0.9%. Nominally, we subtract the mass distribution in the sideband from that of the signal region. However, the mass distribution of both peaking and non-peaking backgrounds in the signal region may not necessarily be the same as that in the sideband. To estimate the associated systematic uncertainty, we test the sideband subtraction procedure using only MC-simulated background events. After applying efficiency corrections to the resulting distribution, we obtain an integral of 571. Dividing this by the number of efficiency-corrected signal in the data, this translates to a 0.7% difference, which we assign as the associated systematic uncertainty. The number of mesons produced is uncertain to 0.6% Lees:2013rw . We study the MC modeling of decay angle correlations, and found the associated systematic uncertainty to be negligible. As described earlier in the text, there is a peaking background contribution in the distribution due to signal events that are misreconstructed. The rate of this background depends on the branching fraction of signal events. Using our measured branching fraction value, we apply corrections to the expected number of peaking background and repeat the signal extraction procedure on the data. There is a small bias on the branching fraction value but it is negligible compared to the systematic uncertainty due to the other peaking backgrounds.
From the number of fitted signal events, corrected for efficiency and normalized to the total number of produced mesons in the data sample, and taking into account the and branching fractions we derive , where the first uncertainty is statistical and the second systematic. The result is consistent with the current world average and is 2.4 times more precise. This result can be used as input for measurements of using hadronic decays in the search for deviations from the SM. The inclusive branching fraction value without removing the contamination is .
We are grateful for the
extraordinary contributions of our PEP-II colleagues in
achieving the excellent luminosity and machine conditions
that have made this work possible.
The success of this project also relies critically on the
expertise and dedication of the computing organizations that
support BABAR.
The collaborating institutions wish to thank
SLAC for its support and the kind hospitality extended to them.
This work is supported by the
US Department of Energy
and National Science Foundation, the
Natural Sciences and Engineering Research Council (Canada),
the Commissariat à l’Energie Atomique and
Institut National de Physique Nucléaire et de Physique des Particules
(France), the
Bundesministerium für Bildung und Forschung and
Deutsche Forschungsgemeinschaft
(Germany), the
Istituto Nazionale di Fisica Nucleare (Italy),
the Foundation for Fundamental Research on Matter (The Netherlands),
the Research Council of Norway, the
Ministry of Education and Science of the Russian Federation,
Ministerio de Economía y Competitividad (Spain), the
Science and Technology Facilities Council (United Kingdom),
and the Binational Science Foundation (U.S.-Israel).
Individuals have received support from
the Marie-Curie IEF program (European Union) and the A. P. Sloan Foundation (USA).
References
(1)
J.P. Lees et al. (BABAR Collaboration),
Phys. Rev. D 88, 072012 (2013).
(2)
M. Huschle et al. (Belle Collaboration),
Phys. Rev. D 92, 072014 (2015).
(3)
R. Aaij et al. (LHCb Collaboration),
Phys. Rev. Lett. 115, 111803 (2015).
(4)
K.A. Olive et al. (Particle Data Group),
Chin. Phys. C 38, 090001 (2014).
(5)
R. Aaij et al. (LHCb Collaboration),
Phys. Rev. D 87, 092001 (2013).
(6)
B. Aubert et al. (BABAR Collaboration),
Nucl. Instr. Methods Phys. Res. Sect. A 479, 1 (2002).
(7)
B. Aubert et al. (BABAR Collaboration),
Nucl. Instr. Methods Phys. Res. Sect. A 729, 615 (2013).
(8)
J. P. Lees et al. (BABAR Collaboration),
Nucl. Instr. Methods Phys. Res. Sect. A 726, 203 (2013).
(9)
D. J. Lange,
Nucl. Instr. Methods Phys. Res. Sect. A 462, 152 (2001).
(10)
S. Agostinelli et al. (Geant4 Collaboration),
Nucl. Instr. Methods Phys. Res. Sect. A 506, 250 (2003).
(11)
A. Höcker et al., PoS ACAT, 040 (2007), arXiv:physics/0703039.
(12)
S. Brandt et al., Phys. Lett. 12, 57 (1964).
(13)
J. Bjorken and S. Brodsky, Phys. Rev. D 1, 1416 (1970).
(14)
G. C. Fox and S. Wolfram, Nucl. Phys. B 149, 413 (1979).
(15)
M. J. Oreglia, Ph.D. thesis, SLAC, Report No. SLAC-R-236, 1980;
J. E. Gaiser, Ph.D. thesis, SLAC, Report No. SLAC-R-255, 1982;
T. Skwarnicki, Ph.D. thesis, INP and DESY, Report No. DESY-F31-86-02, 1986.
(16)
H. Albrecht et al. (ARGUS Collaboration),
Phys. Lett. B 241, 278 (1990).
(17)
T. Allmendinger et al.,
Nucl. Instr. Methods Phys. Res. Sect. A 704, 44 (2013).