equal contributions]
equal contributions]
corresponding author]
River-bed armoring as a granular segregation phenomenon
Abstract
Gravel-river beds typically have an “armored” layer of coarse grains on the surface, which acts to protect finer particles underneath from erosion. River bed-load transport is a kind of dense granular flow, and such flows are known to vertically segregate grains. The contribution of granular physics to river-bed armoring, however, has not been investigated. Here we examine these connections in a laboratory river with bimodal sediment size, by tracking the motion of particles from the surface to deep inside the bed, and find that armor develops by two distinct mechanisms. Bed-load transport in the near-surface layer drives rapid segregation, with a vertical advection rate proportional to the granular shear rate. Creeping grains beneath the bed-load layer give rise to slow but persistent segregation, which is diffusion dominated and insensitive to shear rate. We verify these findings with a continuum phenomenological model and discrete element method simulations. Our results suggest that river beds armor by granular segregation from below — rather than fluid-driven sorting from above — while also providing new insights on the mechanics of segregation that are relevant to a wide range of granular flows.
- Keywords
-
granular flow, creep, riverbed armoring, granular segregation
Introduction
River-bed grain size controls the exchange of solutes, nutrients and fine particulates across the sediment-fluid interface (packman2004hyporheic, ; brunke1997ecological, ), and determines the flood magnitude required to initiate motion (phillips2014dynamics, ; mueller2005variation, ; wilcock1993critical, ). Grain size, however, also evolves over a series of floods as particles are sorted longitudinally and vertically during transport (parker1982gravel, ; dietrich1989sediment, ; fedele2007similarity, ; phillips2014dynamics, ). A ubiquitous pattern observed in gravel-bed rivers is armoring, in which the median grain size of the surface is significantly larger than that of the subsurface (Fig. 1 A). Laboratory experiments designed to simulate gravel rivers — i.e., bed-load transport of heterogeneous grain sizes — reproduce the phenomenon, but disagree on its origins. Three competing mechanisms have been proposed: (i) kinetic sieving, in which smaller particles migrate downward through the void spaces between larger particles during motion (frey2009river, ); (ii) ’equal mobility’, whereby the proportion of large and small surficial grains adjusts to achieve a spatially constant entrainment stress (parker1982gravel, ); and (iii) sediment supply imbalance, in which the transport capacity of the flow locally exceeds the upstream supply and results in surface coarsening (dietrich1989sediment, ). All of them assume that gravel in transport only mixes with the substrate over a small “active layer” that is one to several grain diameters deep.
Recently, sediment transport experiments have revealed that granular motion extends much deeper into the subsurface (aussillous2013investigation, ; houssais2015onset, ). In particular, grains transition continuously from rapid bed-load motion at the surface to slow creeping motion far below the surface (houssais2015onset, ; houssais2015rheology, ). Both kinds of motion also occur in dry granular systems, where bed-load corresponds to a dense granular flow, and creep is characteristic of quasi-static deformation of disordered granular packs (houssais2015onset, ; houssais2015rheology, ). The former is known to produce robust vertical size segregation by kinetic sieving (savage1988, ; makse1997possible, ; gray2005theory, ). Phenomenological continuum models based on this premise (gray2015particle, ; gray2005theory, ; fan2011theory, ; staron2015stress, ) produce vertical segregation that is consistent with experimental observations (gray2015particle, ; wiederseiner2011experimental, ) and discrete element method (DEM) simulations (fan2014modelling, ; hill2014segregation, ). Segregation by creep is unexplored; while reports of slow coarsening do exist Finger2014 , its connection to creep has not been demonstrated.
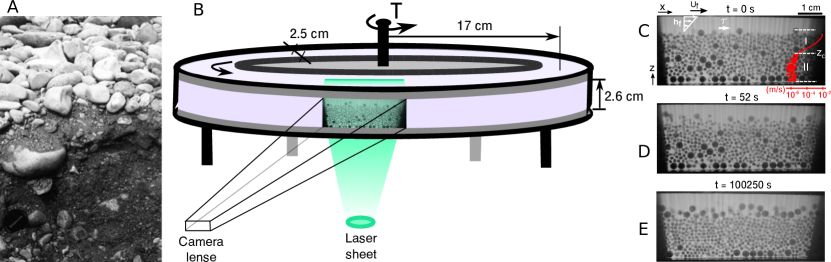
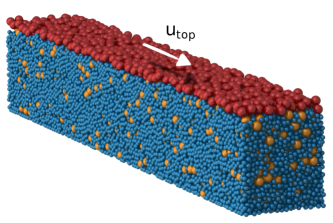
The contribution of granular physics to river-bed armoring has only begun to be examined. Frey and Church (frey2009river, ) showed with laboratory experiments that bed load drives segregation by kinetic sieving that is qualitatively similar to dense granular flows. Here we investigate granular segregation and quantify its contribution to armoring using an idealized laboratory river experiment. Our setup [Fig.1B] is designed to: eliminate the disruptive influence of flume boundaries by using an annulus; image particle motion from the sediment-fluid interface to deep in the subsurface, away from the wall; isolate granular contributions by simplifying particles to bimodal spheres and eliminating fluid turbulence with a viscous fluid; and explore a range of transport conditions from near threshold to vigorous bed load. These experiments demonstrate how river-bed armor can develop due to bottom-up motion of subsurface grains, while revealing new insight on granular segregation mechanisms in a system where rapid and slow granular flows co-exist. Results are compared with predictions from a modified phenomenological segregation model, and with DEM simulations of a dry-granular bed under shear.
Experiments
Experiments were conducted in a closed-top annular flume (Fig.1B); details of the apparatus have been described previously (houssais2015onset, ; houssais2015rheology, ). The channel walls are smooth to allow slip between grains and the boundary, in order to approximate an infinitely deep and wide channel. The flume is filled with a bidisperse granular bed of acrylic spherical grains with small and large diameters, mm and mm, respectively, and density ; the ratio of total small to large grain volume in the channel is . The grains are submerged in a fluid of viscosity mPa s and density mL-1. A fluid gap is sheared from above by rotating the lid of the flume to apply a constant fluid-boundary shear stress, (Fig.1C); it is reported here as dimensionless Shields number for the small grains, defined as , where is gravity. The associated Shields stress for large grains as . For reference, Shields numbers for each experiment are compared to the critical Shields number, , that is classically used to identify the onset of sediment transport. Our previously determined critical Shields number for a monodisperse bed of small grains, (houssais2015onset, ), is used here as the reference critical stress, recognizing that the actual value may differ in this bidisperse system (houssais2012bedload, ). We determined empirically for the present experiments that the range of Shields numbers corresponds to bed-load transport: a thin surface layer of moving grains in frequent contact with, and supported by, an underlying granular bed that is creeping (houssais2015onset, ). We report data from experiments conducted at five Shields numbers, . All flows were laminar (Reynolds number ) and grain collisions were viscously damped (Stokes number ) (see SI, section 1).
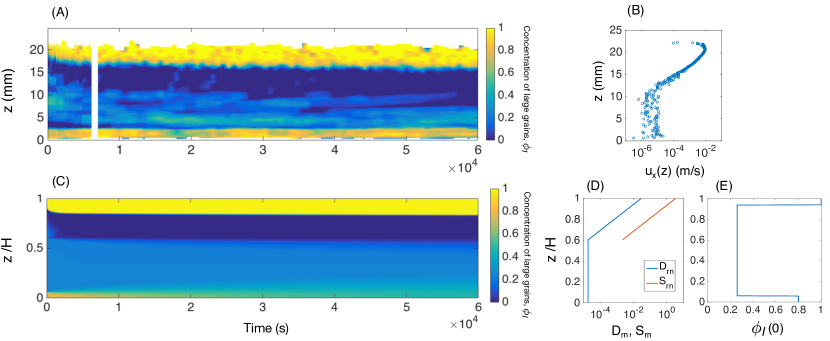
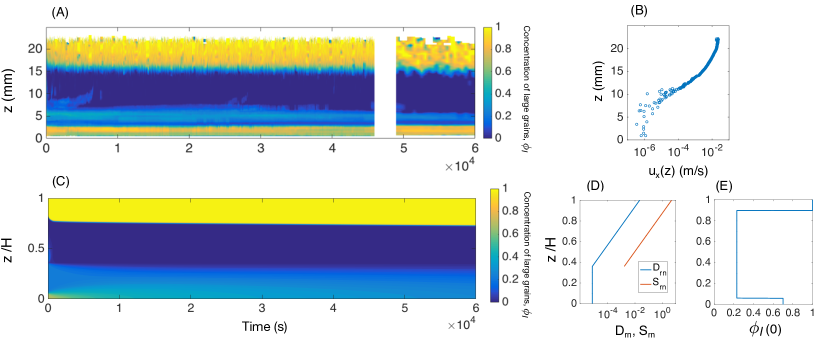
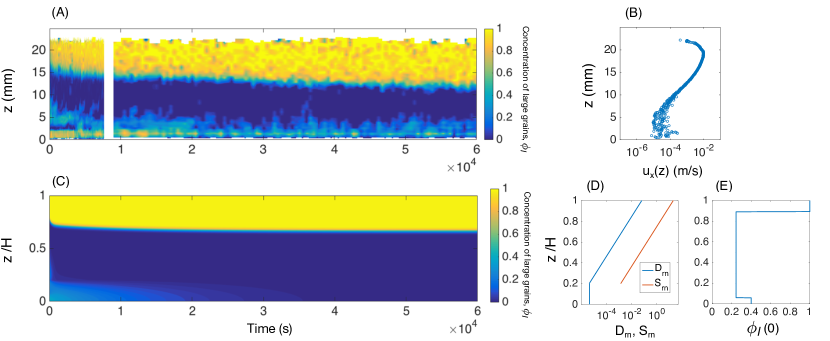
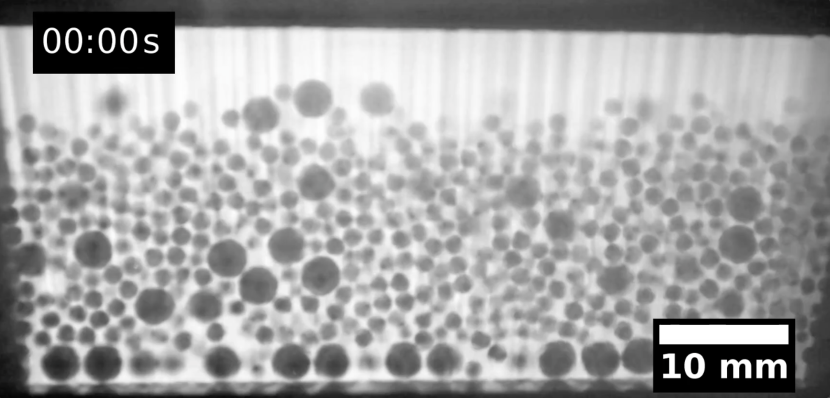
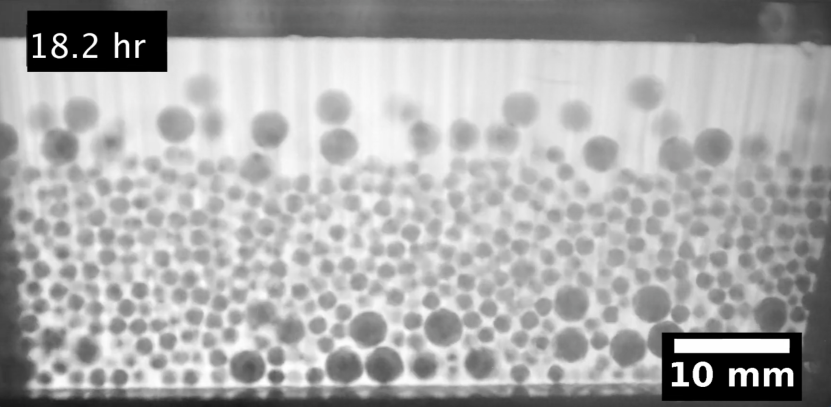
The bed at the start of each experiment was composed of sedimented particles forming an approximately flat granular bed (see Methods). At the beginning of an experiment ( ) fluid shear was initiated at the specified Shields stress, and applied for a duration of or longer. We image a cross-section of particles from the bed surface () to the bottom of the channel through time using refractive-index matched scanning (dijksman2012invited, ) (Figs. 1B; S2). Vertical profiles of streamwise particle velocity () for experiments at all Shields stresses were determined from averaging pixel strips in the streamwise direction over all time, using image cross-correlation (SI, section 4). Velocity profiles confirm the existence of two distinct regions of particle motion (Fig, 1C). Zone I corresponds to bed load, where velocity decays rapidly with depth below the surface; below this is zone II associated with creep, characterized by a much slower decay (houssais2015onset, ). All runs show a qualitatively similar evolution of the bed through time: a coarse surface “armor” layer develops as large grains are delivered from below; first more rapidly by bed load, and then more slowly by creep (Fig. 1, SI Movies 1 & 2). This is explored in more detail below.
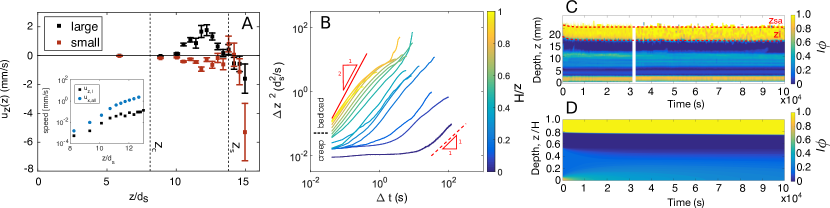
In order to probe the size- and depth-dependent behavior of grain motion, and its contribution to vertical segregation, we construct trajectories of all imaged grains using the particle tracking method (houssais2015onset, ) (see Methods) for a representative experiment at Shields stress . Profiles of average vertical velocity for large () and small () grains, computed from these trajectories, show a striking pattern: they are anti-correlated in the bed-load regime, with net upward (positive) velocity for large grains and net downward (negative) velocity for small grains. Although there are deviations in the near-surface (within of ) due to intermittent saltation, below this region the velocity of large grains decreases with depth and reaches approximately zero at the transition from bed load to creep () (Fig. 2A). The decay rate of is roughly exponential, and coincides with the decay of the bulk streamwise velocity (Fig. 2A-inset). This suggests that the observed vertical advection of larger grains is linked to horizontal granular shear in the bed-load zone.
Grains in the creep zone have a small but detectable vertical velocity. To determine the dominant modes of particle motion in bed load and creep, we inspect the scaling of the mean-square displacements (MSD) versus time. For the same experiment at we compute the vertical MSD as a function of depth for the large grains as over a duration of 20 minutes; the brackets indicate ensemble averaging over grains and the reference time , and is the particle’s vertical position (Fig. 2; see Methods). A distinction can be made between grains above and below the depth associated with the transition from bed load to creep. Grains in the bed-load zone exhibit MSD growth at short times that approaches ballistic motion, and is consistent with the advection described earlier (Fig. 2A). The strength of the advection behavior diminishes at larger timescales where it perhaps transitions to super-diffusive behavior. In contrast, grains in the creep zone appear to exhibit caged dynamics in which MSD grows slowly or not at all at short timescales. Motion transitions toward diffusive and sometimes super-diffusive dynamics at longer times. The crossover timescale indicates the average lifetime of cages, and it increases with depth into the creeping zone. This behavior is similar to what has been observed in slow granular flows (wandersman2012particle, ; marty2005subdiffusion, ; choi2004diffusion, ), and indicates that particle movement in creep is related to creation and destruction of the granular contact network (howell1999stress, ; choi2004diffusion, ).
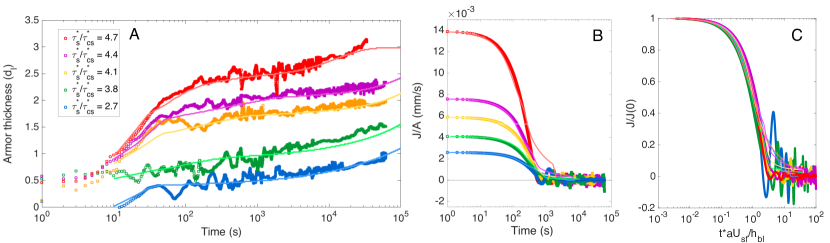
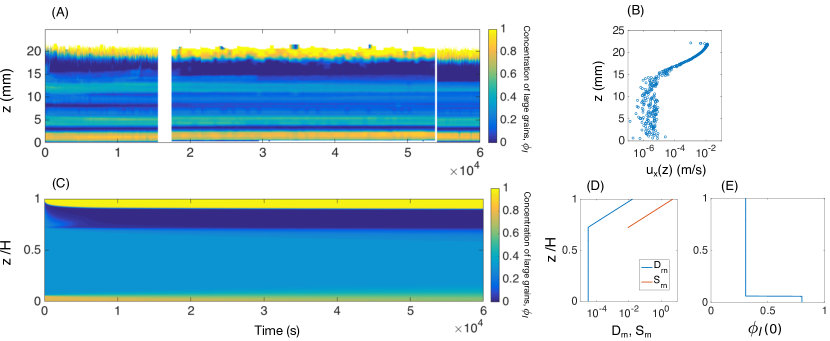
To visualize the resulting development of surface armor, we examine the spatio-temporal concentration map of large grains; represents the streamwise-averaged areal fraction at a given depth and time (see Methods). The development of surface armor is seen as a high-concentration surficial layer that thickens through time (Figs. 2C; S4-S8). We quantify the thickness of the armor layer (Fig. 2 C) as , where and are the position of the top and bottom surfaces that define the armor layer, respectively (SI, section 5) for all five Shields stress experiments. The data suggest the existence of two stages in the creation of armor, anticipated by the granular dynamics described above (Fig. 3 A). First is rapid segregation (duration of - ), as large grains are delivered up from the shallow subsurface. The rate of segregation shows a strong dependence on the driving Shields number, consistent with shear-rate dependent segregation of bed load. Once the bed-load zone is depleted of large grains, there follows a slow but persistent segregation that continues for the duration of the run (). We interpret the slow stage of segregation as creep driven. Interestingly, the rate of segregation in this stage is insensitive to the driving Shields number, suggesting that creep segregation does not depend strongly on the driving shear rate.
Armor development in our experiments results from a vertical flux ( direction) of coarse grains toward the bed surface. We quantify this segregation flux, , as the time derivative of the number of large grains in the armored layer:
| (1) |
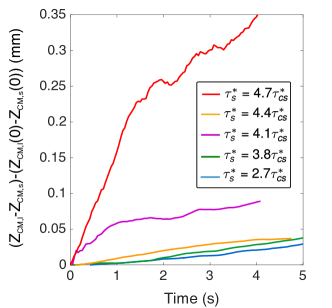
where is the cross-sectional area of the armor interface in the plane. The variation of segregation flux density () with time (Fig. 3B) clearly shows the existence of two stages of armor formation. We introduce a dimensionless time , where the characteristic advection time ; , and are the average large grain velocity, the average surficial grain velocity and the thickness of the bed-load layer, respectively, and is measured for the experiment at , but the value for collapses all data later in Fig. 3C. We also define a dimensionless segregation flux where is the initial value for at the start of each experiment. Utilizing the dimensionless time and flux variables produces a reasonable collapse of the data (Fig. 3C). For all experiments decays to a value of at a characteristic dimensionless time of .
Advection-diffusion segregation model
Sediment transport produces armoring that appears similar to reported granular segregation experiments (gray2015particle, ; savage1988, ), implying that the presence of a viscous fluid has little influence beyond determining the shear rate of surficial grains. In particular, some previous experiments in dry granular flows suggested that segregation rate depends on the granular shear rate (golick2009mixing, ; may2010shear, ), consistent with our findings for bed load (although another study found otherwise (wiederseiner2011experimental, )). In addition, a recent study found that particle diffusion was shear-rate dependent for rapid granular flows but independent of shear rate for creep (fan2015shear, ), similar to our experiments. Because the exact mechanism of segregation is still a subject of debate (staron2015stress, ; hill2014segregation, ; schroter2012granular, ), there is no universally agreed upon continuum theory. Nonetheless, one-dimensional (1D) continuum models generally describe the vertical evolution of concentrations of binary mixtures through time with a phenomenological advection-diffusion equation (gray2015particle, ; fan2014modelling, ). Here we develop and apply a modified version of one such model, the Gray-Thornton model (Gray2015, ; gray2005theory, ). The model requires specification of: vertical advection and diffusion coefficients, usually assumed to be constant (gray2005theory, ); the vertical granular velocity profile; and the initial concentration profile. It then solves for the temporal segregation of large and small grains subject to mass conservation constraints. Two new ingredients must be included to account for the granular dynamics observed in our experiments: (i) for the bed-load regime, both advection and diffusion depend on shear rate; and (ii) for the creep regime there is no advection, and diffusion is independent of shear rate (fan2015shear, ). Our modified advection-diffusion segregation model, written in terms of the evolution of the large-grain concentration , becomes:
| (2) |
Equation 2 is written in terms of dimensionless elevation and time , where and are the height of the granular pack and the length of the centerline of the annular flume. The flux function determines the dependence of the segregation flux () on . Although there are ongoing debates on the mathematical form of the flux function (van2015underlying, ; Gray2015, ), we implement the simplest choice: a quadratic function that is symmetric about , which assumes that small and large grains behave identically but in opposite directions. The original Gray-Thornton model assumed a non-dimensional advective segregation velocity that is independent of shear rate. We introduce a depth-dependent parameter, , in order to redistribute the non-dimensional advective segregation velocity, , according to the depth-dependent grain velocity, , normalized by the vertical average of grain velocities, (Eq. 3).
| (3) |
The form of the normalized velocity is determined by a fit to the bed-load velocity profile such that:
| (4) |
where is the exponential decay constant of the bed-load velocity profile. Accordingly, for our analysis we define the parameter , where is the maximum bulk advective segregation velocity, i.e., that associated with the start of the experiment (; see SI section 6; Fig. S3). Similarly, we introduce a dimensionless and vertically-varying diffusivity that has the same exponential decay as the velocity profile characterized by (Eq. 5). The parameter is a non-dimensional diffusive-remixing constant, where is the dimensional diffusivity.
| (5) |
To apply the new model Eq. 2 to our experiments requires specification of several parameters, determined from each experimental run (see Methods and SI). The input velocity profile is determined by fitting two exponential functions to the time-averaged velocity profiles of the bed-load and creep zones, respectively (see Methods; Fig. S6). The input value for is computed as the upward migration velocity of the center of mass for the large particles at the start of each experiment (see Methods). Note that the advective segregation term in Eq. 3 decays with decreasing velocity (and depth) in the bed-load zone, and is set to zero in the creep zone (). The diffusivity also decays with velocity (and depth) in the bed-load zone, and is constant for creep (Fig. S6 E). We take the dimensionless diffusion constant as a fitting parameter. In particular, the ratio is estimated by fitting the position of the armor interface through time for each experiment. We find that a constant ratio of for the bed-load zone and for the creep zone is sufficient to describe the development of armor for all Shields numbers. We use the profile of at the start of our experiments () as the initial concentration profile for the continuum model (Fig. S6F).
A visual comparison of armor development for the example condition shows that the advection-diffusion segregation model (Eq. 2) captures the experimental behavior well (Fig. 2D). A more quantitative comparison of the thickness of the armored layer through time (Fig. 3 A) demonstrates good agreement between the model and data for all Shields numbers. Importantly, the model correctly captures the initial fast and subsequent slow stages of segregation. The large ratio for confirms the idea that the rapid stage of armor development is driven by shear-rate dependent advection associated with bed load. The fact that the ratio remains constant for all experiments suggests that the model results are robust. The bulk kinetics can be related to particle-scale advection and diffusion by noting that , where the particle-scale ratio of advection to diffusion is given by the Peclet number . For the experiment with we determined from measurements that mm/s and /s, which leads to and ; the latter is the same order of magnitude as the ratio used in the continuum simulations. The creeping zone is characterized by a constant value for , and a lack of advection (), for . This supports the notion that the slow stage of armoring results from diffusion by creeping grains that is independent of local shear rate.
Discrete Element Modeling
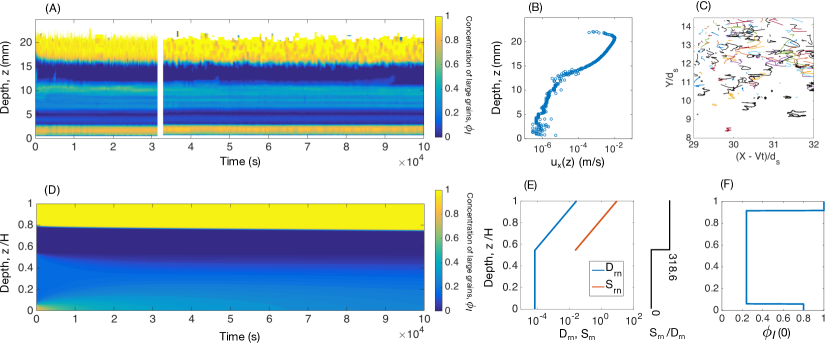
The analysis presented thus far shows how explicit accounting for the kinematics of granular motion in bed load and creep can produce a reasonable continuum description of armor development. In order to demonstrate that the observed armoring in experiments is entirely a consequence of granular physics, we now turn to DEM simulations in which the velocity profile and segregation dynamics arise spontaneously from grain-grain interactions. Simulations are performed with LIGGGHTS, an open-source granular modeling package based on LAMMPS (http://lammps.sandia.gov). Details of model implementation are available in Methods and Supplementary Information. In accord with the low Stokes number of our laboratory experiments, the restitution coefficient is chosen to be very small () such that collisions are highly damped (Table S2). Otherwise, there is no treatment of the viscous fluid in DEM simulations.
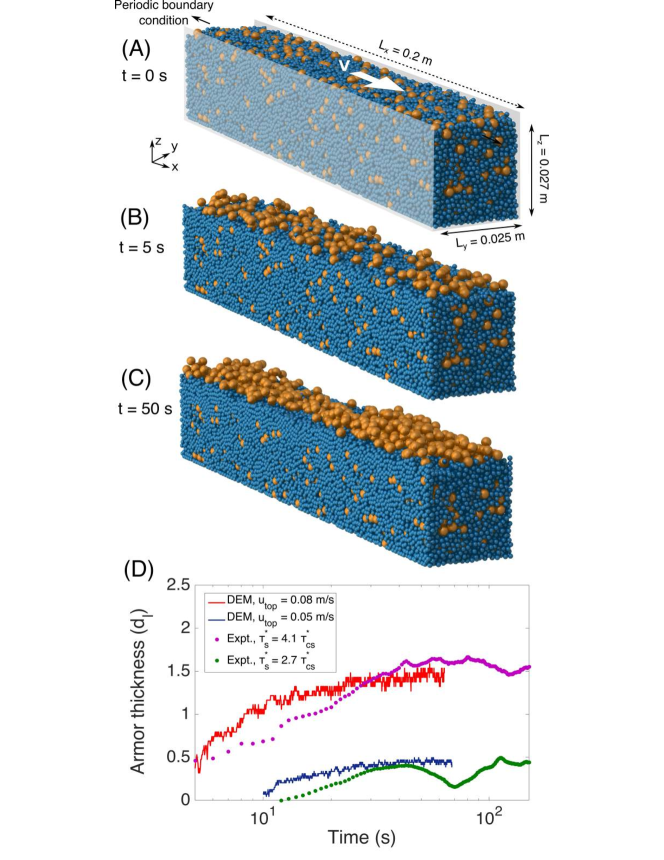
The model domain is constructed to have a geometry, grain size and size-volume ratio that are the same as the experimental setup (Fig. 4A). The system is driven by a layer of large grains deposited at the surface and moving at constant velocity in the direction. Simulations are run for a duration that is equivalent to due to their computational expense; however, we show below that this is sufficient time to observe the fundamental dynamics. Simulations show behavior that is qualitatively comparable to the fluid-driven experiments of armoring, confirming the existence of two stages of segregation (Fig. 4). First is fast segregation within the rapid granular flow regime (first few grain diameters from the surface). Then, once grains are depleted from this “bed load” zone (Fig. 4C), armoring transitions to a slow stage driven by creep from deeper layers.
For a more direct comparison, we examine the growth of armor thickness through time (see Methods) for the previous simulation and an additional run with (m/s) which corresponds to . For both runs the agreement of DEM simulations with the experiments is reasonably good (Fig. 4D). This agreement is especially encouraging given that: simulations neglect fluid flow entirely; the initial concentration of large grains in the experiments was difficult to control and not uniform; and there was no tuning or calibration done for the DEM runs, beyond adjusting the velocity of surface grains to match experiments.
Discussion
Even though our flows were laminar, experiments and theory have shown that laminar bed load is similar to its turbulent counterpart in many respects (charru2004erosion, ; houssais2012bedload, ; ouriemi2009sediment, ; maurin2016dense, ; du2003granular, ). Our results show armoring dynamics that are qualitatively similar to previous experiments (hassan2006experiments, ; esurf-4-461-2016, ) conducted under conditions more representative of gravel rivers — i.e., poly-disperse and natural-shaped particles (average grain diameter ) in turbulent flows with driving stress . Those studies (hassan2006experiments, ; esurf-4-461-2016, ) found a Shields-stress dependent armoring rate with a relatively rapid initial stage (a few hours) followed by slower stage. While data on particle motions were not reported, we can perform a scale analysis of the expected bed-load armoring timescale due to granular segregation, , by assuming: (devries2002bedload, ); (lajeunesse2010bed, ; drake1988bedload, ); and our experimentally-determined value . This analysis yields , within the observed range of experiments (hassan2006experiments, ; esurf-4-461-2016, ), and may be a reasonable bed-load armoring timescale for natural gravel rivers. Translation to the field, however, may need to account for the presence of bed and bar forms that can influence armor formation (marion1997experimental, ).
Authors of previous experiments (dietrich1989sediment, ; hassan2006experiments, ; esurf-4-461-2016, ) attributed armor development to a lack of sediment supply to the channel, which they hypothesize resulted in winnowing of fines and concentration of coarse grains — in other words, sediment-supply imbalance. Our experiments, however, showed no significant size-selective transport at the surface and, more importantly, there were no supply limitations because the flume is annular. We can thus rule out sediment-supply imbalance for our experiments. Our results support the kinetic sieving model, on which the phenomenological Gray-Thornton equation is based. An important new finding, however, is that segregation does not occur only in the “active layer”. If the bed-load zone corresponds to the active layer, then the associated sorting is important but occurs rapidly. Creep delivers grains from far below the bed-load zone to the surface, contributing to persistent armor development that was not previously recognized. The agreement of DEM simulations and experiments confirm the contention of Frey and Church (frey2009river, ) that river-bed armoring is a granular segregation phenomenon, and suggest minimal influence of the fluid beyond determining the surface grain velocity. We point out that sediment-supply imbalance may still be important for armoring in some rivers; in particular, under sediment limitations such as downstream of dams where river beds experience net erosion that may preferentially remove finer grains (dietrich1989sediment, ). The granular segregation dynamics revealed here, however, would operate in all environments regardless of sediment supply and may therefore be more prevalent. Future experiments with more ’natural’ flow and particle conditions, that control for sediment supply while also examining precise granular motion from the surface to the bottom of the granular pack, would be helpful for assessing the relative importance of these different mechanisms. A potential field confirmation of the armoring mechanism proposed here would be the observation of a zone underneath the armor layer that is almost entirely depleted of large grains (Figs. 2C and D). Size-selective surficial transport would not be expected to influence the concentration of coarse grains beneath the armor layer.
Our work sheds new light on the mechanics of granular segregation. Experiments clearly show that vertical advection of large grains is shear-rate dependent. Explicit accounting of this dependence, and also of shear-rate dependent diffusion, is needed in order to explain observed segregation rates for the rapid granular flow regime (i.e., bed load). Moreover, data and models demonstrate that creep contributes to segregation, and that its mechanism is distinct from rapid granular flows. Large grains in the creep zone show no preference for upward- or downward-directed motion. Their long-time motion may be modeled as vertically-isotropic and constant diffusion. Short-time dynamics show that creeping grains are caged, and indicate that their motion is likely induced by long-range transmission of forces through the granular contact network (lherminier2014revealing, ; aste2002stress, ). This may be why creep motion is independent of shear rate, at least for the range of Shields stresses examined here. It is intriguing that isotropic diffusion in creep can give rise to a net upward flux of large grains. Based on our results, we hypothesize that this flux arises because large grains that cross the boundary into bed load are then advected to the surface. If correct, this implies that a purely creeping granular pack (no bed load) should not produce armoring.
The experimental and modeling results presented here are a first step in assessing the contribution of fast and slow particle motion to vertical segregation. Our sediment mixture was bi-disperse in order to establish connections between granular shear segregation and river-bed armoring, but many systems of interest (including rivers) have a polydisperse grain size distribution that may exhibit different behavior. Such a distribution would challenge the application of continuum models, but is amenable to experimental and DEM simulation approaches. River-bed armoring in our experiments and models was found to be driven by bottom-up granular segregation, rather than top-down surficial sorting driven by the fluid. Our findings show how information from the surface, in terms of fluid-driven shear, is transmitted deep into the subsurface through grain-grain interactions that are typically neglected in sediment transport models. Granular motion in the subsurface transmits information back to the surface through the delivery of coarse grains, linking surface dynamics to subsurface structure. By examining the river bed as a discrete medium, we were able to link the macroscopic pattern of armor development to the physics of sheared granular systems. Our results add to a growing body of evidence that sediment transport systems belong to a broader class of granular flows (frey2009river, ; capart2011transport, ; houssais2015onset, ; houssais2015rheology, ), and show how examining geophysical flows through the lens of granular physics can reveal novel insights for both fields.
Materials and Methods
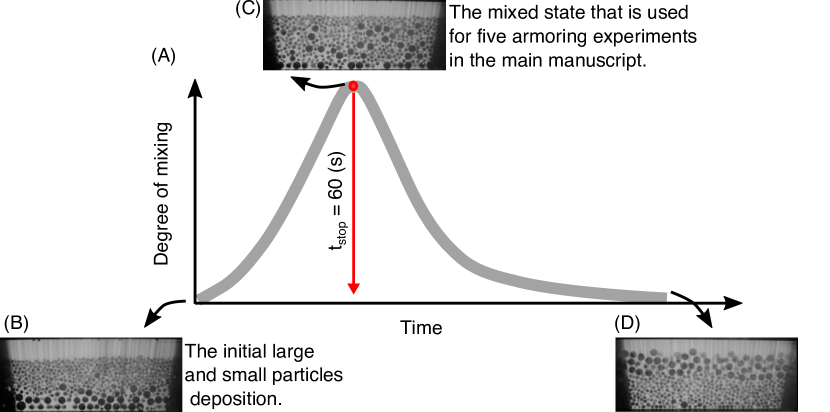
Details of the experimental setup and shearing protocol are described in SI section 1. The bed preparation protocol was inspired by Golick and Daniels (golick2009mixing, ). Grains were initially deposited in an inverse-segregated state, with large grains at the bottom, and then subject to a driving stress equivalent to for 1 minute to fully suspend and mix the large and small populations. Fluid shear was halted and the suspension left for 30 minutes to allow sedimentation, relaxation and compaction of the granular bed to reach completion (Fig. S1).
Implementation of the continuum model is described in SI section 6 (Figs. S3-S8; Table S1). Details of the DEM model and parameters appear in SI section 7 (see Table S2). The local concentration of large grains is defined as, where and are large and small grains areas, respectively, and indicates pixel-wise streamwise integration.
Acknowledgments
Research was supported by US Army Research Office–Division of Earth Materials and Processes grant 64455EV, US National Science Foundation (NSF) grant EAR-1224943, NSF INSPIRE/EAR-1344280, and NSF MRSEC/DMR-1120901. BF is a synthesis postdoctoral fellow of the National Center for Earth-surface Dynamics (NCED2 NSF EAR-1246761).
Supplementary Information
1 Experimental setup and protocol
To generate 2D images of our 3D experimental system, we index-matched PMMA particles (, , Engineering Laboratories) with a mixture of viscous oils (85% of PM550 and 15% of PM556 from Dow Corning), and excited a dye (Exciton, pyrromethene 597) dispersed in the oil with a green laser sheet (517 nm, 50mW) of thickness . The experiment was conducted on a vibration-damping optical table, while a damping coupler was used to connect the driving motor to the flume.
The granular bed for each experiment was prepared with the same protocol: grains were initially deposited in an inverse-segregated state, with large grains at the bottom, and then subject to rotation that is a driving stress equivalent to for 1 minute in order to mix the large and small populations. This shear stress was sufficient to fully suspend all particles in the channel. Fluid shear was then stopped completely and the suspension was left for 30 minutes to allow time for sedimentation, and relaxation and compaction of the granular bed, to reach completion. Figure S1 provides further information about the preparation protocol. The final random packed layer at the end of the preparation protocol had a thickness for all experiments. Then, a constant rotation drove the system during the entire experiment. The duration of the experiment was not fixed; each lasted long enough ( or longer) for all particles present in the recorded frames to exhibit some significant displacement during the run. We computed the fluid-flow depth , where is the total depth of the flume and is the elevation of the surface as described below. We compute the fluid-flow velocity at the top plate in the channel center as , where is the radial distance to the channel center. The fluid boundary-shear stress is then calculated as . For our definition of , and throughout our analysis, we assume the fluid flow is laminar and unidirectional in the azimuthal direction of the annular flume. The laminar assumption is justified because the Reynolds number associated with the fluid channel above the bed is small. We estimate this Reynolds number as , which is for the largest in these experiments. The unidirectional assumption is justified based on the small ratio of radial viscous stress to the azimuthal viscous stress for our experimental conditions:
| (6) |
where , is the flume radius and is an estimated coefficient (charru2004erosion, ) that is only weakly dependent on the flow aspect ratio.
2 Detection of the bed surface
In order to detect the surface position, first the concentration profile for a given configuration of particles is determined from a processed binary image, valued at zero outside of particles and one inside of particles. For each elevation , the concentration is determined as the pixel-wise average in the direction. This concentration is the analogue of packing fraction, the fraction of space occupied by the particles. The surface is defined as the position at which the concentration crosses fifty percent of its saturated value (duran2012numerical, ; houssais2015onset, ). We use a fixed threshold of 0.35 to define the surface position, as the saturated value does not vary significantly from experiment to experiment. We define after averaging the concentration for a at the beginning of each experiment. The time duration is sufficiently long for the flux convergence time as observed in our earlier study (houssais2015onset, ). Slow granular compaction (ben1998slow, ; richard2005slow, ) and slow dilation due to segregation [30] approximately counterbalance such that the surface position remains almost constant as the armoring experiments progress. The bed surface position is used for calculating the Shields stress at each experiment.
3 Imaging technique and particle detection/tracking
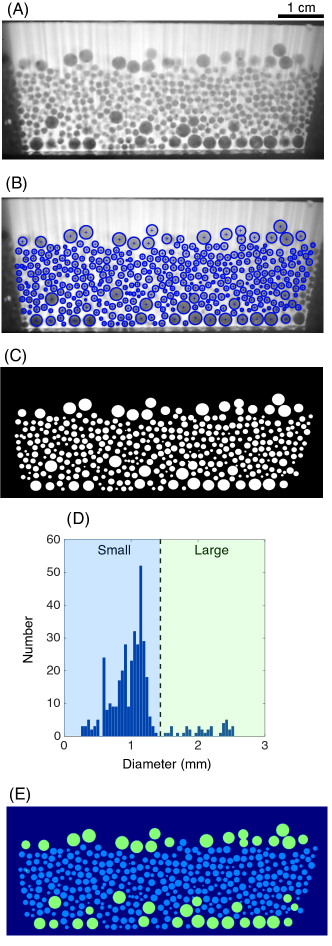
Using a Nikon DSLR 5100 digital camera, we record the real-time positions of single particles by acquiring the fluorescence intensity from a laser dye (concentration ) dispersed in the fluid that is suitable for long data acquisition without significant photobleaching. To sample fast dynamics near the surface, where the relevant timescale is the settling time of particles over their own diameter , we acquire images continuously at for . To sample slow dynamics in the bed, we acquire single images at a rate of one every for or longer. Figure S2A shows a sample raw image at the start of an experiment. To detect the positions of the particles with subpixel accuracy, we find particle positions to pixel accuracy by peak-finding above a threshold. The details of the background correction process are described in the supplementary materials of our previous publication (houssais2015onset, ). The process is designed specifically to handle both long-wavelength background intensity variations and intermediate wavelength fluctuations (stripes) due to slight mismatches in the index of refraction of the particles relative to the fluid. After removing the background, we determine sub-pixel positions using the radial symmetry method (loy2003fast, ). We use this method to identify radially symmetric features at different probing length scales. Then, features are identified as peaks in the three-dimensional image , over a range of radii that is sampled linearly in log-radius. Peaks are obtained by two passes, first a pixel-scale search, then a local quadratic fit to obtain subpixel positions. A snapshot of detected particles with this method is superimposed on a gray-scale raw image and is shown in Figure S2B. The same detected particles are also shown in binary format in Figure S2C. A fixed diameter threshold of is used for separating large and small particles in all experiments as shown in Figure S2D. Finally, a snapshot of identified large and small particles using this threshold is shown in Figure S2E.
We stitch positions at different frames into tracks using Lagrangian particle tracking (ouellette2006quantitative, ).
4 Velocity profiles
For each experiment, a 10 minute video capture with frame rate 24 fps at the start of the experiments is converted and processed into consecutive binary images following the procedure described in imaging section above. The consecutive binary images, and are then used as the input of pixel-wise cross-correlation analysis along the direction at each pixel elevation . The position of the central peak in the cross-correlation between and corresponds to the average streamwise distance traveled by gains at elevation during without regard to small and large particle species, i.e. for all particles. The result is averaged over the full duration of the video capture. This technique yields a time-averaged streamwise velocity profile for all particles. Note, large particles are weighted more heavily than small particles. The results are in agreement with velocity profiles determined from the particle-tracking method for all experiments. For the case of Figure 2A, the velocity profile of large grains is computed using the particle tracking method described in the imaging technique section above.
5 Determination of armor thickness
The top surface of the armor layer, , is characterized as the position where the streamwise averaged concentration of large grains equals . The interface (bottom) of the armor layer with the rest of the granular bed, , is calculated as the location where the gradient of reaches a minimum below the surface. The surface and interface positions time-series are smoothed using a running average of temporal window size for images obtained from video capture conversions and temporal window size for image captures. These are shown with dashed lines in Fig. 2C. The thickness of the armored layer is defined as .
6 Implementation of continuum model
The variables used to compute the advection and diffusion parameters for each experiment are reported in Table [S1]. The maximum bulk segregation velocity, , for each experiment is measured from relative displacement of the vertical component of the center of mass position of large particles relative to small particles . The data for the relative displacement for all five stresses is presented in Figure S3. The initial concentration profile of large particles is determined from the first s of each experimental run; a simplified version of it is used as another input to the PDE model (Figs. S4 to S8). The time-averaged streamwise velocity profiles for each experiment are reported in Figs. S4 to S8 and are used to estimate the value of . We use a numerical implementation of the method of lines solution to solve the PDE equations and use time steps for the full experimental time (). Comparisons of the concentration maps for the PDE model and experiments, for the four additional driving stresses, are presented in the supplementary materials (Figs. S4 to S8).
| Shields number, | value | ||
|---|---|---|---|
| 2.30e1 | 7.0e-3 | 1.1e-3 | |
| 1.85e1 | 1.5e-2 | 1.4e-3 | |
| 1.30e1 | 6.0e-2 | 3.3e-3 | |
| 1.25e1 | 8.5e-2 | 5.2e-3 | |
| 1.20e1 | 9.0e-2 | 6.2e-3 |
7 Implementation of DEM
The DEM model consists of a shear cell with sizes m in the directions, and has a length in direction where periodic boundary conditions are applied. The lateral sides in the plane and the lower boundary in the plane are smooth and frictional walls, with the same mechanical and frictional properties as the grains (Table S2).
| Parameter | Value |
|---|---|
| Grain density, | 1190 |
| Grain diameters, d | [ = 0.0015, = 0.003] m |
| Gravitational acceleration, | 9.81 |
| Young’s modulus, | |
| Poisson ratio, | 0.45 |
| Friction coefficient, | 0.5 |
| Coefficient of restitution, | 0.01 |
| Time step, | s |
| Shear velocity, | [0.05, 0.08] |
The top side in the plane is open. The cell is filled with N =38812 grains that are initially inserted randomly in the cell with a desired volume fraction of 0.45. It is then equilibrated under gravitational forces for 10 million time steps equivalent to s. The initial concentration of large grains is uniform in the simulation domain. The grains are free to move in other directions (e.g. to dilate) in order to resemble a free-surface and shear-driven system. The grains are modeled as compressible spheres of diameter that interact when in contact via the Hertz-Mindlin model (johnson1987contact, ; landau1959theory, ; mindlin1949compliance, ):
| (7) |
where the first term is total normal force, , and the second term is total tangential force, . In Equation 7, and are normal and tangential stiffness respectively, is the overlap between grains, is the normal damping, is the relative grain velocity, is the normal vector at grain contact, is the tangential vector at grain contact, is the tangential damping. The full model implementation is available on the LAMMPS/LIGGGHTS webpage and several references (zhang2005jamming, ; silbert2001granular, ; brilliantov1996model, ). In accord with the low Stokes number of our laboratory experiments, the restitution coefficient is chosen to very small () such that collisions are highly damped (Table S2). Otherwise, there is no treatment of the viscous fluid in DEM simulations. The DEM model system is frictional, meaning that the coefficient of friction, , is the upper limit of the tangential force through the Coulomb criterion . The tangential force between two grains grows according to non-linear Hertz-Mindlin contact law until and is then held at until the grains lose contact. The values of density, grain diameter, Poisson’s ratio and acceleration due to gravity are chosen to match the experimental conditions. The values for coefficient of restitution and friction coefficient are chosen to mimic the effects from interactions with the fluid. The Young’s modulus of the particles used here is chosen to be low (Table S2), MPa rather than GPa, in order to increase the calculation time step and decrease computational cost; however, since the system is not under significant confining pressure, a softer grain-grain interaction will not have considerable effect on the results, and the simulation remains in the hard-sphere limit. The particles are sufficiently hard that we find no additional rescaling of time is necessary. The damping coefficients and are determined within the implementation of LIGGGHTS from the chosen value for the restitution coefficient, .
Movie S1
Movie S2
References
- [1] Aaron I Packman, Mashfiqus Salehin, and Mattia Zaramella. Hyporheic exchange with gravel beds: basic hydrodynamic interactions and bedform-induced advective flows. Journal of Hydraulic Engineering, 130(7):647–656, 2004.
- [2] Matthias Brunke and TOM Gonser. The ecological significance of exchange processes between rivers and groundwater. Freshwater biology, 37(1):1–33, 1997.
- [3] CB Phillips and DJ Jerolmack. Dynamics and mechanics of bed-load tracer particles. Earth Surface Dynamics, 2(2):513, 2014.
- [4] Erich R Mueller, John Pitlick, and Jonathan M Nelson. Variation in the reference shields stress for bed load transport in gravel-bed streams and rivers. Water Resources Research, 41(4), 2005.
- [5] Peter R Wilcock. Critical shear stress of natural sediments. Journal of Hydraulic Engineering, 119(4):491–505, 1993.
- [6] Gary Parker and Peter C Klingeman. On why gravel bed streams are paved. Water Resources Research, 18(5):1409–1423, 1982.
- [7] William E Dietrich, James W Kirchner, Hiroshi Ikeda, and Fujiko Iseya. Sediment supply and the development of the coarse surface layer in gravel-bedded rivers. Nature, 340(6230):215–217, 1989.
- [8] Juan J Fedele and Chris Paola. Similarity solutions for fluvial sediment fining by selective deposition. Journal of Geophysical Research: Earth Surface, 112(F2), 2007.
- [9] Philippe Frey and Michael Church. How river beds move. Science, 325(5947):p–1509, 2009.
- [10] Pascale Aussillous, Julien Chauchat, Mickael Pailha, Marc Médale, and Élisabeth Guazzelli. Investigation of the mobile granular layer in bedload transport by laminar shearing flows. Journal of Fluid Mechanics, 736:594–615, 2013.
- [11] Morgane Houssais, Carlos P Ortiz, Douglas J Durian, and Douglas J Jerolmack. Onset of sediment transport is a continuous transition driven by fluid shear and granular creep. Nature communications, 6, 2015.
- [12] M Houssais, CP Ortiz, DJ Durian, and DJ Jerolmack. Rheology of sediment transported by a laminar flow. arXiv preprint arXiv:1509.08395, 2015.
- [13] S. B. Savage and C. K. K. Lun. Particle size segregation in inclined chute flow of dry cohesionless granular solids. Journal of Fluid Mechanics, 189:311–335, 1988.
- [14] Hernán A Makse, Pierre Cizeau, and H Eugene Stanley. Possible stratification mechanism in granular mixtures. Physical review letters, 78(17):3298, 1997.
- [15] JMNT Gray and AR Thornton. A theory for particle size segregation in shallow granular free-surface flows. In Proceedings of the Royal Society of London A: Mathematical, Physical and Engineering Sciences, volume 461, pages 1447–1473. The Royal Society, 2005.
- [16] John Mark Nicholas Timm Gray, Parmesh Gajjar, and Peter Kokelaar. Particle-size segregation in dense granular avalanches. Comptes Rendus Physique, 16(1):73–85, 2015.
- [17] Yi Fan and KM Hill. Theory for shear-induced segregation of dense granular mixtures. New journal of physics, 13(9):095009, 2011.
- [18] L Staron and JC Phillips. Stress partition and microstructure in size-segregating granular flows. Physical Review E, 92(2):022210, 2015.
- [19] Sébastien Wiederseiner, Nicolas Andreini, Gaël Épely-Chauvin, Gaudenz Moser, Mathieu Monnereau, JMNT Gray, and Christophe Ancey. Experimental investigation into segregating granular flows down chutes. Physics of Fluids (1994-present), 23(1):013301, 2011.
- [20] Yi Fan, Conor P Schlick, Paul B Umbanhowar, Julio M Ottino, and Richard M Lueptow. Modelling size segregation of granular materials: the roles of segregation, advection and diffusion. Journal of Fluid Mechanics, 741:252–279, 2014.
- [21] KM Hill and Danielle S Tan. Segregation in dense sheared flows: gravity, temperature gradients, and stress partitioning. Journal of Fluid Mechanics, 756:54–88, 2014.
- [22] Tilo Finger, Matthias Schröter, and Ralf Stannarius. The mechanism of long-term coarsening of granular mixtures in rotating drums. New Journal of Physics, 17(9):093023, sep 2015.
- [23] D Mark Powell. Patterns and processes of sediment sorting in gravel-bed rivers. Progress in Physical Geography, 22(1):1–32, 1998.
- [24] Morgane Houssais and E Lajeunesse. Bedload transport of a bimodal sediment bed. Journal of Geophysical Research: Earth Surface, 117(F4), 2012.
- [25] Joshua A Dijksman, Frank Rietz, Kinga A Lőrincz, Martin van Hecke, and Wolfgang Losert. Invited article: Refractive index matched scanning of dense granular materials. Review of Scientific Instruments, 83(1):011301, 2012.
- [26] Elie Wandersman, Joshua A Dijksman, and Martin Van Hecke. Particle diffusion in slow granular bulk flows. EPL (Europhysics Letters), 100(3):38006, 2012.
- [27] G Marty and Olivier Dauchot. Subdiffusion and cage effect in a sheared granular material. Physical review letters, 94(1):015701, 2005.
- [28] Jaehyuk Choi, Arshad Kudrolli, Rodolfo R Rosales, and Martin Z Bazant. Diffusion and mixing in gravity-driven dense granular flows. Physical review letters, 92(17):174301, 2004.
- [29] Daniel Howell, RP Behringer, and Christian Veje. Stress fluctuations in a 2d granular couette experiment: a continuous transition. Physical Review Letters, 82(26):5241, 1999.
- [30] Laura A Golick and Karen E Daniels. Mixing and segregation rates in sheared granular materials. Physical Review E, 80(4):042301, 2009.
- [31] Lindsay BH May, Laura A Golick, Katherine C Phillips, Michael Shearer, and Karen E Daniels. Shear-driven size segregation of granular materials: Modeling and experiment. Physical Review E, 81(5):051301, 2010.
- [32] Yi Fan, Paul B Umbanhowar, Julio M Ottino, and Richard M Lueptow. Shear-rate-independent diffusion in granular flows. Physical review letters, 115(8):088001, 2015.
- [33] Matthias Schröter and Karen E Daniels. Granular segregation in dense systems: the role of statistical mechanics and entropy. arXiv preprint arXiv:1206.4101, 2012.
- [34] John Mark Nicholas Timm Gray, Parmesh Gajjar, and Peter Kokelaar. Particle-size segregation in dense granular avalanches. Comptes Rendus Physique, 1:1–13, 2015.
- [35] Kasper van der Vaart, Parmesh Gajjar, Gaël Epely-Chauvin, Nicolas Andreini, JMNT Gray, and Christophe Ancey. Underlying asymmetry within particle size segregation. Physical review letters, 114(23):238001, 2015.
- [36] François Charru, Hélene Mouilleron, and Olivier Eiff. Erosion and deposition of particles on a bed sheared by a viscous flow. Journal of Fluid Mechanics, 519:55–80, 2004.
- [37] Malika Ouriemi, Pascale Aussillous, and Elisabeth Guazzelli. Sediment dynamics. part 1. bed-load transport by laminar shearing flows. Journal of Fluid Mechanics, 636:295–319, 2009.
- [38] Raphael Maurin, Julien Chauchat, and Philippe Frey. Dense granular flow rheology in turbulent bedload transport. arXiv preprint arXiv:1602.06712, 2016.
- [39] Sylvain Courrech du Pont, Philippe Gondret, Bernard Perrin, and Marc Rabaud. Granular avalanches in fluids. Physical review letters, 90(4):044301, 2003.
- [40] Marwan A Hassan, Roey Egozi, and Gary Parker. Experiments on the effect of hydrograph characteristics on vertical grain sorting in gravel bed rivers. Water Resources Research, 42(9), 2006.
- [41] C. Orrú, A. Blom, and W. S. J. Uijttewaal. Armor breakup and reformation in a degradational laboratory experiment. Earth Surface Dynamics, 4(2):461–470, 2016.
- [42] Paul DeVries. Bedload layer thickness and disturbance depth in gravel bed streams. Journal of Hydraulic Engineering, 128(11):983–991, 2002.
- [43] Eric Lajeunesse, Luce Malverti, and François Charru. Bed load transport in turbulent flow at the grain scale: Experiments and modeling. Journal of Geophysical Research: Earth Surface, 115(F4), 2010.
- [44] Thomas G Drake, Ronald L Shreve, William E Dietrich, Peter J Whiting, and Luna B Leopold. Bedload transport of fine gravel observed by motion-picture photography. Journal of Fluid Mechanics, 192:193–217, 1988.
- [45] Andrea Marion and Luigi Fraccarollo. Experimental investigation of mobile armoring development. Water Resources Research, 33(6):1447–1453, 1997.
- [46] S Lherminier, R Planet, G Simon, L Vanel, and O Ramos. Revealing the structure of a granular medium through ballistic sound propagation. Physical review letters, 113(9):098001, 2014.
- [47] Tomaso Aste, Tiziana Di Matteo, and E Galleani d’Agliano. Stress transmission in granular matter. Journal of Physics: Condensed Matter, 14(9):2391, 2002.
- [48] Hervé Capart and Luigi Fraccarollo. Transport layer structure in intense bed-load. Geophysical Research Letters, 38(20), 2011.
- [49] Orencio Durán, Bruno Andreotti, and Philippe Claudin. Numerical simulation of turbulent sediment transport, from bed load to saltation. Physics of Fluids (1994-present), 24(10):103306, 2012.
- [50] Eli Ben-Naim, JB Knight, ER Nowak, HM Jaeger, and SR Nagel. Slow relaxation in granular compaction. Physica D: Nonlinear Phenomena, 123(1):380–385, 1998.
- [51] Patrick Richard, Mario Nicodemi, Renaud Delannay, Philippe Ribiere, and Daniel Bideau. Slow relaxation and compaction of granular systems. Nature materials, 4(2):121–128, 2005.
- [52] Gareth Loy and Alexander Zelinsky. Fast radial symmetry for detecting points of interest. Pattern Analysis and Machine Intelligence, IEEE Transactions on, 25(8):959–973, 2003.
- [53] Nicholas T Ouellette, Haitao Xu, and Eberhard Bodenschatz. A quantitative study of three-dimensional lagrangian particle tracking algorithms. Experiments in Fluids, 40(2):301–313, 2006.
- [54] Kenneth Langstreth Johnson and Kenneth Langstreth Johnson. Contact mechanics. Cambridge university press, 1987.
- [55] Lev Davidovich Landau and Evgenii Mikhailovich Lifshitz. Theory of elasticity. 1959.
- [56] RD Mindlin. Compliance of elastic bodies in contact. J. of Appl. Mech., 16, 1949.
- [57] HP Zhang and HA Makse. Jamming transition in emulsions and granular materials. Physical Review E, 72(1):011301, 2005.
- [58] Leonardo E Silbert, Deniz Ertaş, Gary S Grest, Thomas C Halsey, Dov Levine, and Steven J Plimpton. Granular flow down an inclined plane: Bagnold scaling and rheology. Physical Review E, 64(5):051302, 2001.
- [59] Nikolai V Brilliantov, Frank Spahn, Jan-Martin Hertzsch, and Thorsten Pöschel. Model for collisions in granular gases. Physical review E, 53(5):5382, 1996.