Tuning the Kondo effect in Yb(Fe1-xCox)2Zn20
Abstract
We study the evolution of the Kondo effect in heavy fermion compounds, Yb(Fe1-xCox)2Zn20 (0 x 1), by means of temperature-dependent electric resistivity and specific heat. The ground state of YbFe2Zn20 can be well described by a Kondo model with degeneracy = 8 and a 30 K. In the presence of a very similar total CEF splitting with YbFe2Zn20, the ground state of YbCo2Zn20 is close to a Kondo state with degeneracy = 2 and a much lower 2 K. Upon Co substitution, the coherence temperature of YbFe2Zn20 is suppressed, accompanied by an emerging Schottky-like feature in specific heat associated with the thermal depopulation of CEF levels upon cooling. For 0.4 x 0.9, the ground state remains roughly the same which can be qualitatively understood by Kondo effect in the presence of CEF splitting. There is no clear indication of Kondo coherence observable in resistivity within this substitution range down to 500 mK. The coherence re-appears at around x 0.9 and the coherence temperature increases with higher Co concentration levels.
I Introduction
The Zn20 ( = rare earth elements. = transition metals) series of compounds were discovered two decades ago, in 1997Nasch et al. (1997). They crystallize in a cubic, CeCr2Al20 type structure (space group Fdm) where ions occupy a single crystallographic site. The nearest, and next-nearest neighbors of ions are all Zn and thus varying the transition metal does not significantly alter the local environment of the . Even though more than 85 of the atomic constituents are zinc, these compounds exhibit myriad physical properties depending on the rare earth and transition metal that are involvedJia et al. (2007a, b, 2009); Canfield et al. (2008); Torikachvili et al. (2007). When the rare earth element is Yb, there are six closely related YbZn20 heavy fermion compounds for = Fe, Ru, Os, Co, Rh, IrTorikachvili et al. (2007); Mun et al. (2012). Among these six compounds, YbCo2Zn20 has the largest Sommerfeld coefficient, 7900 mJ/mol-K2. This value is comparable to the record holding YbBiPtFisk et al. (1991), and is more than an order of magnitude larger than the other members in this family, which have values ranging from 520 mJ/mol K2 for YbFe2Zn20 to 740 mJ/mol K2 for YbRh2Zn20Torikachvili et al. (2007). The reason behind the dramatic difference between YbCo2Zn20 and the other five YbZn20 compounds is still not clear, although band structure calculations reveal that the 4f level is closer to the Fermi level in YbCo2Zn20 than in YbFe2Zn20. Upon Co substitution, the d band is gradually filled, which is accompanied by a drop in d band energyTanaka and Kubo (2010).
Being the heaviest of the YbZn20 compounds, YbCo2Zn20 has been studied intensively ever since its discoveryTorikachvili et al. (2007). Upon application of pressure, there is an indication that the heavy Fermi liquid regime can be suppressed, followed by the appearance of an antiferromagnetic ordering for 1 GPaSaiga et al. (2008). It has, therefore, been argued that YbCo2Zn20 is close to a quantum critical point (QCP)Saiga et al. (2008); Nakanishi et al. (2010). Similar suppressions of Fermi liquid regime under pressure were also observed for = Fe/Rh/IrKim et al. (2013); Matsubayashi et al. (2009, 2010). In the case of YbFe2Zn20, = 520 mJ/mol K2, and is thus likely to be further away from a QCP in terms of the Doniach diagram, indeed, a much higher critical pressure, around 10 GPa was proposed in order to reach a QCPKim et al. (2013). With an effective negative pressure induced by Cd substitution, the hybridization between Yb3+ 4f electrons in YbFe2Zn20 and the conduction electrons becomes weakerCabrera-Baez et al. (2016). Apart from pressure induced ordering, metamagnetic transitions were reported for YbCo2Zn20 at high magnetic fieldsShimura et al. (2011); Takeuchi et al. (2011a); Shimura et al. (2012); Honda et al. (2014). Crystalline electric field (CEF) schemes for YbCo2Zn20 have been proposed based on specific heat and anisotropic magnetization measurements. The first and the second excited CEF levels are around 10 K and 25 K above the ground state doubletTakeuchi et al. (2011b); Romero et al. (2014). Inelastic neutron scattering measurements show some excitations that might be related to these proposed CEF schemesKaneko et al. (2012). Experimentally, band structure had only been reported for YbCo2Zn20 via quantum oscillationsOhya et al. (2010), with heavy ground state being strongly suppressed by increasing field. In a zero field limit, the mass of the quasiparticles was extrapolated to be 100-500 times the free electron mass.
Given that (i) the first and second nearest neighbors of Yb3+ in YbZn20 do not have and (ii) as changes from Fe to Co the values of and change by an order of magnitude, it is of interest to see how the strongly correlated electron state evolves in Yb(Fe1-xCox)2Zn20 for 0x1. In this paper, we report the temperature-dependent resistivity and specific heat data on 19 members of the Yb(Fe1-xCox)2Zn20 series and track the effects of band filling and disorder on the coherence and Kondo temperatures as well as amounts of entropy removed by thermal depopulation of CEF levels versus Kondo state.
II Experimental Methods
Single crystals were grown using a high temperature solution growth techniqueJia et al. (2007a); Torikachvili et al. (2007). The starting molar stoichiometry was Yb::Zn = 2:4:94. Bulk elemental material (Yb from Ames Laboratory Material Preparation Center (99.9 absolute purity); Fe (99.98), Co (99.9+) and Zn (99.999) from Alfa Aesar) were packed in a frit-disc crucible setCanfield et al. (2016) and sealed in a silica tube under 0.25 bar of Ar atmosphere. The ampoule assembly was then heated up to 900 ∘C over three hours; dwelt at 900 ∘C for 10 hours and then cooled to 600 ∘C over 100 hours. At 600 ∘C, the remaining Zn rich solution was decanted from the crystals that formed on cooling. Samples were cut and polished so that magnetic field is applied along the [111] crystallographic direction. Resistivity was measured using a standard 4-probe technique in a Quantum Design (QD) Physical Property Measurement System (PPMS). Epotek-H20E silver epoxy was used to attach Pt wires onto the samples. Specific heat was measured using a QD PPMS. A dilution refrigerator option or a 3He option was utilized to perform measurements down to 50 mK or 500 mK. Elemental analysis was performed via wavelength dispersive spectroscopy (WDS) using an electron probe microanalyser of a JEOL JXA-8200 electron microprobe.
III Experimental Results
Fig. 1 shows the WDS determined Co concentration as a function of nominal Co concentration. Although the average value of the WDS determined concentration changes close to linearly with the nominal concentration, in the middle of the substitution range, the variation of the substitution level is large. The variation is based on WDS results measured at different spots on the sample as well as different samples in the same batch. Near the two ends of the series, the variation in substitution level is significantly smaller.
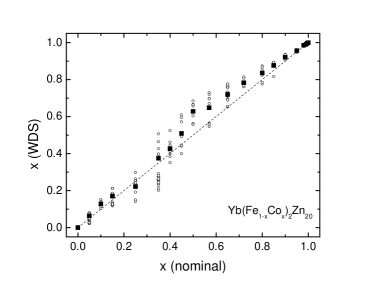
Fig. 2 shows the temperature-dependent resistivity data of Yb(Fe1-xCox)2Zn20 on semi-log plots. Fig. 2(a) shows data closer to the pure YbFe2Zn20 side. At x = 0, the resistivity of YbFe2Zn20 shows a broad shoulder at 40 K, after which it goes into a Kondo coherence. At low-temperature, YbFe2Zn20 manifests a temperature-dependence with the coefficient of resistivity, = 0.054 cm/K2[Torikachvili et al., 2007]. As the Co concentration increases, the resistivity value at 300 K increases, most likely as a result of increasing amount of scattering due to chemical disorder (i.e. Fe/Co). In addition, the temperature at which resistivity starts to decrease, after the low temperature shoulder or local maximum, gradually shifts to lower temperatures, indicating a lowering of the Kondo coherence temperature. At x = 0.064, the low-temperature resistivity still follow a behavior with = 0.113 cm/K2. This value doubles the value for YbFe2Zn20 (x = 0). The coefficient keeps increasing with Co concentration: 0.173 cm/K2 for x = 0.129 and 0.197 cm/K2 for x = 0.170. At x = 0.375, the low-temperature resistivity does not show a decrease and seems to saturate down to 500 mK. As x increases from 0 to 0.375, Yb(Fe1-xCox)2Zn20 evolves from a system with a clear Fermi liquid signature in transport to one that does not.
Fig. 2(b) shows resistivity data in the middle of the substitution range (0.375x0.875). None of the data shown have a clear signature of a resistivity drop that would be associated with a Kondo coherence. For x = 0.628 (blue star) and 0.719 (green dotted circle), the low-temperature resistivity data show a minor decrease which is followed by an secondary increase at a lower temperature. This is reminiscent of what one would expect from a CEF feature when lowering the temperature depopulates the CEF levels and thus change the degeneracy participating in the Kondo effectCornut and Coqblin (1972). However, it is unclear at this point if a coherence might be reached for these substitution levels for temperatures below 500 mK.
Fig. 2(c) presents data close to the pure YbCo2Zn20 side (0.875x1). Black hollow triangles show the resistivity data for pure YbCo2Zn20 which are consistent with the previously reported resultsTorikachvili et al. (2007). The resistivity increases with decreasing temperature below 50 K, indicative of a Kondo effect. The drop of resistivity below 2 K is an indication of Kondo coherence. With a small amount of substitution of Fe for Co, shown by the blue hollow circles (x = 0.991) and green hollow squares (x = 0.986), the temperature at which resistivity starts to drop decreases. With further Fe substitution, the Kondo coherence signature in resistivity could not be observed down to 500 mK as illustrated by purple bar (x = 0.957) and red star data (x = 0.875). Since the coherence temperature of YbCo2Zn20 is much lower than that for YbFe2Zn20, it takes less Fe substitution to suppress the coherence temperature of YbCo2Zn20 to below 500 mK.
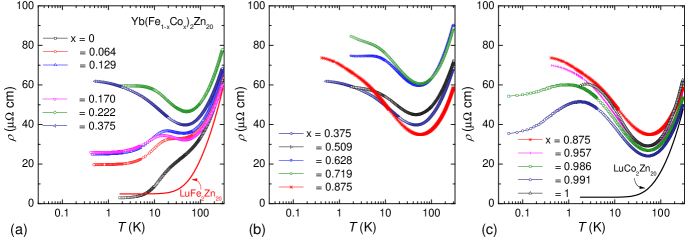
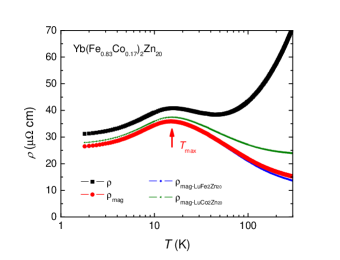
Fig. 3 illustrates the criteria that were used to infer characteristic temperatures for the Yb(Fe1-xCox)2Zn20 compounds from the resistivity data. The magnetic part of resistivity was estimated by subtracting a combination of the resistivity for the non-magnetic LuFe2Zn20 and LuCo2Zn20 with the same Fe/Co ratio. For example, in Fig. 3, the non-magnetic part of the resistivity data for Yb(Fe0.83Co0.17)2Zn20 were estimated as 0.83 + 0.17. Note, however, such subtraction does not take into account the disorder scattering introduced by Fe/Co substitution. The temperature of the maximum in was tracked as . For comparison, the magnetic part of the resistivity estimated by subtracting the resistivity of pure LuFe2Zn20 (blue diamonds) and LuCo2Zn20 (green triangles) as well as the resistivity of Yb(Fe0.83Co0.17)2Zn20 (black squares) are also shown in Fig. 3. The temperatures of the maximum in all these data sets are similar and consistent. In the absence of low-temperature data for non-magnetic subtraction below 1.8 K, the total resistivity data were then used to extract characteristic temperatures.
The temperature-dependent magnetic specific heat data for Yb(Fe1-xCox)2Zn20 are shown in Fig. 4. Similar to the magnetic part of the resistivity, the specific heat of LuCo2Zn20 and LuFe2Zn20 were used to perform non-magnetic background subtraction. Quantitatively, subtracting LuFe2Zn20 or LuCo2Zn20 only results in a 2 difference in the magnetic specific heat value and a 5 change in characteristic temperature values. Therefore, for all the doped samples, a consistent non-magnetic background specific heat of LuCo2Zn20 was subtracted.
The magnetic specific heat of YbFe2Zn20 (black squares in Fig. 4(a)) can be well explained by a = 8 Kondo resonance as shown by the brown solid lineRajan (1983). With Co substitution, the Kondo resonance peak moves towards lower temperature accompanied by a decrease in maximum value. At x = 0.064, the electronic specific heat, , increases from 520 mJ/mol K2 for YbFe2Zn20Torikachvili et al. (2007) to 690 mJ/mol K2. With more Co substitution, increases to 790 mJ/mol K2 for x = 0.129 and 890 mJ/mol K2 for x = 0.170. Together with the increase in the coefficient of resistivity, the positions of Yb(Fe1-xCox)2Zn20 (x = 0.064, 0.129 and 0.170) on the generalized Kadowaki-Woods plot gradually move toward the YbCo2Zn20 sideTorikachvili et al. (2007) as shown in the inset of Fig. 4(c). As Co substitution increases further, the single peak in YbFe2Zn20 gradually evolves to two maxima, as a result of competing energy scale of CEF splitting and the Kondo effectDesgranges (2014).
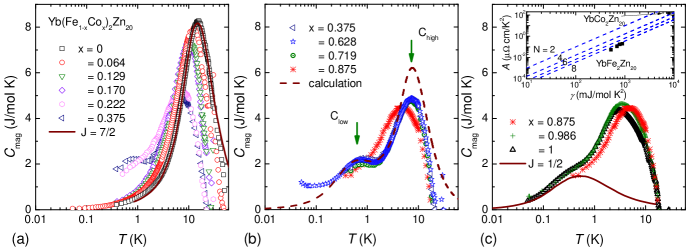
In between 0.375x0.719, the magnetic specific heat data show very similar behavior. We keep track of the two maxima temperatures as Chigh (maxima that locates at a higher temperature) and Clow (maxima that locates at a lower temperature) [Fig. 4(b)]. For x = 0.628, the specific heat was measured down to 50 mK. An upturn at below 100 mK was observed and will be discussed later. With more Co substitution, Chigh starts to move towards lower temperature.
Fig. 4(c) shows magnetic specific heat data close to the pure YbCo2Zn20 side. From a generalized Kadowaki-Woods plot, the degeneracy that is responsible for Kondo coherence for YbCo2Zn20 is in between 2 and 4. The specific heat can be tentatively understood with a spin 1/2 Kondo resonance with additional contribution from higher temperature Schottky peak-features due to CEF splittingTakeuchi et al. (2011b); Romero et al. (2014). The brown solid line presents the magnetic specific heat due to a spin 1/2 Kondo resonanceRajan (1983). It captures, for the most part, the low-temperature part of the measured data (black triangles), with differences at higher temperatures coming from CEF effects, suggesting a doublet CEF ground state. With addition of Fe, the high-temperature maximum moves towards higher temperature, indicating a small increase of CEF splitting. In the mean time, the low-temperature part of the specific heat sees a slight increase (green squares) at the base temperature. This feature may eventually evolve to an upturn seen for x = 0.628.
IV Discussion
Summarizing resistive and specific heat features presented above, we can plot characteristic temperatures of Yb(Fe1-xCox)2Zn20 as a function of Co concentration, x. In Fig. 5, the green diamonds and cyan triangles represent characteristic temperatures inferred from specific heat data and black circles were inferred from resistivity measurements. At a gross level, the phase diagram can be divided into three regions. Two regions are on the pure YbFe2Zn20 or YbCo2Zn20 sides where the original Kondo lattice characteristic temperatures gradually evolve with Fe/Co substitution. The third region is in the middle where all feature temperatures are relatively similar and do not significantly change or evolve with x.
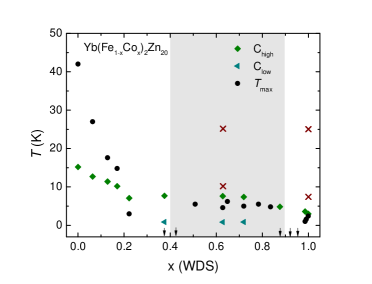
We first look at the two regions close to the pure YbFe2Zn20 and YbCo2Zn20 sides. The crossover from a high-temperature, single ion regime to a low-temperature coherent regime can usually be seen and inferred from temperature-dependent resistivity measurementsCox and Grewe (1988); Bauer (1991). In the coherent regime, the resistivity drops at low-temperature, becoming a heavy Fermi-liquid state. Both YbFe2Zn20 and YbCo2Zn20 have a heavy Fermi liquid ground state down to 50 mK as evidenced by linear specific heat and a dependence in resistivityTorikachvili et al. (2007); Canfield et al. (2008). On the YbFe2Zn20 side, Co substitution suppresses at roughly 1.8 K/Co. At x = 0.222, the is suppressed to 3 K. With more Co substitution, was suppressed below the base temperature of measurements. A similar situation happens on the YbCo2Zn20 side. is suppressed upon Fe substitution at roughly 1 K/Fe. Given a much smaller, initial value to start with, the trackable features quickly disappears to below 50 mK.
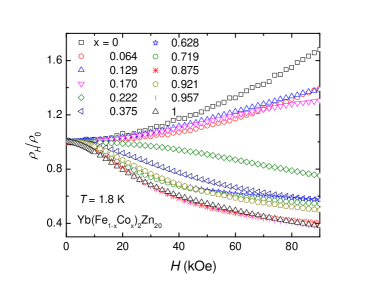
Magnetoresistance is sometimes used to probe the Kondo state at low temperature as wellAronson et al. (1989). The single ion Kondo regime has been theoretically calculated to show a negative magnetoresistanceSchlottmann (1983). In the coherent regime, the compound is essentially a heavy Pauli-paramagnetic metal. Magnetoresistance therefore is most commonly positive. The magnetoresistance for YbFe2Zn20 is positive at 1.8 K, which is consistent with a coherent state (Fig. 6). For YbCo2Zn20, prior to the metamagnetic transition, the magnetoresistance is also positive below 0.1 K whereas shows negative magnetoresistance above 3 KSaiga et al. (2009); Honda et al. (2014).
Magnetoresistance data are shown for various Co concentrations at 1.8 K in Fig. 6. Positive magnetoresistances for Co concentrations x 0.170 suggest a coherence at 1.8 K. Other members (x0.222) show negative magnetoresistances that suggest a single ion state. Assuming that the is commensurate with coherence temperature, together with the magnetoresistance data, the coherence is suppressed on both ends of the phase diagram (Fig. 5). In the middle of the substitution range, however, no clear indication of coherence could be determined at 1.8 K.
Specific heat features close to the pure YbFe2Zn20 and YbCo2Zn20 sides evolve gradually with chemical substitution. On the YbFe2Zn20 side, with Co substitution, Chigh moves to lower temperature, indicating a lowering of Kondo temperatureRajan (1983). On the pure YbCo2Zn20 side, where the Kondo temperature is smaller than the CEF splitting, with Fe substitution, Chigh moves towards higher temperature, indicating a slight increase of CEF splitting.
The Kondo coherence feature in specific heat is much more subtle and under debate. Various models have proposed a decrease of density of states at the Fermi energy due the formation of coherenceMartin (1982); Grewe (1984); Lacroix (1986); Kaga et al. (1988). Experimentally, this decrease of density of states was used to explain the low-temperature drop in (or ) in different systems, for example, in CeAl3Brodale et al. (1986); Bredl et al. (1984), CuCu6Fujita et al. (1985), CeNi2Ge2Knopp et al. (1988) and CeCu2Si2Bredl et al. (1984). However, a feature associated with coherence in specific heat is not always so apparent and is commonly missing, for example in YbNi2B2CYatskar et al. (1996), YbCuAlSchlottmann (1989), CeCoGe2Mun et al. (2004), YbAgCu4Rossel et al. (1987); Besnus et al. (1990) and CeNi9Si4Michor et al. (2003). A single ion model based on a Coqblin-Schrieffer analysisCoqblin and Schrieffer (1969); Rajan (1983) seems to describe these Kondo lattice systems very well, even in the coherent regime. For YbZn20, despite the fact that coherence emerges in resistivity at low-temperature, specific heat can be well captured by single ion Kondo effectTorikachvili et al. (2007).
Close to pure YbFe2Zn20 and YbCo2Zn20, it is shown above that upon Fe/Co substitution, the coherence temperatures on both sides are suppressed. The suppression of coherence is commonly achieved by substituting the moment bearing ions with non-moment bearing ionsStewart (2001). In the case of Yb(Fe1-xCox)2Zn20, moment bearing Yb-sites are always fully occupied and ordered. Substituting Fe/Co, however, will inevitably bring in chemical disorder as well as a change in band filling. As a consequence of chemical disorder, the decrease in mean free path of the conduction electrons, as can be represented by the increase of residual resistivity, may lead to a suppression of Kondo coherence temperaturePaglione et al. (2007). This is sometimes also seen in systems with artificially created defects with irradiationAdrian and Adrian (1989). Theoretically, it is proposed that disorder on the moment-bearing site (f-site) affects Kondo coherence more efficiently than disorder on the conduction-electron sites. To produce the same suppression of Kondo coherence temperature, energetically, f-sites disorder need to be equivalent to whereas conduction-electron sites need to be comparable to the band width of the conduction band, which is more difficultTešanović (1986). However, with a change of band filling due to Fe/Co substitution, disorder in the conduction electron sites could affect Kondo coherence in these Yb(Fe1-xCox)2Zn20 compounds.
The change in band filling due to Fe/Co substitution, on one hand, could be part of the disorder in conduction electrons in aforementioned theoretical model. On the other hand, it may lead to a change in the ratio of Kondo coherence temperature over Kondo temperature, /Pruschke et al. (2000). At half-filling, it is proposed that is larger than . Away from half-filling, drops quickly below Pruschke et al. (2000). It is possible that with changing band filling, decreases from both the YbFe2Zn20 and YbCo2Zn20 sides, which leaves a clear single ion Kondo effect with features associated with CEF population whereas showing no coherence or a very low coherence temperature. Such an extended range of low is observed in the middle region of the phase diagram. A change in band filling may be inferred from the density of states at Fermi energy. It worth noting that the density of states for YFe2Zn20 experiences a quick drop upon adding Co and stays relatively constant above 20 Co substitutionJia et al. (2007a). This is very similar to the suppression of close to the YbFe2Zn20 side. Close to the YCo2Zn20 side, though, there are not enough data density to make similar comparison to YbCo2Zn20.
We now move onto the middle region of the phase diagram shown in Fig. 5. Whereas there are clear changes of characteristic temperatures as the sample departs from perfect chemical order, in the middle region, for 0.4x0.9, characteristic temperatures stay fairly constant. It worth noting though, as shown in Fig. 1, the variation in concentration across a sample in this middle region may make the data blurred and offer only more qualitative information rather than quantitative.
In a single ion Kondo picture, different local moment degeneracy can give rise to unique features in thermodynamic and transport propertiesCoqblin and Schrieffer (1969); Cornut and Coqblin (1972); Bhattacharjee and Coqblin (1976). In the presence of crystalline electric field, features can be observed in temperature-dependent transport measurements, exhibited as broad maxima in resistivity, for example in CeAl2Nicolas-Francillon et al. (1972), CeCu2Si2Schneider et al. (1983), CePdInFujii et al. (1992), CeZn11Taufour et al. (2013). This was observed for several members of Yb(Fe1-xCox)2Zn20 series, in the middle substitution range, for example, x = 0.628 and 0.719. However, the CEF feature is not as clear as systems mentioned above. If the CEF levels are not well separated, given a certain combination of density of states and Kondo coupling, these broad maxima can be hard to observeCornut and Coqblin (1972). In the case of YbZn20, the CEF splitting is indeed small and may cause the CEF feature to be difficult to observe. Impurity scattering can also lead to a smear of Kondo CEF features. In YbNi2B2C, the improved sample quality after annealing dramatically changed the temperature-dependent transport properties. This can be attributed to a distribution of Kondo temperature in a non-ideal lattice with local defects and strainAvila et al. (2004). In Yb(Fe1-xCox)2Zn20, the substitution variation in the sample may cause such disorders even though transition metal is not in the direct neighborhood of the Yb ions.
To understand what happens in the middle of the substitution range in Yb(Fe1-xCox)2Zn20, more insights can be obtained from the specific heat data. In the presence of crystal fields, the temperature-dependence of magnetic specific heat in Kondo systems is complicated. An arbitrary CEF splitting has only been recently studied numerically for Ce-based compoundsDesgranges (2014). For Yb, more degeneracy, and levels, are involved. A quantitative interpretation of the temperature-dependent specific heat can be approached by combining a resonance model solution together with a, CEF, Schottky-like contributionRomero et al. (2014). In a cubic symmetry, Yb will be split into two doublets and a quartet. Assuming the quartet is at higher temperature, the temperature-dependent specific heat can be written asRomero et al. (2014):
| (1) |
in which,
| (2) |
| (3) |
Here, C2d is the Kondo resonance contribution from the lower lying two doublets. represents the half-width at half-maximum of the spectral density for each crystal field level. is the derivative of the digamma function and Cs is th Schottky expression for a three level system. represents the excited CEF energies. The second term in Eq.(1) accounts for the double counting of the Schottky contribution. equals to ignoring complications of the ground state doubletRomero et al. (2014). for the ground state doublet is introduced to account for the resonance that is displaced away from the Fermi energyRomero et al. (2014).
In Fig. 4(b), data for Yb(Fe0.372Co0.628)2Zn20 could be best fitted by the brown dashed line with parameters: = 1 K, = 10 K, = 25 K, = 0.87 K, = 4 K. The low-temperature rise is omitted in the fit and will be discussed below. Clow mainly comes from the Kondo effect for the ground state doublet and Chigh largely comes from Schottky contribution due to CEF population. Therefore, the temperature of Chigh also reflects an upper limit of the total CEF splitting.
The calculated value qualitatively agrees with experimental data. Higher calculated values around 10 K might due to an error caused by non-magnetic background subtraction as illustrated by a negative value of Cmag for 20 K. It could also due to a lack of bandwidth information for the highest lying quartet in the theoretical modelRomero et al. (2014). In general, the best fit indicates that the two CEF levels are at around 10 K and 25 K, which is similar to what had been proposed for YbCo2Zn20Takeuchi et al. (2011b); Romero et al. (2014). Thus at least to this level of Co substitution, as shown in Fig. 5 for Co-rich side of the phase diagram, the CEF splitting does not change significantly from the pure YbCo2Zn20. In addition, since the temperature of Chigh sets an upper limit of the total CEF splitting, the total CEF splitting does not change much across the whole substitution range and may have increased slightly when approaching the YbFe2Zn20 side. In contrast, the CEF effect is more apparent for YbCo2Zn20. The difference in Kondo physics between YbFe2Zn20 and YbCo2Zn20 most likely originate from the difference in density of states as well as Kondo coupling strength.
Going back to the generalized Kadowaki-Woods plot shown in Fig. 4(c), upon Co substitution up to x = 0.170, the degeneracy that is responsible for the Kondo effect is still very close to the full degeneracy: = 8. However, the temperatures at which Kondo coherence is developed have become comparable or even smaller than the estimated CEF splitting. This trend can be clearly represented by shown in Fig. 5. It may be possible that, for x = 0.170 as an example, the Kondo temperature is still at a relatively higher temperature than the CEF splitting, which quenches the local moment with a degeneracy close to 8Desgranges (2014). On the other hand, Kondo coherence, as tracked by , does not significantly affect the way magnetic entropy is removed. With an even lower Kondo energy scale, the CEF feature would have enough room to be more apparent, like in the case for x = 0.222.
Finally, as for the low-temperature rise in the specific heat of Yb(Fe0.372Co0.628)2Zn20, since there is no magnetic ordering or applied magnetic field, there should not be a nuclear Schottky anomaly due to Zeeman splitting of nuclear levels in specific heat measurement. However, the low-temperature upturn in the specific heat data observed below 100 mK could still come from a nuclear quadrupolar splitting of the 173Yb nuclear momentSteppke et al. (2010). Such quadrupole splitting for Yb in a cubic point symmetry may arise from the electric field gradient caused by chemical substitution induced distortion. Even though transition metal is not the first, nor the second nearest neighbors of Yb, as substitution increases, the distortion to the original cubic symmetry increase. This is consistent with our observation that the low-temperature rise only emerges with chemical substitution and becomes more pronounced in the middle of the doping range. An alternative scenario is that the upturn is of a Kondo origin. However, that requires a decreasing CEF split energies upon substitution and a very small first excited CEF energy which was not observed in specific heat data. Instead, the Clow feature stays unchanged for the majority of the substitution range which otherwise should also evolve and split.
We would also like to mention a similar doping series: CeNi ( = Si, Ge)Gold et al. (2012). Changing from CeNi9Ge4 to CeNi9Si4, the Kondo temperature increases from 4 K to 70 K with ground state CEF degeneracy changing from 4 for = Ge to 6 for = SiGold et al. (2012). Upon doping, the coherence temperature drops quickly from both sides. In the middle of the doping, specific heat shows continuous evolution from high , Ge side, to the low , Si side. Understanding the suppression of Kondo coherence in these two systems might offer useful insights into the formation of Kondo coherence.
V Conclusions
In conclusion, we studied the evolution of Kondo effect in Yb(Fe1-xCox)2Zn20 via resistivity and specific heat measurements. With Co substitution, the Kondo coherence temperature of YbFe2Zn20 decreases gradually with emerging features in specific heat that can be associated with CEF effect. On the YbCo2Zn20 side, the coherence temperature is also suppressed at the beginning of Fe substitution. In between, 0.4x0.9, CEF features can be observed in both resistivity and specific heat data whereas showing no clear feature of coherence down to 500 mK. However, only qualitative information can be obtained in this middle region due to a large substitution level variation. Comparing all the experimental results, the CEF splitting stays roughly unchanged across the substitution series. The ground state of the compound evolves from a = 8 coherent state for YbFe2Zn20 to a = 2 coherent state in YbCo2Zn20. More measurements are needed to reveal the mechanism behind the suppression of coherence on the YbFe2Zn20 and YbCo2Zn20 side.
Acknowledgements
We would like to thank U. (G. D. M.) Kaluarachichi, K. Cho, G. Drachuk, B. Song, Y. Furukawa, R. Flint for useful discussions, W. Straszheim for WDS analysis. This work was supported by the U.S. Department of Energy (DOE), Office of Science, Basic Energy Sciences, Materials Science and Engineering Division. The research was performed at the Ames Laboratory, which is operated for the U.S. DOE by Iowa State University under contract NO. DE-AC02-07CH11358.
References
- Nasch et al. (1997) T. Nasch, W. Jeitschko, and U. C. Rodewald, Z. Naturforsch. 52b, 1023 (1997).
- Jia et al. (2007a) S. Jia, S. L. Bud’ko, G. D. Samolyuk, and P. C. Canfield, Nature Phys. 3, 334 (2007a).
- Jia et al. (2007b) S. Jia, N. Ni, S. L. Bud’ko, and P. C. Canfield, Phys. Rev. B 76, 184410 (2007b).
- Jia et al. (2009) S. Jia, N. Ni, S. L. Bud’ko, and P. C. Canfield, Phys. Rev. B 80, 104403 (2009).
- Canfield et al. (2008) P. C. Canfield, S. Jia, E. Mun, S. L. Bud’ko, G. D. Samolyuk, and M. S. Torikachvili, Physica B Condens. Matter 403, 844 (2008).
- Torikachvili et al. (2007) M. S. Torikachvili, S. Jia, E. D. Mun, S. T. Hannahs, R. C. Black, W. K. Neils, D. Martien, S. L. Bud’ko, and P. C. Canfield, Proc. Natl. Acad. Sci. 104, 9960 (2007).
- Mun et al. (2012) E. D. Mun, S. Jia, S. L. Bud’ko, and P. C. Canfield, Phys. Rev. B 86, 115110 (2012).
- Fisk et al. (1991) Z. Fisk, P. C. Canfield, W. P. Beyermann, J. D. Thompson, M. F. Hundley, H. R. Ott, E. Felder, M. B. Maple, M. A. Lopez de la Torre, P. Visani, and C. L. Seaman, Phys. Rev. Lett. 67, 3310 (1991).
- Saiga et al. (2008) Y. Saiga, K. Matsubayashi, T. Fujiwara, M. Kosaka, S. Katano, M. Hedo, T. Matsumoto, and Y. Uwatoko, J. Phys. Soc. Jpn. 77, 053710 (2008).
- Nakanishi et al. (2010) Y. Nakanishi, T. Kamiyama, K. Ito, M. Nakamura, Y. Saiga, M. Kosaka, Y. Uwatoko, and M. Yoshizawa, J. Phys. Conf. Ser. 200, 012142 (2010).
- Kim et al. (2013) S. K. Kim, M. S. Torikachvili, S. L. Bud’ko, and P. C. Canfield, Phys. Rev. B 88, 045116 (2013).
- Matsubayashi et al. (2009) K. Matsubayashi, Y. Saiga, T. Matsumoto, and Y. Uwatoko, J. Phys. Conf. Ser. 150, 042117 (2009).
- Matsubayashi et al. (2010) K. Matsubayashi, Y. Saiga, T. Matsumoto, and Y. Uwatoko, J. Phys. Conf. Ser. 200, 012112 (2010).
- Cabrera-Baez et al. (2016) M. Cabrera-Baez, R. A. Ribeiro, and M. A. Avila, J. Phys. : Condens. Matter 28, 375601 (2016).
- Shimura et al. (2011) Y. Shimura, T. Sakakibara, S. Yoshiuchi, F. Honda, R. Settai, and Y. Ōnuki, J. Phys. Soc. Jpn. 80, 073707 (2011).
- Takeuchi et al. (2011a) T. Takeuchi, M. Ohya, S. Yoshiuchi, M. Matsushita, F. Honda, R. Settai, and Y. Ōnuki, J. Phys. Conf. Ser. 273, 012059 (2011a).
- Shimura et al. (2012) Y. Shimura, T. Sakakibara, S. Yoshiuchi, F. Honda, R. Settai, and Y. Ōnuki, J. Phys. Conf. Ser. 391, 012066 (2012).
- Honda et al. (2014) F. Honda, Y. Taga, Y. Hirose, S. Yoshiuchi, Y. Tomooka, M. Ohya, J. Sakaguchi, T. Takeuchi, R. Settai, Y. Shimura, T. Sakakibara, I. Sheikin, T. Tanaka, Y. Kubo, and Y. Ōnuki, J. Phys. Soc. Jpn. 83, 044703 (2014).
- Takeuchi et al. (2011b) T. Takeuchi, S. Yoshiuchi, M. Ohya, Y. Taga, Y. Hirose, K. Sugiyama, F. Honda, M. Hagiwara, K. Kindo, R. Settai, and Y. Ōnuki, J. Phys. Soc. Jpn. 80, 114703 (2011b).
- Romero et al. (2014) M. A. Romero, A. A. Aligia, J. G. Sereni, and G. Nieva, J. Phys. Condens. Matter 26, 025602 (2014).
- Kaneko et al. (2012) K. Kaneko, S. Yoshiuchi, T. Takeuchi, F. Honda, R. Settai, and Y. Ōnuki, J. Phys. Conf. Ser. 391, 012026 (2012).
- Ohya et al. (2010) M. Ohya, M. Matsushita, S. Yoshiuchi, T. Takeuchi, F. Honda, R. Settai, T. Tanaka, Y. Kubo, and Y. Ōnuki, J. Phys. Soc. Jpn. 79, 083601 (2010).
- Tanaka and Kubo (2010) T. Tanaka and Y. Kubo, J. Phys. Soc. Jpn. 79, 124710 (2010).
- Canfield et al. (2016) P. C. Canfield, T. Kong, U. S. Kaluarachchi, and N. H. Jo, Philos. Mag. 96, 84 (2016).
- Cornut and Coqblin (1972) B. Cornut and B. Coqblin, Phys. Rev. B 5, 4541 (1972).
- Rajan (1983) V. T. Rajan, Phys. Rev. Lett. 51, 308 (1983).
- Desgranges (2014) H.-U. Desgranges, Physica B Condens. Matter 454, 135 (2014).
- Coqblin and Schrieffer (1969) B. Coqblin and J. R. Schrieffer, Phys. Rev. 185, 847 (1969).
- Tsujii et al. (2005) N. Tsujii, H. Kontani, and K. Yoshimura, Phys. Rev. Lett. 94, 057201 (2005).
- Cox and Grewe (1988) D. L. Cox and N. Grewe, Z. Phys. B 71, 321 (1988).
- Bauer (1991) E. Bauer, Adv. Phys. 40, 417 (1991).
- Aronson et al. (1989) M. C. Aronson, J. D. Thompson, J. L. Smith, Z. Fisk, and M. W. McElfresh, Phys. Rev. Lett. 63, 2311 (1989).
- Schlottmann (1983) P. Schlottmann, Z. Phys. B 51, 223 (1983).
- Saiga et al. (2009) Y. Saiga, K. Matsubayashi, T. Fujiwara, T. Matsumoto, M. Kosaka, S. Katano, and Y. Uwatoko, J. Phys. Conf. Ser. 150, 042168 (2009).
- Martin (1982) R. M. Martin, Phys. Rev. Lett. 48, 362 (1982).
- Grewe (1984) N. Grewe, Solid State Commun. 50, 19 (1984).
- Lacroix (1986) C. Lacroix, J. Magn. Magn. Mater. 60, 145 (1986).
- Kaga et al. (1988) H. Kaga, H. Kubo, and T. Fujiwara, Phys. Rev. B 37, 341 (1988).
- Brodale et al. (1986) G. Brodale, R. Fisher, C. Lisse, N. Phillips, and A. Edelstein, J. Magn. Magn. Mater. 54, 416 (1986).
- Bredl et al. (1984) C. D. Bredl, S. Horn, F. Steglich, B. Lüthi, and R. M. Martin, Phys. Rev. Lett. 52, 1982 (1984).
- Fujita et al. (1985) T. Fujita, K. Satoh, Y. Ōnuki, and T. Komatsubara, J. Magn. Magn. Mater. 47, 66 (1985).
- Knopp et al. (1988) G. Knopp, A. Loidl, R. Caspary, U. Gottwick, C. Bredl, H. Spille, F. Steglich, and A. Murani, J. Magn. Magn. Mater. 74, 341 (1988).
- Yatskar et al. (1996) A. Yatskar, N. K. Budraa, W. P. Beyermann, P. C. Canfield, and S. L. Bud’ko, Phys. Rev. B 54, R3772 (1996).
- Schlottmann (1989) P. Schlottmann, Phys. Rep. 181, 1 (1989).
- Mun et al. (2004) E. D. Mun, B. K. Lee, Y. S. Kwon, and M. H. Jung, Phys. Rev. B 69, 085113 (2004).
- Rossel et al. (1987) C. Rossel, K. N. Yang, M. B. Maple, Z. Fisk, E. Zirngiebl, and J. D. Thompson, Phys. Rev. B 35, 1914 (1987).
- Besnus et al. (1990) M. Besnus, P. Haen, N. Hamdaoui, A. Herr, and A. Meyer, Physica B Condens. Matter 163, 571 (1990).
- Michor et al. (2003) H. Michor, S. Berger, M. El-Hagary, C. Paul, E. Bauer, G. Hilscher, P. Rogl, and G. Giester, Phys. Rev. B 67, 224428 (2003).
- Stewart (2001) G. R. Stewart, Rev. Mod. Phys. 73, 797 (2001).
- Paglione et al. (2007) J. Paglione, T. A. Sayles, P.-C. Ho, J. R. Jeffries, and M. B. Maple, Nature Phys. 3, 703 (2007).
- Adrian and Adrian (1989) G. Adrian and H. Adrian, J. Less-Common Met. 149, 313 (1989).
- Tešanović (1986) Z. Tešanović, Phys. Rev. B 34, 5212 (1986).
- Pruschke et al. (2000) T. Pruschke, R. Bulla, and M. Jarrell, Phys. Rev. B 61, 12799 (2000).
- Bhattacharjee and Coqblin (1976) A. K. Bhattacharjee and B. Coqblin, Phys. Rev. B 13, 3441 (1976).
- Nicolas-Francillon et al. (1972) M. Nicolas-Francillon, A. Percheron, J. Achard, O. Gorochov, B. Cornut, D. Jerome, and B. Coqblin, Solid State Commun. 11, 845 (1972).
- Schneider et al. (1983) H. Schneider, Z. Kletowski, F. Oster, and D. Wohlleben, Solid State Commun. 48, 1093 (1983).
- Fujii et al. (1992) H. Fujii, T. Takabatake, and Y. Andoh, J. Alloys Comp. 181, 111 (1992).
- Taufour et al. (2013) V. Taufour, H. Hodovanets, S. K. Kim, S. L. Bud’ko, and P. C. Canfield, Phys. Rev. B 88, 195114 (2013).
- Avila et al. (2004) M. A. Avila, Y. Q. Wu, C. L. Condron, S. L. Bud’ko, M. Kramer, G. J. Miller, and P. C. Canfield, Phys. Rev. B 69, 205107 (2004).
- Steppke et al. (2010) A. Steppke, M. Brando, N. Oeschler, C. Krellner, C. Geibel, and F. Steglich, Phys. Status Solidi B 247, 737 (2010).
- Gold et al. (2012) C. Gold, P. Gross, L. Peyker, G. Eickerling, G. G. Simeoni, O. Stockert, E. Kampert, F. Wolff-Fabris, H. Michor, and E.-W. Scheidt, J. Phys. Condens. Matter 24, 355601 (2012).