A Large-scale Analysis of the Marketplace Characteristics in Fiverr
Abstract
Crowdsourcing platforms have become quite popular due to the increasing demand of human computation-based tasks. Though the crowdsourcing systems are primarily demand-driven like MTurk, supply-driven marketplaces are becoming increasingly popular. Fiverr is a fast growing supply-driven marketplace where the sellers post micro-tasks (gigs) and users purchase them for prices as low as $5. In this paper, we study the Fiverr platform as a unique marketplace and characterize the sellers, buyers and the interactions among them. We find that sellers are more appeasing in their interactions and try to woo their buyers into buying their gigs. There are many small tightly-knit communities existing in the seller-seller network who support each other. We also study Fiverr as a seller-driven marketplace in terms of sales, churn rates, competitiveness among various subcategories etc. and observe that while there are certain similarities with common marketplaces there are also many differences.
1. Introduction
In recent years, there has been a huge growth in crowdsourcing platforms due to rising demands of crowdsourcing micro-tasks like doing surveys, preparing resumes and other similar tasks that require manual labor. As the popularity of these crowd-based microtasks increased, various crowdsourcing platforms emerged like the Amazon Mechanical Turk, Crowd Flower, Microworker, ShortTask etc. These platforms are primarily demand-driven. Another range of platforms drift from this demand-driven based approach to supply-driven approach where the workers try to showcase their skills and talents by offering various micro-tasks. These marketplaces are primarily used by the freelancers. Upwork, Elance, Fiverr, oDesk, Freelancer, TaskRabbit are some of the very prominent supply-driven marketplaces where the suppliers post advertisements on services like creative writing, programming, software development, graphics etc. with hourly rates or a fixed fee.
Since 2010, Fiverr has grown into one of the largest and popular online freelancing marketplace. As of June, 2016, most of the Fiverr traffic (17.9%) comes from India followed by US (17.6%) and Pakistan (12.1%)111http://www.alexa.com/siteinfo/fiverr.com. Fiverr facilitates the buying and selling of “gigs” (micro-tasks) online starting from as low as $5 per gig. The sellers in Fiverr, apart from selling, can also buy gigs from other sellers; similarly, buyers can also become sellers whenever necessary. This dual role played by the members of this community and the interaction among them has made Fiverr a unique marketplace.
2. Related works
There have been several studies on crowdsourcing based online labor marketplaces, predominantly on Amazon Mechanical Turk (AMT). Ross et al. [1] presented a user demography study on AMT. Berinsky et al. [2] described issues related to recruiting subjects on AMT platform. Paolacci et al. [3] reviewed the strengths of MT in recruiting participants. Kosinski et al. [4] measured crowd intelligence. Mason and Suri [5] performed behavioral analysis of Turkers and Suri et al. [6] studied their honesty. Halpin and Blanco [7] used machine learning to identify spammers in AMT. Allahbakhsh et al. [8] discussed quality control schemes while Heymann and Garcia-Molina [9] proposed a novel analytics tool for crowdsourcing systems. Apart from AMT, Wang et al. [10] performed analysis of the tasks on ZBJ and SDH (Chinese crowdsourcing sites) and estimated that 90% of all tasks were crowdturfing tasks.
Supply-driven marketplace: Though there have been several studies on demand-driven marketplaces, supply-driven marketplaces, which are also a growing business in crowdsourcing based marketplaces, are under-studied. [11] performed measurement studies on Fiverr focusing on the quality of the gigs. [12] analyzed abusive tasks on Freelancer. Several black-hat marketplaces like HackBB, SilkRoad, Agora, SEOClerks, MyCheapJobs, Gigbucks, Gigton, TenBux have also emerged which facilitate sale of fraudulent products and illicit goods [13, 14, 15, 16]. [16] studied crowdturfing task detection on Fiverr. [17] analyze marketplace characteristic in SEOClerks and MyCheapJobs. [18] studied the reward effect on submissions in Taskcn. Our study is different from the above in the following ways - we present a first comprehensive picture of the behavior of the buyers, the sellers and the seller-seller interactions and demonstrate how all these together impact Fiverr as a marketplace from the economic, the sociological and the strategic perspective.
3. Dataset description
We crawled Fiverr data using preferential crawlers in . The crawler ran for a period of 20 days and data for 59,786 gigs from 103 subcategories belonging to 10 categories were collected. For each gig, we collected price, reviews, seller’s response to reviews, and mutual ratings. We then separately crawled the member profile information (average response time, level of seller, user locations and conversant languages etc.). Next we removed the gigs which have incomplete information for some fields. Consequently, we were left with 41,473 gigs which we use for our study. The dataset contains 21,767 unique sellers and 5,31,841 unique buyers. The total reviews reached a count of 34,43,381 and are used as proxies for business transaction between the reviewer (also buyer) and the gig owner. The prices of the gigs range from $5 to $995 indicating the diversity in the service quality offered.
Gigs, Sellers and Buyers: Gigs are services provided by sellers in Fiverr and are grouped into categories and further subcategories.
The Graphics Design category has the highest number of sellers with 32% of the total share. ‘Level of seller’ is assigned by the website to sellers based on the total time spent, the volume of sales, the ratings, the cancellation rates and the order count thresholds amongst many other things. The categories here are new, level 1, level 2 and top rated.
| Category Groups | # sellers | # buyers | # gigs | Avg. Price | Avg. Sale | Avg. Revenue |
|---|---|---|---|---|---|---|
| Group 1 | 16962 | 596081 | 20501 | $31.02 | 93.06 | $1128.81 |
| Group 2 | 1619 | 67044 | 2304 | $8.54 | 471.45 | $3662.11 |
| Group 3 | 5744 | 87159 | 7394 | $6.65 | 28.16 | $218.61 |
| Group 4 | 5012 | 96491 | 6443 | $5.04 | 35.70 | $184.80 |
| Group 5 | 3339 | 46670 | 5183 | $5 | 24.41 | $122.46 |
| Total | 21767 | 531841 | 41573 | $8.69 | 78.22 | $757.17 |
Categories and product differentiation: We organize all the categories in Fiverr into 5 broad groups – Graphics & Design, Digital Marketing, Writing & Translation; Video & Animation, Music & Audio; Programming & Tech; Advertising , Business; Lifestyle, Gifts, Fun & Bizarre – and analyze them separately to find which among them are more popular in terms of the number of gigs, high supply and demand. We also calculate average gig price in each category, average sales of the gigs and revenue generated by the gigs (see Table 1). We find that the average price is maximum for the creative categories i.e., group 1 ($31.02) whereas the average price in the lifestyle related category (group 5) is just $5. The average sales per gig varies from 471.45 (Audio and Video category) to 24.41 (group 5). We also observe that many categories have significant sales in terms of total sales but show mediocrity in terms of average sales per gig. Therefore, the product differentiation is quite apparent in this marketplace.
4. Fiverr under the economic lens
From the economic viewpoint, we analyze behavior of various marketplace entities like buyers, sellers and the review patterns.
4.1 Behavior of sellers
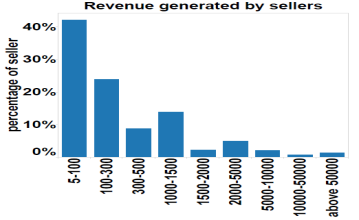
We find that more than 40% sellers have only earned $5-$100 over the last nine months whereas the proportion of sellers with revenue is only about 0.4% (see fig 1). Fiverr provides a lot of information about sellers and gigs e.g., average response time, orders in queue, number of reviews, number of positive reviews, average response time of the seller and many recently added new features like - a rating based on the service as described on a scale of 0–5, a rating based on the recommendation of the gig by a user. We investigate several of these features in order to unfold the behavior of the sellers.
Based on different attributes, Fiverr classifies the sellers into three levels - level 1, level 2 and top rated. There are many sellers who have not yet met the criterion to be in any of these levels and are called new sellers by Fiverr. We observe that about 22.56% of the whole seller community are in level 1, more than 62.89% are level 2 sellers whereas only 4.8% are top rated sellers and the rest of them are new. Table 2 shows how sales and revenue varies for the different levels of sellers. Apart from the fact that the top rated sellers are selling more number of products, it is also quite clear that they charge more for their product than others. A top rated seller charges $9.56 on average, where a level 2 seller charges $8.96. This premium charging shows their bargaining power over others.
| Level | Avg. Sale | Avg. Revenue | Avg. Gigs |
| Level 1 | 12.94 | $112.66 | 1.46 |
| Level 2 | 158.22 | $1417.15 | 2.22 |
| Top rated | 2344.24 | $22,413.26 | 4.04 |
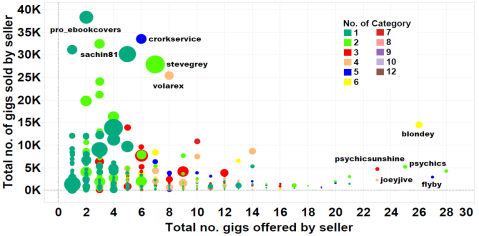
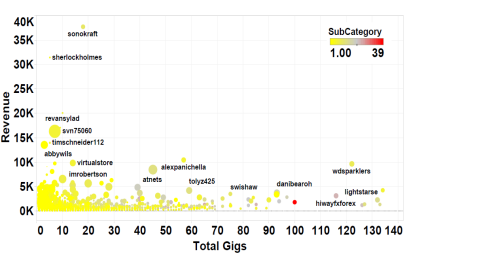
Sales and top sellers First we observe the performance of sellers based on the revenue earned in the last nine months. The revenue generated by the seller varies from $555,715 to only $5. If we consider the number of unit sales without considering the price, then it can be as high as 38,302 to as low as 1. From the fig 2, we can clearly observe that most of the top sellers prefer selling a small number of gigs in few subcategories rather than providing diverse type of gigs. Hence, they are mostly proficient in certain type of services which indicates a good level of professionalism in a service driven marketplace.
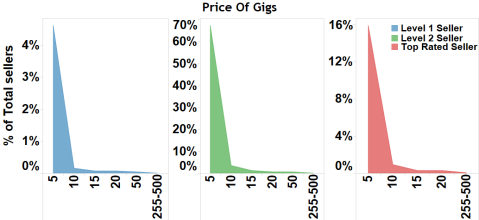
Pricing of gigs In Fiverr, 87.73% of the gigs are priced at $5. 0.02% of the gigs are highly priced and more than $500. From the dataset, we observe that most of the highly priced gigs are from the subcategories Buy Photos Online Photoshop, Banner Ads and Content Marketing. Figure 3 shows how different levels of sellers price their gigs. The underlying distribution within each seller level appears to be the same with the only difference being the percentage of total sellers in level 2 is much high compared to other levels.
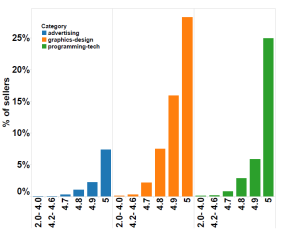
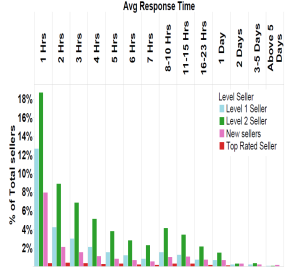
Buyer ratings and seller response times Buyers provide ratings to the sellers for each purchase on a scale of 0-5. Hence, average rating for each seller can be a parameter for judging his/her performance. After analyzing the data, we believe that the rating system is not very discriminatory for Fiverr. More than 60% of the sellers have an average rating of 5 and more than 96% have more than 4.7. This distribution is also valid category wise (see fig 4). In fig 4, we show the distribution of average response time of sellers. The graph shows power-law behavior. More than 95% of the sellers usually respond within a day and of them respond within an hour.
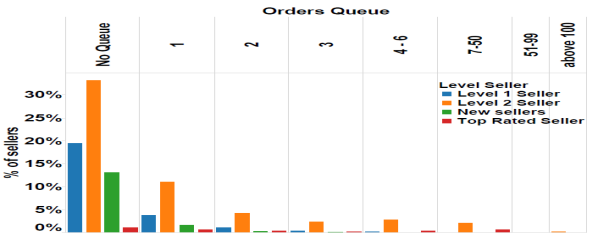
Order queue Another new feature that Fiverr has recently added is the order queue count which tells us how many incomplete orders are present for a particular seller for a given gig. Low value of order queue count can be either because of less popularity or excellent customer handling. Similarly, high value of order queue count can indicate less proficiency in customer handling or large number of orders inflow. In fig 6, we show the distribution of no. of orders in queue for each level of sellers. Most of the level 2 sellers are very prompt, however, a non-negligible percentage of them also delay their services.
Gain of new customers The customer base of sellers keeps changing over time and the inflow of new customers can be taken as a proxy for growing popularity and hence an indicator of good services. We propose a metric to measure this inflow. For a particular seller, we define
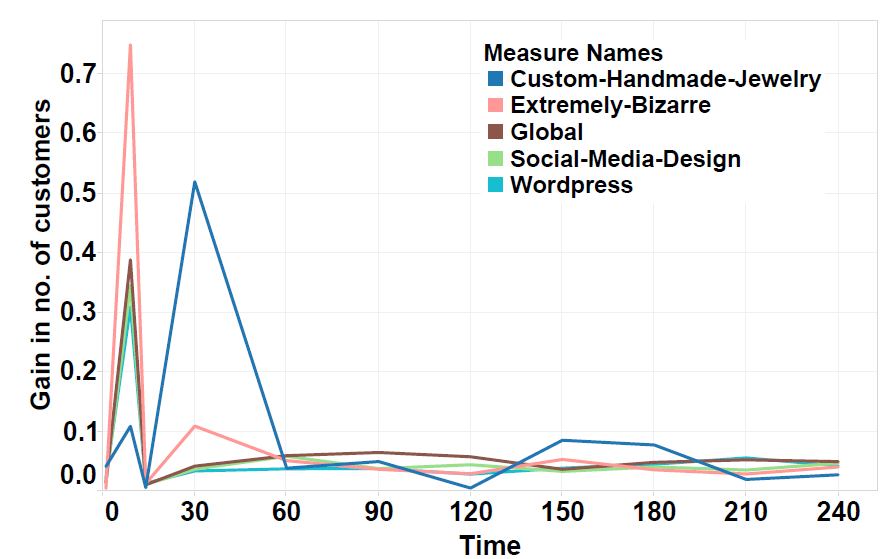
where, is the set of all customers of the seller at time and is the set complement of the set . represents the set of customers one day before the day. Fig 6 shows the average gain of top sellers of five subcategories. We observe that average gain decreases over time. Globally, the percentage gain of customers for top sellers is around 40% and is greater than the preceding time intervals for one month. Some subcategories show different trends. For example - in Custom Handmade Jewelry the largest gain (%) of customers took place during the first week of May 2016. Similarly, around the middle of May, 2016 the subcategory Extremely Bizarre showed the maximum gain of new customers which is around 75% (fig 6).
4.2 Behavior of buyers
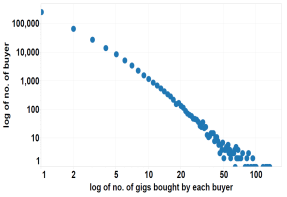
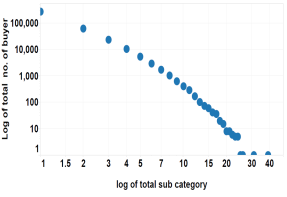
Buyers are the driving force of any marketplace. In our dataset, we have a total of 5,31,841 buyers. Nevertheless, if we only want to observe the profitable or returning customers, then the number would be much less than this. of the buyers are one-time (only one purchase across all gigs) buyers. Only 18% of the buyers have purchased more than 5 times in last nine months, with the maximum being 2939. Fig 7 shows the distribution of number of purchases of gigs indicating a power-law behavior. In fig 7, we present the distribution of purchases from different subcategories. 68.62% of the buyers buy from one subcategory and only nine buyers have bought from more than 30 subcategories.
Purchase and top buyers
As we have seen that most of the buyers are just one time buyers, we consider only the top buyers in our studies, whose total purchases are more than 200.
In fig 8 we show that the amount of purchases is not always directly proportionate to the volume of purchases. Moreover, most of the top buyers prefer to buy small number of gigs from a few subcategories, rather than buying different types of products across different subcategories. This also shows that these buyers are not just stray visitors to the website; instead they repeatedly buy the same products over time. Hence, it is legitimate to assume that loyal customers (although less in number) do exist in supply-driven marketplaces like Fiverr.
Returning time of buyers
As we have seen the existence of loyal and repeated buyers in Fiverr, the next question that arises is - how often does a returning customer buy a particular gig? To measure this, we define a statistic for each of the repeated buyers for each of the gigs they are buying.
=
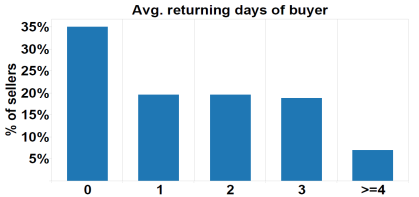
where, is the time periods of purchase of a particular gig. In other words, this statistic measures the average day difference between any two consecutive purchases for each of the repeated buyers. In fig 9 we show the distribution of the returning time of the top buyers in Fiverr. It clearly shows the peak at time zero and almost uniform frequencies up to 3rd day followed by a decrease. We can therefore infer that most of the frequent buyers usually return within a day, which is another unlikely event for other e-commerce and product driven marketplaces. This observation can greatly help the sellers to incentivise returning customers. This also shows the extent of heavy usage of services by the frequent customers which is overall an encouraging sign for Fiverr.
4.3 Review characteristics
Reviews have increasingly become one of the guiding foundations for buyers in online marketplaces. A good review system allows for a discriminative analysis among the different choices and helps the consumer determine the usefulness and ingenuity of the product under question in the different stages of the purchase decision making process. Fiverr’s review system, though probably intended to be means for insights into gig’s performance, does seem to be quite different from the usual e-commerce platforms. The buyer and the seller can engage in a mutual review exchange and rate each other based on their interaction. Initial analysis shows that the linguistic structure has evolved along a very constrained framework which involves a high degree of mutual appreciation, well-wishing and goodwill exchange. We perform general analysis of gig reviews and try to look at the commenting behavior of the users across all the gigs. Though we consider comments on a gig as a proxy for purchase, we study the repetitiveness of comments in Fiverr. The normalized figures for 5,31,841 users show us that of the users comment only once. This is followed by 18% of the users placing the same comment twice. of the users have commented the same thing thrice. This distribution follows a power-law behavior (see fig 10).
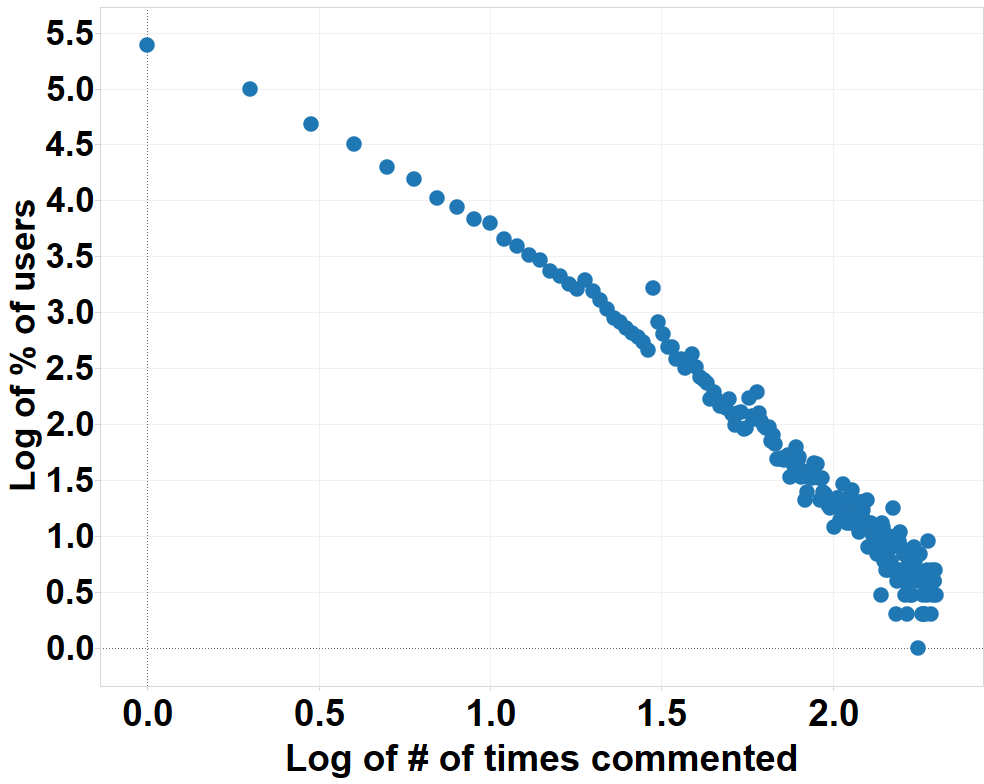
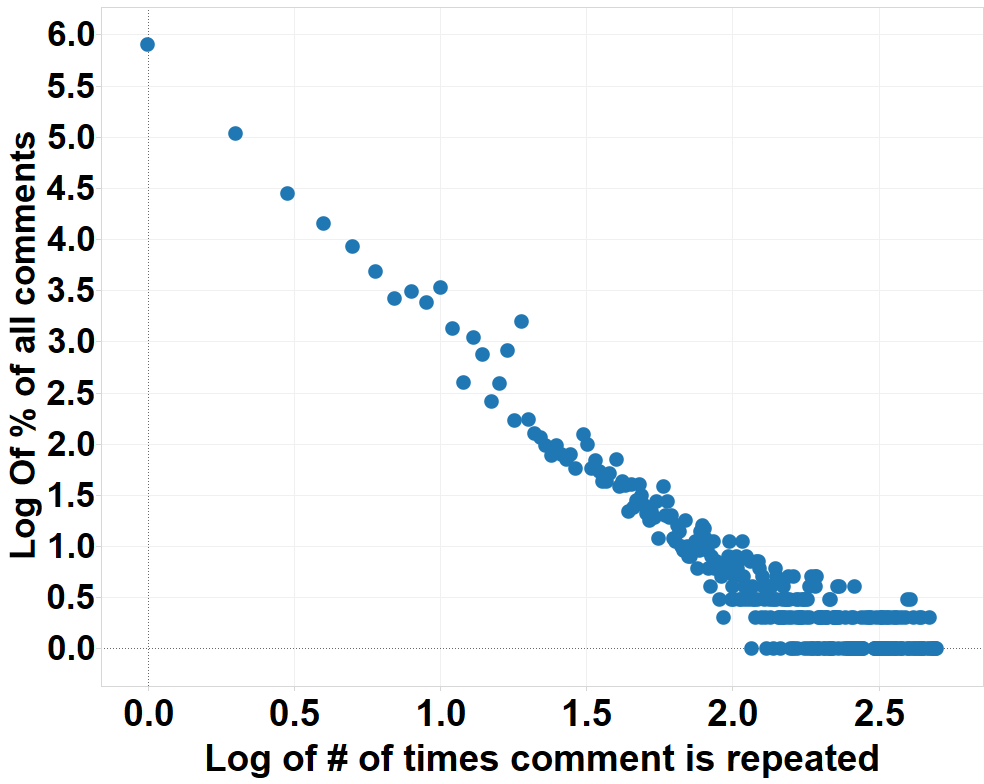
We also observe how comments are being repeated across all the gigs. Figure 10 shows the distribution of the comment repetitions which shows a power-law curve with heavy tail. 80% of the comments are non-repetitive, 10.98% have occurred twice. Notably, the single comment “Outstanding Experience!” has appeared 51,451 times across all comments. Close variations of this comment are also observed frequently. This is followed by 12,406 repetitions of the comment “thanks”.
Sentiment analysis: We perform sentiment analysis of the reviews using the standard sentiment dictionary [19]. Most of the reviews have positive and encouraging constructs. This can be attributed to the structure which has developed over time and is peculiar to Fiverr. “Outstanding experience”, “Thanks” and “Great to work with” are some of the most common phrases encountered and this is reflected in the skewed sentiment scores. However, a difference in the polarity distribution can be observed across categories with different inherent characteristics. The difference is more pronounced across different price ranges.
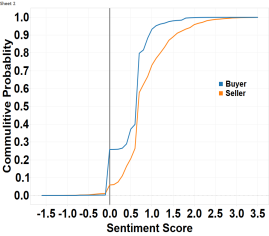
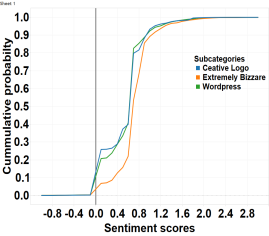
Sellers are found to be more positive in their responses to the comments by the buyers. A cumulative plot of Creative Logo Design subcategory demonstrates this fact (see fig 11). Comparisons across different subcategories (see fig 11) also gives very convincing insights. For trivial services like the ones contained in Extremely Bizarre, the reviews have higher proportion of positive sentiments than more serious services like the ones in Wordpress and Creative Logo Design.
Comparison with Amazon’s reviews: Since reviewing patterns are a key representative of any marketplace, we use these to differentiate a supply-driven and a demand-driven marketplaces. We collected Amazon’s review data for the Electronics category and randomly sampled the reviews. These are in high contrast to that of Fiverr. The sentiment distribution is more inclusive of negative polarities and the linguistic structure looks more realistic upon primary inspection. Comparison of top 10 most frequent words (see table 3) in reviews of Amazon Electronics products and Fiverr’s most sold Creative Logo Design shows that Amazon’s products get feedback related to product specifics with some words expressing gratefulness while Fiverr is dominated by mostly emotional responses. The average number of characters per review for Amazon is around 381, while for Fiverr, it is merely around 61. This can be attributed to the elaborate and explanatory nature of the former and a generic congratulatory nature of the later.
| Marketplace | Top 10 words |
| Amazon | case phone one great works like just well good use |
| Fiverr | experience great work outstanding thanks logo job |
| will good excellent |
5. Sociological/network perspective of Fiverr
We create two types of seller-seller networks (Tier-I and Tier-II) and study the interesting properties of these networks.
5.1 Tier-I seller-seller network
We create a Tier-I seller-seller network as follows. The set of nodes are the set of sellers in Fiverr and if a seller buys times from other seller , then we add a directed edge from to in with weight (proportional to no. of purchases)
=
Graph density: The network formed using the above method has 49.13% of the full sellers community but with a graph density of only 0.001. This low number indicates that, although a number of sellers together form the network, they are loosely connected to each other. Thus they usually have a very small set of sellers in their neighborhood from whom they make a purchase.
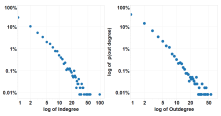
Degree distribution and power law properties: It is a known fact that degree distribution in most of the real world networks follows a power law with the exponent lying between 2 and 3. The Fiverr seller-seller network also exhibits the same characteristics with value of 2.27 for in-degree and 2.41 for out-degree (see fig 12). We further observe that percentage of nodes with zero in-degree is 43.53% whereas percentage of nodes with zero out-degree is 29.45%. This shows that the number of sellers who are only buying from other sellers is much higher compared to those who are only selling.
Transitivity: Transitivity, also referred to as the clustering coefficient, is the measure of how well the neighbors of a node are connected among themselves. This also indicates the existence of cliques or dense modules within a network. The Tier-I seller-seller network of Fiverr has very low clustering coefficient of 0.037 (the direction of the edges are ignored in this computation). The low clustering coefficient shows that there is no tightly connected module existing between the sellers in the Fiverr market which is in contrast to the general market where it is usually known to exist.
Connected components and communities: The network consists of 526 weakly connected components and 11,077 strongly connected components. The number of strongly connected components is almost same as the number of nodes which show low reciprocity in the network. By reciprocity of a network , we understand the proportion of occurrences where both and belongs to the edge set . Using Louvain algorithm [20], we determine the community structure of this network. 625 communities are discovered with an overall high modularity value of 0.941. Therefore, the network shows many small communities and the communities themselves are tightly-knit.
Geography of sellers: We collected the geographical location based data of the sellers associated with the Tier-I seller-seller network. We find that 31.57% of the whole community belongs to United States, followed by Pakistan (9.27%) and India (7.73%). Moreover, the order remains same for individual sellers and buyers in the community, where United States is leading followed by India and Pakistan. We also observe that in 26.15% of the cases both the buyer and the seller belong to the same country.
Characterizing the Tier-I seller-seller network: We observe that in 15.53% cases a seller buys from another seller who sells gigs in the same category itself. Now, if a buyer, who himself sells gigs in the same subcategory buys something similar to his product, then the explanations behind this could be either promoting the other sellers’ business or an anomalous behavior. There can be several other reasons like - supporting someone’s business, who is personally very close, or, buying similar product from some expert and again selling to someone else at a higher price. In 36.84% of the cases, we find that buyer’s total sales is more than the seller. In 7.81% cases they offer gigs in the same category. These cases may be those where a high income seller supports other less popular sellers by promoting them or, by just providing good reviews for their gigs. If we consider the level wise distribution, then higher level sellers buy gigs from lower level sellers in 24.25% cases, whereas, lower level sellers buy gigs from higher level sellers in 15.09% cases. The remaining 60.66% cases are purchases within the same level.
5.1.1. Reciprocity and revenue difference between buyer and seller
Here, we test the hypothesis whether the average revenue difference between a seller and a buyer in a community decreases as the reciprocity increases. We calculate reciprocity for each of the communities of the network and then calculate the average difference of revenue for each of the communities. So, if a community of the network contains with being the seller and being the buyer, we define average revenue difference of as
=
Our test cases then are -
: Avg. difference of revenue in a community decreases as reciprocity increases.
: Avg. difference of revenue does not decrease with increasing reciprocity.
We apply linear regression to check the dependence between these two factors. The correlation between the two factors comes out to be with the -value of . Hence, with confidence we can reject our alternative hypothesis (i.e., ).
Hence, our study shows that if reciprocity increases i.e., if more people indulge into a two way traffic, then the average revenue difference decreases i.e., their sales values become almost identical. This means that when two sellers in the market almost perform similarly, they tend to support each other. This type of mutual uplifting can promote both their businesses.
5.1.2. Effect of location on the volume of sales
Intuitively one would expect that in a global marketplace, if two people belong to same geographical location, then their interaction would be much higher on average than with other people from different locations. To check this hypothesis for Fiverr, we calculate the average volume of sales happening in a particular community and check its dependence on the average geographical location similarity. For each community in the network, we define average location similarity as
=
where, if both seller and buyer (both of them are from ) belong to the same geographical location and 0 otherwise. The correlation coefficient between average volume of sales and comes out to be with a -value of . Therefore, with a confidence of we can conclude that there is a positive correlation between our derived location similarity metric and average volume of sales. Thus, it is fair to assume that our claim, that users from the same location intend to purchase from one another and their volume of interaction is high, is reasonable.
5.1.3. Effect of similar gigs on reciprocity
Next, we calculate the average similarity between the gig names of the corresponding gigs provided by the seller and the buyer. Following this, we calculate the average gig similarity in a community. We apply linear regression to check the relationship between average gig similarity and reciprocity. Our results seems to strongly favor our claim since, as the average similarity between gigs increases, so is the propensity to reciprocate. The regression coefficient is with a -value of . Thus, if two sellers sell similar type of gigs then they are more inclined to buy from each other. This type of phenomenon is very rare in common marketplaces. If a buyer sells some product, then it is very unlikely that she will buy the same product from a different seller. It is even more unlikely that the second seller will again buy back some similar product from the first one.
5.1.4. Relationship between seller level and reciprocity
We observe that in cases, seller-seller interactions happen between same level sellers. Therefore, the next question that arises is - if two same level seller interact, what is the probability that they reciprocate?
To answer this, we calculate average seller similarity between people in each of the communities. For each community we define avg. seller level similarity as
=
where, if and belong to same level (level 1 or, level 2 or, top rated) and 0 otherwise. After applying statistical test of significance, we find that the correlation coefficient to be with a -value of . This result clearly shows that the reciprocity of a community increases with the average level similarity i.e., two people from same level have high propensity to reciprocate to each other.
5.2 Tier-II seller-seller network
We form another network on the basis of number of buyers common between two sellers and denote this network as Tier-II network. We take the top sellers and draw an edge between a pair of sellers if they share any common buyer. We define the weight of the edge as -
with being the set of buyers of the seller . Analyzing this network gives us insight about loyalty of buyers. For the subcategory Creative Logo Design, the average degree of the 282 nodes in the network comes out to be 110.28 with only one strongly connected component. This is indicative of divided loyalty or no loyalty of buyers in Fiverr market. Moreover, the network follows small world properties with a diameter of 3. We also find that the network is highly connected with an average clustering coefficient of 0.34. These results also indicate the fact that Fiverr is a marketplace where the competition is less monopolistic, i.e., most of the sellers sell similar types of gigs in order to gain revenue and customers do not discriminate well among these gigs.
6. Fiverr under strategy lens
In this section, we evaluate Fiverr as a marketplace from strategy perspective focusing on the inter-entity dependence. For this study, we only choose those sellers whose sales are more than 500 per gig ( of the whole seller community).
Dependence between no. of gigs sold and revenue
Intuitively, a seller selling more gigs seems more likely to generate more revenue. We perform statistical test of significance on data of top sellers. We apply linear regression with number of gigs as the independent variable and obtain a regression coefficient of with a -value of . This shows that the relationship between the two is weak for Fiverr.
Customer churn rate and sales
We define customer churn rate for a seller for a particular gig as
=
Here, is the set of the customers of the seller at time period and is total number of time periods the gig has been selling for in the last nine months.
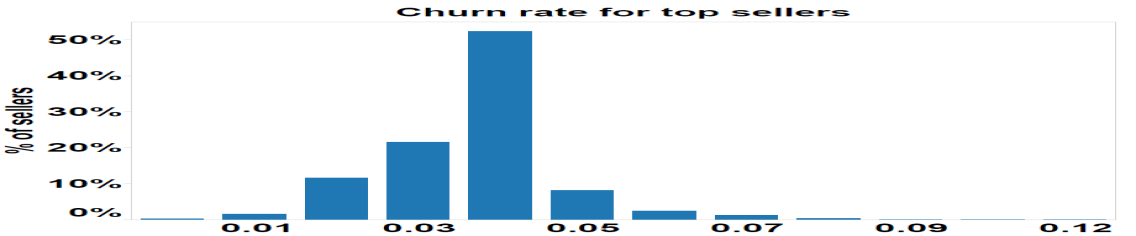
We calculate the average churn rate for all gigs offered by a seller (fig 14).
We believe that the lesser the customer churn rate, the better the customer handling and ability to satisfy a customer, and more the sales. This is of course not true for products with long life-cycles. For example, a customer who bought a mobile phone from a seller in Amazon is less likely to return for another phone purchase. In low value service driven marketplaces, customers returning can be a very frequent phenomenon. We studied the relationship between churning rate and total sales of Fiverr.
Churn rate is somewhat affecting the total sales, and the two are positively related (correlation coefficient of 0.12). One reason could be that most of the customers of Fiverr are just one time buyers. Average churn rate is higher for many of the sellers.
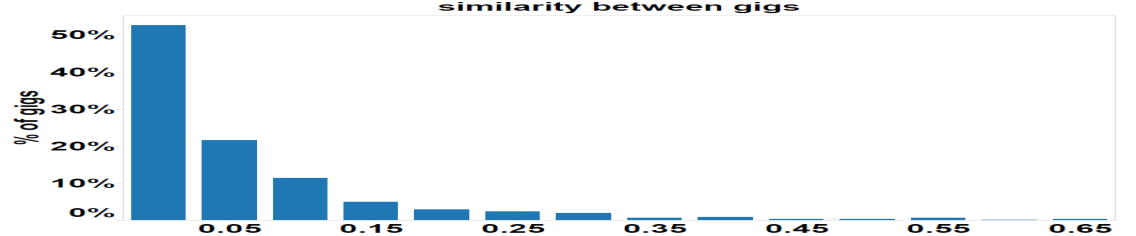
Dependence between similar gigs and sales
We observe that many top sellers sell more than one gig and in many cases they provide their services in the same subcategory. So, the next question that arises is - how similar are their gigs or do they provide different type of services? We create tf-idf matrices for 1-gram, 2-gram and 3-gram similarity of the gig names of the gigs the seller offers. As most of the gigs start with the phrase “I will do” or “I will make”, we remove these phrases and other stop words from the gig names. After that, we take the average of the three tf-idf matrices to get one matrix . Standardized rows of gives us the average similarity between one gig and other gigs. Hence, average of all the off diagonal elements of the matrix gives the average gig similarity of the particular seller. We then study the distribution of the similarity value (fig 14) and check the significance of similarity value over number of sales made by a seller. The result we obtain from the statistical test of significance is a coefficient of with a low -value of . This results clearly show that the similarity value is negatively related to total sales i.e., lower the similarity value, higher are the sales. The more diverse type of products a seller sells, the more sales he/she can make.
Similarity with other gigs and sales
In the previous subsection, we define the similarity between gigs of each seller. Here we define a similar concept, between a gig and other gigs. Therefore, we focus on the average similarity between a single gig with other gigs in the same category offered by other sellers. In a competitive market, we usually believe that the products which are somewhat different from the other products stand out and make good sales. For example, most of the niche products like Apple iPhones or automobile companies like BMW provide a unique experience to their customers which creates a strong brand awareness among the customers. In case of Fiverr, we wish to examine whether a unique gig that has very low similarity with other products in the category is having more sales, or the other way round. The correlation coefficient between average similarity with other gigs and sales is with a very low -value of . Very low -statistics and a positive correlation clearly shows that there is a significant dependence between these two. Moreover, in Fiverr, higher similarity with others means more prospects of being successful. This tells us that most of the products offered in Fiverr are homogeneous in nature and the number of alternative products is also very high.222https://en.wikipedia.org/wiki/Perfect_competition
Assessing competition in subcategories
We define a similar concept of similarity between all gigs in each of the subcategories. If the average inter-gig similarity is high for a particular subcategory, that means most of the sellers tend to sell similar types of gigs in that category. This indicates that the prospect of being successful in that category is high, if one seller goes with the trend. This implies that very high competition exists in that subcategory. We observe whether this measure of competition affects the sales of a category. The topmost competitive subcategory came out to be Video Post Production Editing with average sales per gig of 1,141. We standardize the total number of sales by the number of gigs in that subcategory to get the average sales per gig in that subcategory. After applying linear regression analysis on the two standardized variables, average sales per gig and average similarity between gigs, we get a high correlation coefficient of with a very low -value of . This result clearly shows that as the competition or the similarity between gigs in a subcategory increases, the average sales also increases. This type of phenomenon is very common in an ideal scenario of perfectly competitive market. Also, large number of buyers and sellers, accurate and necessary information about all the products, very flexible and barrier free market structure has made Fiverr a very good example of perfectly competitive marketplace. The average gig price which is very close to the actual market price of $5 shows that every entity is a “price taker” in the market.
Evaluation of growth prospective of seller in market
Evaluation of performance of sellers is vital for any crowdsourcing platform. We use the classical method of Boston Matrix (BCG matrix333https://en.wikipedia.org/wiki/Growth-share_matrix) to evaluate the performance of the different top 2.5% sellers. The BCG matrix allows organizations to identify product positioning in the market and thus they could allocate resources accordingly. We also use the same concepts in order to classify the sellers in the similar lines. The different groups in BCG matrix are
1. Stars : The best performing products or, sellers which generate most of the revenue and have positive growth rate and use most of the resources of the organization.
2. Question Mark : The products or, sellers having very high growth prospective but currently low market share. They are the potential stars.
3. Cash Cow : The market leaders with low growth rate. People invest in them to maintain their status in market.
4. Dogs : The products or, sellers with low market share as well as low growth prospects.
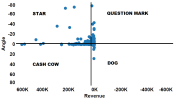
Based on the matrix (fig 15) we also divide top sellers in four groups - Stars, Cash cows, Question marks and Dogs based on their market share (i.e., proportion of revenue generated) and their growth rate measured as the slope of gain of revenue in consecutive months. Therefore, if a seller had revenue respectively in the time period , then the growth of revenue for the time period would be . We normalized the growth by the number of days and applied linear regression to get the slope of change of revenue growth. We then use the regression coefficient as the growth rate for each of the sellers. More negative the slope is, more is the growth rate of the seller.
| Quadrant of BCG matrix | percentage of top sellers |
| Stars | 4.3% |
| Cash cow | 16.85% |
| Question Mark | 10.11% |
| Dogs | 68.74% |
The below table shows that there is very low percentage (4.3%) of stars which is a common observation in any market place. Moreover, we see that the top performers in the Stars have very high growth rate (slope is close to ). Similarly, 16.85% of the sellers have a growth rate close to zero but with high revenue. We further observe that 37.9% of these people are from top rated level. We believe that these sellers may have reached their saturation point and possibly will be taken over by level 2 in the next few months. Similarly, among the Questions Marks 61.5% are level 2 sellers who have a very high growth prospect with relatively low revenue in the current period. Providing proper incentive to these sellers can help them in becoming stars. Thus, Boston matrix provides the insights about incentivizing the right set of sellers in order to boost their businesses.
7. Discussions and conclusions
In this paper, we study the characteristic properties of Fiverr marketplace from various points of view - economic, sociological and strategy and make the following key observations.
The Fiverr marketplace is a unique in that the buyers who purchase gigs from sellers can convert themselves to sellers at any point in time. Most sellers are proficient in certain type of services which indicates a good level of professionalism in the marketplace. Hence most of the top sellers prefer selling small number of gigs in a few subcategories rather than offering diverse category of gigs. From the viewpoint of the average gain of top sellers, the trends decrease over time. Globally, the percentage gain of customers for top sellers is around 40%. However, some subcategories also show different trends. The gains sometimes reach as high as 75%. The Fiverr marketplace is dominated by one-time buyers which consists of 45% of the total buyers. An interesting and unique characteristic in a supply-driven marketplace is the existence of loyal customers. It is observed that many buyers buy the same product repeatedly from a few categories. This also results in the amount of purchases not always being directly proportionate to the volume of purchases. We observe that sellers are more appeasing in their interactions and try to woo their buyers into buying their gigs. Serious categories have comparatively more reviews with near zero and negative polarities as compared to the trivial categories.
On analyzing the Tier-I seller-seller interaction network, we observe that there are many small tightly-knit seller communities existing in the network; however the overall network structure indicate loose connectivity with density of 0.001 among 49.13% sellers. The very low clustering coefficient in the network shows that there are very few or no transitive links in the network which is quite uncommon for general markets. There is also low reciprocity in the network.
We also observe that some sellers buy from other sellers within the same subcategory. The possible reasons for this behavior include promoting which is supplemented by the buyer having more sales than the seller and providing positive reviews to the seller. Most of the top sellers prefer to offer multiple gigs but in the same subcategory. An analysis of the gigs of the top sellers indicates that the more diverse type of products a seller sells, the more sales he/she can make. In terms of gig similarity on Fiverr, higher similarity with others means more prospects of being successful. This tells us that the products offered in Fiverr are homogeneous in nature and the number of alternative products is also very high. Similarly, as the competition or the similarity between gigs in a subcategory increases, the average sales also increases. This type of phenomenon is very common in an ideal scenario of perfectly competitive market. Boston Matrix analysis shows that top performers in the ‘Stars’ group have very high growth. At the same time, about of all the sellers have almost no growth but high revenue. Similarly, most of the sellers in the ‘question mark’ bracket can potentially become stars if provided with the right incentives.
8. References
- [1] J. Ross, L. Irani, M. Silberman, A. Zaldivar, and B. Tomlinson, “Who are the crowdworkers?: shifting demographics in mechanical turk,” in CHI’10 extended abstracts on Human factors in computing systems, pp. 2863–2872, 2010.
- [2] A. J. Berinsky, G. A. Huber, and G. S. Lenz, “Evaluating online labor markets for experimental research: Amazon. com’s mechanical turk,” Political Analysis, vol. 20, no. 3, pp. 351–368, 2012.
- [3] G. Paolacci, J. Chandler, and P. G. Ipeirotis, “Running experiments on amazon mechanical turk,” Judgment and Decision making, vol. 5, no. 5, pp. 411–419, 2010.
- [4] M. Kosinski, Y. Bachrach, G. Kasneci, J. Van-Gael, and T. Graepel, “Crowd iq: Measuring the intelligence of crowdsourcing platforms,” in Proc. of WebSci ’12, pp. 151–160, 2012.
- [5] W. Mason and S. Suri, “Conducting behavioral research on amazon’s mechanical turk,” Behavior research methods, vol. 44, no. 1, pp. 1–23, 2012.
- [6] S. Suri, D. G. Goldstein, and W. A. Mason, “Honesty in an online labor market.,” Human Computation, vol. 11, p. 11, 2011.
- [7] H. Halpin and R. Blanco, “Machine-learning for spammer detection in crowd-sourcing,” in Workshop on Human Computation at AAAI, pp. 85–86, 2012.
- [8] M. Allahbakhsh, B. Benatallah, A. Ignjatovic, H. R. Motahari-Nezhad, E. Bertino, and S. Dustdar, “Quality control in crowdsourcing systems: Issues and directions,” IEEE Internet Computing, no. 2, pp. 76–81, 2013.
- [9] P. Heymann and H. Garcia-Molina, “Turkalytics: analytics for human computation,” in Proc. of WWW ’11, pp. 477–486, ACM, 2011.
- [10] G. Wang, C. Wilson, X. Zhao, Y. Zhu, M. Mohanlal, H. Zheng, and B. Y. Zhao, “Serf and turf: crowdturfing for fun and profit,” in Proc. of WWW ’12, pp. 679–688, 2012.
- [11] H. Ge, J. Caverlee, and K. Lee, “Crowds, gigs, and super sellers: A measurement study of a supply-driven crowdsourcing marketplace,” in ICWSM, 2015.
- [12] M. Motoyama, D. McCoy, K. Levchenko, S. Savage, and G. M. Voelker, “Dirty jobs: The role of freelance labor in web service abuse,” in USENIX Security, 2011.
- [13] N. Christin, “Traveling the silk road: A measurement analysis of a large anonymous online marketplace,” in Proc. of WWW ’13, pp. 213–224, 2013.
- [14] E. De Cristofaro, A. Friedman, G. Jourjon, M. A. Kaafar, and M. Z. Shafiq, “Paying for likes?: Understanding facebook like fraud using honeypots,” in Proc. of IMC, pp. 129–136, 2014.
- [15] G. Wang, C. Wilson, X. Zhao, Y. Zhu, M. Mohanlal, H. Zheng, and B. Y. Zhao, “Serf and turf: crowdturfing for fun and profit,” in Proc. of WWW, pp. 679–688, ACM, 2012.
- [16] K. Lee, S. Webb, and H. Ge, “The dark side of micro-task marketplaces: Characterizing fiverr and automatically detecting crowdturfing,” in ICWSM, 2014.
- [17] S. Farooqi, M. Ikram, G. Irfan, E. De Cristofaro, A. Friedman, G. Jourjon, M. A. Kaafar, M. Z. Shafiq, and F. Zaffar, “Characterizing seller-driven black-hat marketplaces,” arXiv preprint arXiv:1505.01637, 2015.
- [18] T. X. Liu, J. Yang, L. A. Adamic, and Y. Chen, “Crowdsourcing with all-pay auctions: a field experiment on taskcn,” Management Science, vol. 60, no. 8, pp. 2020–2037, 2014.
- [19] B. Liu, “Sentiment analysis and opinion mining,” Synthesis lectures on human language technologies, vol. 5, no. 1, pp. 1–167, 2012.
- [20] V. D. Blondel, J.-L. Guillaume, R. Lambiotte, and E. Lefebvre, “Fast unfolding of communities in large networks,” Journal of statistical mechanics: theory and experiment, vol. 2008, no. 10, p. P10008, 2008.