Comparing the influence of distinct kinds of temporal disorder in a low dimensional absorbing transition model
Abstract
Recently one has stated that temporal disorder constitutes
a relevant perturbation in absorbing phase transitions for all dimensions.
However, its effect for systems other than the standard contact process
(CP), its competition with other ingredients (e.g. particle diffusion)
and other kinds of disorder (besides the standard types) are unknown.
In order to shed some light in the above mentioned points,
we investigate a variant of the usual CP, namely triplet annihilation
model (TAM), in which the competition between
triplet annihilation and single particle diffusion leads to an unusual phase diagram behavior,
with reentrant shape and endless activity for sufficient large diffusion
rates. Two kinds of time-dependent disorder have been considered.
In the former, it is introduced in the creation-annihilation parameters (as commonly
considered in recent studies), whereas in the latter the diffusion rate
(so far unexplored) is allowed to be time dependent.
In all cases, the disorder follows an uniform distribution
with fixed mean and width . Two values of have been considered,
in order to exemplify the regime of “weaker” and “stronger” temporal
disorder strengths. Our results show that in the former approach, the disorder suppresses the reentrant
phase diagram with a critical behavior deviating from the directed percolation universality class (DP) in the regime of low diffusion rates,
while they strongly suggest that
the DP class is recovered for larger hoping rates.
An opposite scenario is found in the latter disorder approach,
with a substantial increase of reentrant shape and the maximum diffusion,
in which the reentrant shape also displays a critical behavior
consistent to the DP universality class
(in similarity with the pure model).
In order to compare with
very recent claims, results by taking a bimodal distribution
and critical behavior in the limit of strong disorder are presented.
Also, results derived from the mean field theory (MFT) are performed, presenting
partial agreement with
numerical ones. Lastly, comparison with the diffusive
disordered CP has been undertaken.
PACS numbers: 05.70.Ln, 02.50.Ey, 64.60.Ht
I Introduction
Although typical nonequilibrium phase transitions transitions into an absorbing phase belong generically to the very well established directed percolation (DP) universality class marr99 ; odor07 ; henkel ; hinrichsen ; odor04 , the inclusion of impurities or defects drastically affects its critical behavior noest ; mordic ; hooy ; vojta ; barg ; vojta2 ; marc . Such disorder approach is an unavoidable ingredient of real systems and has been argued as one of the causes for the rarity of DP behavior in experiments exp . For these reasons, the study of disordered systems has deserved considerable attention in the last years.
Impurities and defects are different kinds of spatial disorder that leads to the existence of rare regions in the absorbing phase, characterized by large local activity and slow decay (algebraic, instead of exponential) toward the extinction with non-universal exponents vojta ; barg . It is typically introduced under two distinct ways, through random spatial variation of the control parameter vojta or random deletion of sites or bonds mordic ; vojta2 ; marc .
Even though less studied than the spatial disorder, the temporal disorder has also attracted interest jensen96 ; kamenev ; munoz2011 ; neto ; oliv-fiore16 ; neto2 . In contrast to the previous case, the control parameter is allowed to be time dependent, resulting in temporarily active (ordered) and absorbing (disordered) phases, whose effects are more relevant at the emergence of the phase transition. Heuristically the importance of temporal disorder can be set through the generalization of Harris criterion (valid for spatial disorder) harris , proposed by Kinzel kinzel . According to it, the temporal disorder is a relevant perturbation whenever the clean temporal correlation exponent (without disorder) satisfies the condition . Since for the DP universality class reads and in one, two and three dimensions respectively, the temporal disorder is expected destabilizing the DP absorbing phase transition. Recent results for the contact process (CP), the prototypical model in the DP class, have confirmed this. The temporal disorder also reveals a region in the active phase, named temporal Griffiths phase, in which the mean lifetime exhibits a power-law behavior (instead of exponential growth) munoz2011 ; neto ; neto2 . Despite this, results are restricted mainly for the contact process (CP) and with partial conflicting conclusions. The first set of numerical results, from Refs. munoz2011 ; jensen96 , predict non-universal critical behavior with algebraic behavior (being the critical exponent of a given quantity) and dependent on the disorder strength. On the other hand, based on a strong noise normalization group (RG) analysis and simulations, a behavior of type with universal critical exponents has been argued for the CP, in very recent works by Vojta et al. neto and Barghathi et al. neto2 .
Additionally, the effects of temporal disorder in the presence of other ingredients, such as particle diffusion, and interactions have not been considered yet. In particular, several works have shown that the diffusion constitute a relevant perturbation, affecting drastically the critical behavior henkel ; pcpd or even leading to distinct scenarios for discontinuous phase transitions fiore14 ; fiore15 ; scp2 .
In order to cover the above points, in this work we investigate the effects of temporal disorder in a variant of the usual CP, namely the triplet annihilation model (TAM) dic89 ; fiore05 . It is a stochastic lattice model that was proposed a long time ago and it has been studied over distinct numerical approaches dic89 ; fiore05 . Each lattice site in the TAM model is vacated or occupied by a particle. The creation events are similar to the CP, where single particles reproduce autocatalitically at rate . But alternatively, particle annihilation will occur (with rate ) only if there are three adjacent particles (the triplet is annihilated and the three respective sites become empty). Although its critical behavior belongs to the DP universality class (posing not any surprise), the inclusion of particle diffusion leads to an unusual phase diagram, including reentrant shape and indefinite activity (i.e. absence of phase transition) for sufficient high diffusion rates from a maximum diffusion . In the present work, we aim at covering three fundamental points: (i) what are the effects of temporal disorder in distinct examples of absorbing phase transitions (besides that describes the usual CP) as well as the influence of distinct ingredients? (ii) what is the result of the distinct sorts of temporal disorder? (iii) How do they compare with the CP? These issues will be answered by considering two kinds of temporal disorder, according to uniform and bimodal distributions, respectively. Results show that the disorder considered in the reactive part (creation-annihilation parameters) leads to the suppression (maintenance) of reentrant phase diagram for the uniform (bimodal) cases and critical behavior deviating from the DP in the regime of low diffusion rates. On the other hand, irrespective the disorder distribution numerical, our results (strongly) suggest that the DP universality class is recovered for larger values of the diffusion rates . In both cases, the maximum diffusion is mildly affected by the disorder. An opposite scenario is resulted when the disorder is included in the diffusion, with a substantial increase of reentrant shape and . A detailed analysis of the critical behavior in the regime of temporal disorder will be presented.
This paper is organized as follows: In Sec. II, we describe the model and methods. In Sec. III we show the numerical results for the TAM, whereas the comparison with the disordered CP has been undertaken in Sec. IV. Conclusions are presented in Sec. V.
II Model and methods
In the TAM model, the creation of particles is similar to the usual CP (one particle is required for creating a new species in an empty neighboring site), but instead only three adjacent particles can be annihilated (and the three sites are left vacant). Schematically, it is represented by the chemical reactions and , being and the creation and annihilation strength rates, respectively. Additionally, with rate one species hops to one of its nearest-neighboring sites (chosen at random), provided it is empty ().
As mentioned previously, in the pure version (without disorder), the competition between diffusion and triplet annihilation changes dramatically the phase diagram, including a reentrant portrait and no phase transition up to a limit diffusion rate (in the one-dimensional case, ). For , an active state is also possible for very large annihilation rates. In Fig. 5 (continuous lines), the phase diagram for the pure version is shown in terms of the variable , being .
The temporal disorder is introduced in form so that the time changes by (being the computational time) a given control parameter is updated to a new value. In the uniform case, the new is extracted from an uniform distribution with mean and width , implying that , where is random number . In the former approach, the creation-annihilation changes with (with fixed ), whereas in the latter approach the diffusion is time dependent (with fixed ). Thus in the former (latter) cases, () are restricted between and ( and ). Since , the reactive part is composed only of annihilation and creation whenever and , respectively. For the disorder included in the diffusion, the actual simulation is composed of only creation-annihilation (diffusion) subprocesses, whenever has a negative (larger than 1) value. From now on we will call the former (latter) case the -disordered (-disordered) TAM model. In the bimodal case (studied only for the disordered TAM), as the time changes the annihilation rate is chosen from two values, and , with probabilities and , respectively and .
Numerical analysis will be carried out by performing spreading experiments and the time decay of the system density. In the first case, one starts from an initial configuration close to the absorbing state, except for three adjacent particles placed in the center. Typical quantities in this analysis are the survival probability , the total number of particles and the mean cluster size . For usual absorbing phase transitions, at the critical point they behave as
| (1) |
where and are their associated critical exponents. For the DP universality class they read , and henkel .
Second, the time evolution of the system density starting from a fully occupied lattice will be considered. At the critical point, exhibits an power-law behavior
| (2) |
being its associated critical exponent. By restricting the calculation only over survival runs, also decays as Eq. (2) for the initial time but for larger it converges to a definite value . Finite-size scaling analysis shows that depends on according to the scaling behavior , where and are the critical exponents associated to the order-parameter and the spatial length correlation, respectively. Since and , above analysis not only provide two additional critical exponents, but also it give us an achievement of , in order to certify the scaling behavior at the criticality. For the DP universality class, the rapidity-reversal symmetry states the exponents and should be equal. This can be understood by considering the DP process in which the occupation probability of the directed percolation process is identical in both time directions (forward and backward), implying that the time evolution of starting from a fully active lattice is equivalent to the behavior of in the reversal time direction. Also, the hyperscaling relation is satisfied, as indeed verified in Ref. jensen96 . Assuming a scaling of type predicted by Eq. (1), the critical point can be located in an undoubtedly way by taking the behavior of versus , in which the dependence on time does not explicitly appear. More specifically, by isolating the time in and substituting in the expression for ), both kind of scalings provide the similar expression (where is the ratio between the exponents ruling the time evolution of and , respectively). Off the criticality, deviates from the algebraic behavior. Such analysis also has revealed useful in the context of spatial disorder vojta , since it avoids the use of arbitrary times for achieving the critical exponents. For DP universality class one has , whereas in other cases, the values of are expected to be different.
Recently, based on strong noise RG group, Vojta et al. neto and Barghathi et al. neto2 portended a new kind of scaling in the presence of sufficient strong temporal disorder (infinite noise) for the CP. According to it, relevant quantities behaves as
| (3) |
The exponents , have exact values , , whereas and are unknown. In addition, they satisfy the hyperscaling relation , where , and for the one-dimensional case . The time evolution of system density is also given by and thus its exponent is similar to the , in accordance with the time reversal symmetry. Although the occupation probabilities changes, their values in the forward and backward directions are equal (since for ). Since the critical behavior in the presence of temporal disorder is still unclear, we will discuss (compare) both kind of scalings for distinct points in the phase diagram.
III Results
III.1 Temporal disorder in the creation-annihilation parameter: -disordered TAM
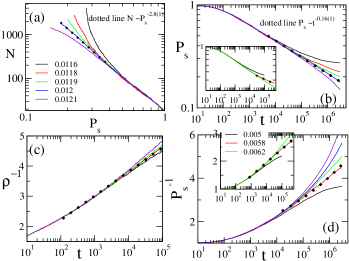
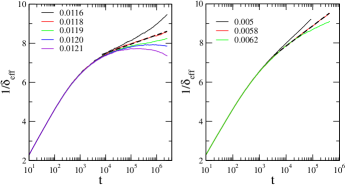
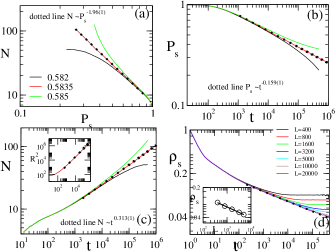
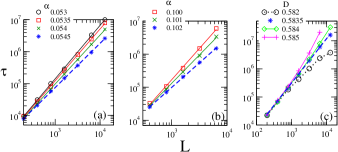
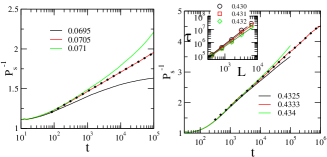
In this section, we show the main results for the disorder included in the creation probability (disordered TAM). In all cases, the averages will be evaluated by repeating over disorder configurations. For a fixed rate , the hoping, creation and annihilation process are chosen , , , respectively. In the first inspection, we analyze the critical behavior for an uniform disorder distribution for , and , as shown in Fig. 1. As previous results for the usual CP munoz2011 ; neto2 , results present a critical behavior different from the DP universality class. In particular, panels reveal that the behavior of and follow the predictions from strong noise RG at for about three orders of magnitude in time, in conformity with Ref. neto2 . Conversely, panels show that the standard critical behavior [Eqs. (1) and (2)] is also verified for about three orders of magnitude in time at (very close to the previous estimate). However, here the exponents and are different, suggesting that the time-reversal symmetry is violated, although the hyperscaling relation has been verified within the error bars (in the second decimal digit). Extension for other diffusion values is shown in Table I, revealing a non-universal critical behavior in the regime of lower ’s. Since the inclusion of temporal disorder is not expected violating such symmetry (see previous discussion in Sec. II), we believe that Eq. (3) predicts correctly the critical behavior for larger ’s (here exemplified for ) and low diffusion rates. With a view to strengthen the influence of temporal disorder, we repeat above analysis for (insets in Fig. 1) 111Since the critical point decreases greatly by increasing , numerical results predicts the suppression of phase transition (the system is constrained in the absorbing phase for all values of ) for when .. In fact, the crossover to Eq. (3) is verified for lower computational times ( instead of for ), reinforcing that results follow the strong disorder RG neto ; neto2 . Additional comparison between scalings is obtained by measuring the effective exponent from the relation , as shown in Fig. 2 for and . For , although seems converging to a constant value at , a decay of type is verified for larger computational times at . Similar conclusion is found for at . Thus, the evaluation of provide additional information about the validity of Eq. (3).
On other hand, in the regime of weaker disorder (see e.g Table II for ), results do not exclude the critical behavior described by the usual scaling [Eqs. (1)-(2)], in conformity with Refs. jensen96 ; munoz2011 . We believe that much larger computational times are required for distinguishing both sort of scalings, which are beyond our computational capacities. Despite this, the shape of phase diagrams are not affected by the difference of scalings, since both criteria give critical points very close to each other (differing in the fourth decimal digit).
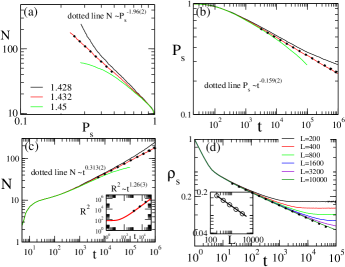
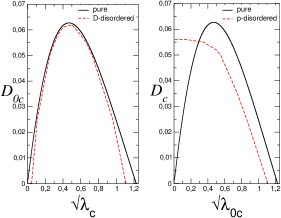
An opposite scenario has been verified in the regime of large diffusion rates. In this case, all critical exponents are consistent to the DP values, as shown in Tables I and II (larger ’s) and exemplified in Fig. 3 and Fig. 4 for () and (), respectively. In both cases, different quantities follow power-law behaviors consistent with their corresponding DP exponents for at least three orders of magnitude in time (see dotted lines). This provides the first evidence that the temporal disorder becomes irrelevant in the limit of large diffusion rates. Fig. 5 shows the phase diagram for both values of . In order to compare with the results by Dickman (continuous lines) dic89 , they are plotted in terms of , being .
| 0 | 0.0120(1) | 0.16(1) | 0.11(1) | 0.45(1) | 1.33(1) | 0.168(1) |
|---|---|---|---|---|---|---|
| 0.2 | 0.2579(1) | 0.18(1) | 0.13(1) | 0.35(1) | 1.28(4) | 0.203(3) |
| 0.53 | 2.589(1) | 0.161(2) | 0.157(2) | 0.317(3) | 1.26(3) | 0.252(2) |
| 0.56 | 5.68(2) | 0.159(1) | 0.155(2) | 0.313(2) | 1.26(3) | 0.253(2) |
| DP | - | 0.1594… | 0.1594… | 0.3136… | 1.265… | 0.252… |

| 0 | 0.1390(2) | 0.15(1) | 0.13(1) | 0.40(1) | 1.32(3) | 0.199(1) |
|---|---|---|---|---|---|---|
| 0.2 | 0.3086(1) | 0.16(1) | 0.15(1) | 0.34(2) | 1.26(2) | 0.233(2) |
| 0.5 | 1.432(1) | 0.159(2) | 0.155(2) | 0.313(2) | 1.26(4) | 0.253(2) |
| 0.55 | 2.57(1) | 0.159(1) | 0.156(2) | 0.313(2) | 1.26(2) | 0.253(2) |
| 0.575 | 4.70(1) | 0.159(2) | 0.158(1) | 0.314(2) | 1.26(2) | 0.253(2) |
| DP | - | 0.1594… | 0.1594… | 0.3136… | 1.265… | 0.252… |

The inclusion of the uniform distribution of disorder induces the suppression of the reentrant shape, whose effects are more pronounced for . Although a very small reentrance is observed for , it is absent for . On the other hand, the maximum diffusion separating phase transition from endless activity is practically unaffected by the disorder, yielding at and - estimates very close to the pure value , once again validating the irrelevance of disorder for sufficient large diffusion rates.
In the absorbing phase, we expect an asymptotic behavior of type , whose exponent depends on and . Starting from the critical point and increasing (for a fixed ), the exponent behaves slower for larger diffusion than for lower rates. In fact, for and , the exponent are ranged in the interval for , whereas for , we have that (in the interval ). Thus, the diffusion works against the absorbing phase in the TAM, in which for , consistent to the emergence of an endless active phase.
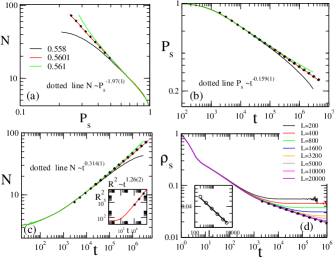
In order to draw a comparison with Refs. neto ; neto2 as well as inspecting the influence of the disorder distribution, we consider the disordered TAM for a bimodal distribution. Firstly, we examine the influence of ’s, as shown in Fig. 6 for , and .
As for , by increasing the crossover for the strong noise scaling is approached for lower ’s. The phase diagram is shown in Fig. 7 for , and . As in the uniform case, the critical behavior deviate from DP for small diffusion rates, following the scaling consistent to Eq. (3). Also, for , results also propound a critical behavior consistent to the DP universality class (see e.g. Fig. 8). Note that as increases the critical point becomes very close to the pure case, conjecturing once again the smallness of temporal disorder in the limit of strong hoping rates. On the other hand, the distinct kind of disorder leads to some differences in the topology of phase diagram. Unlike the uniform case, the disorder does not suppress the reentrance shape. Also, for a given diffusion, the disorder critical point is always lower ( is larger) than its the pure value. This can be understood in contrast to the bimodal distribution (in which the disorder makes be only lower than ), the uniform case provides the probabilities to be larger and lower the . A last comment concerns that although is a relevant parameter for low diffusion (see e.g Fig. 6), this is not the case for larger ’s. For example, for and , the critical point yields at , very close to for , thus closely related to the irrelevance of disorder for larger hoping rates.

A last comment concerns that although the results suggest the DP behavior being recovered for large diffusion (and thus violating the Kinzel’s criterion), one can not discard a crossover to the scaling behavior predicted by Eq. (3).
III.2 Temporal disorder in the diffusion parameter: -disordered TAM
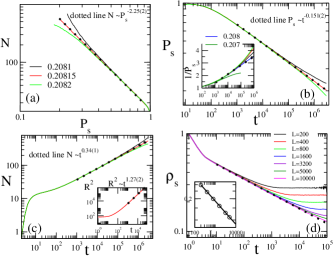
The temporal disorder is introduced in a similar manner, in which the diffusion rate is time dependent with static creation-annihilation rates. Thus, the diffusion, creation and annihilation processes are chosen with probabilities , , , respectively being and also extracted from an random distribution whenever . In Fig. 9, we show the phase diagrams are shown for and and . Surprisingly, unlike the previous (uniform) cases, the disordered version not only maintains the reentrant part, but also enlarges the absorbing phase and the maximum diffusion , whose effects are more pronounced for . In particular, we found the reads and , for and , respectively.

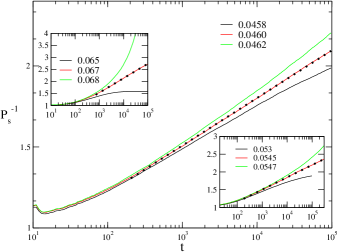
Table III exemplifies the critical exponents for distinct diffusion values and by assuming the usual scaling behavior. As exemplified in Fig. 10, results suggest a behavior consistent to the DP universality class in the reentrant shape (for both ’s). Outside this region, the critical behavior clearly deviate from the DP. For , the usual power-law behavior describes the results somewhat better than the strong noise RG neto2 . This is exemplified in Fig. 11 [panels and inset], in which results are well described by Eqs. (1) and (2) for more than three decimal levels. The exponents and are also equivalent (within error bars). Similar results are obtained for distinct points of the phase diagram (for both ), although critical exponents are rather few precise (uncertainties are in the second decimal digit). Thus, we believe that scaling from Eq. (3) (see inset in ) can not be discarded. Comparison with the critical behavior for (not shown) reveals that, in contrast to the disordered case, there is no substantial crossover to the strong-noise RG theory for lower times.
| 0.01 | 0.20815(5) | 0.151(5) | 0.151(5) | 0.34(1) | 1.27(2) | 0.245(5) | |
|---|---|---|---|---|---|---|---|
| 0.6452(1) | 3.5 | 0.13(1) | 0.15(1) | 0.34(2) | 1.23(2) | 0.249(1) | |
| 0.6231(1) | 2.15 | 0.13(1) | 0.15(1) | 0.35(1) | 1.25(1) | 0.241(2) | |
| 0.6373(1) | 16 | 0.158(2) | 0.154(1) | 0.314(2) | 1.24(2) | 0.256(2) | |
| 0.5601(1) | 100 | 0.159(1) | 0.151(2) | 0.314(1) | 1.22(3) | 0.253(2) | |
| 0.411(1) | 1000 | 0.160(1) | 0.15(1) | 0.312(1) | 1.24(2) | 0.25(1) | |
| DP | - | 0.1594… | 0.1594… | 0.3136… | 1.265… | 0.252… |
III.3 Temporal Griffiths Phases (TGPs)
Although Vasquez munoz2011 have found the presence of TGPs in the CP only for , recent results by Barghathi et al. neto2 have verified their occurrence in for larger . In this section, its presence for the disordered TAM has been investigated. For instance, we evaluate the mean life time by measuring the spent time to the system reaching the absorbing phase (starting from a fully occupied initial configuration). The is then obtained by repeating such process over a sufficient number of identical initial configurations (here we used ). Our analysis focus on the bimodal distribution for and three distinct points of the phase diagram. Fig. 12 shows the main results for , and with corresponding critical points reading , and , respectively.
Note that for and , there is a clear region in the active phase (continuous lines) in which exhibits algebraic dependence on displaying with non-universal exponents (increasing by lowering ). In particular, at the critical points (dashed lines) the slopes read , in rather few agreement with the theoretical value . Thus, as for the CP, TGPs are presented for the TAM. Opposite results are seen for the larger diffusion example (and ). No region within the active phase with algebraic behavior is presented. Only at the criticality behaves as , consistent to the DP universality class exponent . Thus, the analysis of for finite systems suggest once again the irrelevance of temporal disorder for larger diffusion values.
III.4 Mean-field results
Aimed at to comparing with numerical simulations, we accomplish mean field approximations (MFT) for temporal disorder TAM. Since the diffusion conserves the particle number, it is required to take into account at least correlations of two sites to have included its effect. The time evolution of quantities are identical to those obtained by Dickman dic89 , but instead the control parameter becomes time dependent. We focus on the uniform distribution, in which for the and disordered TAM it follows that and , respectively. In Fig. 13, the phase diagrams for are shown for and and , for the and disordered TAM, respectively. For comparison results for the pure two-site MFT model (continuous lines) are included.
Note that in all cases, the two-site MFT reproduces partially the numerical findings. Whenever the reentrance is suppressed for the disordered TAM, it is preserved for case. However there are some differences between MFT and numerical results. In both cases, the critical lines are encompassed by the pure ones. This feature is verified numerically only for the case and larger diffusion rates. We believe that these discrepancies should be eliminated by taking into account higher level of correlations in the time equations than those considered here.
IV Comparison with the contact process
In order to achieve a complementary information about the competition between diffusion and temporal disorder, in the last section we present a brief analysis for the usual contact process. We focus on the disordered case with a bimodal distribution, whose numerical simulations have been performed in a similar way than for the TAM and from Refs. neto ; neto2 . Fig. 14 shows the main results for and . In all cases, we take , and .
In both cases, results follow very well the strong noise RG neto ; neto2 , even for sufficient large diffusion values (exemplified for . Results for (not shown) still exhibit a similar behavior, but for only larger times. Also, algebraic dependence on the life time for finite systems (inset) in the active phase () with non-universal exponents are presented for . Thus, contrasting to the TAM, above results suggest that the inclusion of strong diffusion in the CP brings less pronounced changes for the TAM. Therefore, the influence of diffusion in both models seems leading to complementary features. However, we remark that more studies are still required, including the influence of or other kinds of disorder.
V Discussion and conclusions
In this paper we give a further step for establishing the effects of temporal disorder in one-dimensional absorbing phase transitions. Aimed at addressing universality hypothesis, the competition between disorder with diffusion and inspecting different kinds of disorder, we investigated a variant of the CP process, holding a reentrant phase transition and active phase for sufficient low activation rates. Our conclusions can be summarized as follows: (i) For the uniform distribution, the disorder introduced in the creation-parameter or in the diffusion induces slightly different phase diagrams. While the reentrant shape is suppressed in the former, it is enlarged under the latter approach. On the other hand, for bimodal disorder distribution, the reentrant portrait is maintained. (ii) The role of diffusion is different in both cases, leading to distinct critical behaviors. Our findings suggest that whenever the disordered case approaches to the DP universality class as the diffusion increases (for both distributions), for the disordered case, the DP behavior is restored only in the reentrant part (at least for larger ’s). Since they contradict the Kinzel criterion about the relevance of temporal disorder, a crossover to an universality class other than DP on much larger time scales is not excluded in such cases. Also, in order to draw a comparison with numerical findings, analysis in the level of two site MFT has been performed. In all considered cases, the phase diagrams are in part similar with those obtained numerically. (iii) For the disordered case, as the temporal disorder increases (by raising or/and ), our results corroborate the strong-disorder theory by Vojta et al. neto ; neto2 . However, results for the TAM indicate that the effect of diffusion is more ”drastic” than for the CP.
Although numerical results indicate a critical behavior consistent to the usual algebraic behavior for weaker disorder, we believe that further studies are still required, in order to address the critical behavior under firmer basis. In other words, a crossover to the regime from Eq. (3) for larger times is possible in such cases.
Therefore this work provides evidences that phase diagram and the critical behavior of low dimensional systems with absorbing states can be different depending on the way the temporal disorder is introduced. This result can be interesting in the analysis of real systems subjected to environmental noise.
ACKNOWLEDGMENT
We acknowledge J. A. Hoyos for a critical reading of this manuscript and useful comments. The financial supports from CNPq and FAPESP, under grants 15/04451-2 and 307620/2015-8, are also acknowledged.
References
- (1) J. Marro and R. Dickman, Nonequilibrium Phase Transitions in Lattice Models (Cambridge University Press, Cambridge, 1999).
- (2) G. Ódor, Universality In Nonequilibrium Lattice Systems: Theoretical Foundations (World Scientific,Singapore, 2007)
- (3) M. Henkel, H. Hinrichsen and S. Lubeck, Non-Equilibrium Phase Transitions Volume I: Absorbing Phase Transitions (Springer-Verlag, The Netherlands, 2008).
- (4) H. Hinrichsen, Adv. Phys. 49, 815 (2000).
- (5) G. Ódor, Rev. Mod. Phys 76, 663 (2004)
- (6) A. J. Noest, Phys. Rev. Lett. 57, 90 (1986).
- (7) A. G. Moreira and R. Dickman, Phys. Rev. E 54, R3090 (1996).
- (8) T. Vojta and M. Y. Lee, Phys. Rev. Lett. 96, 035701 (2006).
- (9) M. M. de Oliveira and S. C. Ferreira, J. Stat. Mech. 2008, P11001 (2008).
- (10) J. Hooyberghs, F. Iglói and C. Vanderzande, Phys. Rev. Lett. 90, 100601 (2003).
- (11) See for example, T. Vojta and M. Dickison, Phys. Rev. E 72, 036126 (2005).
- (12) H. Barghathi and T. Vojta, Phys. Rev. Lett 109, 170603 (2012).
- (13) H. Hinrichsen, Braz. J. Phys. 30, 69 (2000).
- (14) I. Jensen, Phys. Rev. Lett. 77, 4988 (1996).
- (15) F. Vazquez, J. A. Bonachela, C. López and M. A. Muñoz, Phys. Rev. Lett. 106, 235702 (2011).
- (16) A. Kamenev, B. Meerson and B. Shklovskii, Phys. Rev. Lett. 101, 268103 (2008).
- (17) T. Vojta and J. A. Hoyos, Europhys. Lett. 112, 30002 (2015).
- (18) M. M de Oliveira and C. E. Fiore, arXiv preprint arXiv:1603.08742 (2016).
- (19) H. Barghathi, T. Vojta and J. A. Hoyos, Phys. Rev. E 94, 022111 (2016).
- (20) A. B. Harris, J. Phys. C 7, 1671 (1974).
- (21) W. Kinzel, Z. Phys. B 58, 229 (1985).
- (22) M. Henkel and H. Hinrichsen, J. of Phys. A: Math. and Gen. 37, R117 (2004).
- (23) C. E. Fiore and G. T. Landi, Phys. Rev. E 90, 032123 (2014).
- (24) S. Pianegonda and C. E. Fiore, J. Stat. Mech. 2015, p08018 (2015).
- (25) M. M. de Oliveira, R. V. dos Santos, and R. Dickman, Phys. Rev. E 86, 011121 (2012); M. M. de Oliveira and R. Dickman Phys. Rev. E 90, 032120 (2014).
- (26) R. Dickman, Phys. Rev. B 40, 7005 (1989).
- (27) C. E. Fiore and M. J. de Oliveira, Phys. Rev. E 72, 046137 (2005).