Imaging Analysis of the Hard X-ray Telescope ProtoEXIST2 and New Techniques for High Resolution Coded Aperture Telescopes
Abstract
Wide-field ( 100 deg2) hard X-ray coded-aperture telescopes with high angular resolution ( 2′) will enable a wide range of time domain astrophysics. For instance, transient sources such as gamma-ray bursts can be precisely localized without assistance of secondary focusing X-ray telescopes to enable rapid followup studies. On the other hand, high angular resolution in coded-aperture imaging introduces a new challenge in handling the systematic uncertainty: average photon count per pixel is often too small to establish a proper background pattern or model the systematic uncertainty in a time scale where the model remains invariant. We introduce two new techniques to improve detection sensitivity, which are designed for, but not limited to high resolution coded-aperture system: a self-background modeling scheme which utilizes continuous scan or dithering operations, and a Poisson-statistics based probabilistic approach to evaluate the significance of source detection without subtraction in handling the background. We illustrate these new imaging analysis techniques in high resolution coded-aperture telescope using the data acquired by the wide-field hard X-ray telescope ProtoEXIST2 during the high-altitude balloon flight in Fall, 2012. We review the imaging sensitivity of ProtoEXIST2 during the flight, and demonstrate the performance of the new techniques using our balloon flight data in comparison with simulated ideal Poisson background.
Subject headings:
hard X-ray Imaging — CdZnTe — Coded-aperture imaging1. Introduction
Near-arcmin angular resolution for wide-field111Here we loosely define wide field as a solid angle 100 deg2, which enables all sky survey in a reasonable time scale and depth. For instance, a telescope with a 100 deg2 field of view can scan the entire sky in roughly 2 yr with an average exposure of 100 ks. hard X-ray coded-aperture telescopes is within reach in near future. The Burst Alert Telescope (BAT) on Swift, which have been operating successfully for more than a decade, covers a 1.4 sr field (50% coding222Field of views of coded-aperture systems quoted in this paper refer to 50% coding unless otherwise noted.) with the 22′ angular resolution in the 15–150 keV band (Gehrels et al., 2004). The Imager on Board the INTEGRAL Satellite (IBIS) and the Joint European X-ray Monitor (JEM-X) can observe a 19 19 deg2 field with the 12′ resolution in the 15 keV – 10 MeV band and a 7.5∘ diameter field with the 3′ resolution in the 3–35 keV band, respectively (Winkler et al., 2003).
Recently we have achieved the 5′ angular resolution over a 20 20 deg2 field in the 5 – 200 keV band with a balloon-borne hard X-ray coded-aperture telescope ProtoEXIST2 (Hong et al., 2013) by employing an array of CdZnTe detectors with the Application Specific Integrated Circuits (ASICs) of a high pixel density used in Nuclear Spectroscopic Telescope Array (NuSTAR) (Harrison et al., 2013). Next generation ASICs with a higher pixel density will soon enable 2′ resolution, which will allow source localization within 20″. High precision source localization from a wide-field hard X-ray telescope can initiate rapid follow-up studies of transient sources with many telescopes around the world without assistance of secondary focusing X-ray telescopes, and thus open a wide range of discovery space in the time domain astrophysics.
High resolution in coded-aperture telescopes introduces a new challenge in handling the systematics such as non-uniform detector background. Even with a decent exposure, observed photon counts per pixel often remain too low to establish the precise pattern of non-uniformity in the detector plane, which can limit the detection and localization sensitivity. Novel observing schemes such as continuous scan or dithering can reduce the unknown systematic errors (Grindlay & Hong, 2004), but as the pixel density increases, additional care in the analysis is required to ensure the high sensitivity. Here we introduce two new techniques to alleviate the effects of systematics and improve detection sensitivity even under low count statistics of high resolution coded-aperture telescopes. We illustrate these new imaging analysis techniques using the data acquired by the wide-field high resolution hard X-ray telescope ProtoEXIST2 during the high-altitude balloon flight in Fall, 2012.
In Section 2, we review the basic parameters of the ProtoEXIST2 telescope. In Section 2.1, we describe the boresight calibration and the performance of our pointing and aspect system during the high altitude balloon flight in Fall, 2012. In Section 2.2, we estimate the sensitivity limit of the ProtoEXIST2 telescope and illustrate the challenge of high resolution coded-aperture telescopes using the ProtoEXIST2 observations during the flight. In Section 3, we introduce a self-correcting background modeling scheme, which utilizes continuous scan or dithering operations. In Section 4, we introduce a Poisson statistics based detection significance map called ‘trial map’ (Hong et al., 2016) to coded-aperture imaging, which can handle the background without subtraction.
| Parameters | Values |
|---|---|
| Sensitivity | 140 mCrab/hra |
| Energy Range | 5 – 200 keV |
| Energy Resolution | 2 – 3 keV |
| Field of View | 20∘ 20∘ (50% Coding) |
| Angular Resolution | 4.8′ |
| CZT Detector | 56 crystals (1.98 1.98 cm2) |
| Active Area | 220 cm2 |
| Pixel, Thickness | 0.6 mm, 5 mm |
| Tungsten Mask | 4 layers 0.1 mm thick |
| Coding Area | 33.3 33.3 cm2 |
| Pixel, Grid, Thickness | 1.1 mm, 0.1 mm, 0.4 mm |
| Pattern | Random |
| Mask-Det. Separation | 90 cm |
| Rear and Side Shields | Graded Pb/Sn/Cu |
| 241Am Cal. Source | 220 nCi each, 36 cm above det |
(a) Without atmospheric absorption. The atmospheric absorption at altitude of 40 km can reduce the signal by a factor of 3 in the 30–100 keV band, which depends on the source spectrum and the pointing elevation.
2. ProtoEXIST2
The ProtoEXIST payload during the flight in 2012 consisted of the two X-ray telescopes - ProtoEXIST1 & 2 and a day-time optical star camera for pointing guidance and aspect correction. The detailed description of the instruments and the flight performance of the detector system are found in Hong et al. (2013). In this paper, we focus on the imaging performance of the ProtoEXIST2 telescope. Table 1 summarizes the telescope parameters of ProtoEXIST2.
The ProtoEXIST2 telescope is a wide-field hard X-ray telescope with an array of CZT detectors and a Tungsten mask. High pixel density in the CZT detectors and the Tungsten mask enables 5′ angular resolution over more than 20∘ 20∘ field-of view (FoV) of 50% coding fraction. The combined thickness of 0.4 mm in the Tungsten mask can modulate X-rays up to 200 keV. Low noise ASICs used in NuSTAR and thick CZT crystals (5 mm) cover a wide energy range from 5 to 200 keV, although at a typical flight altitude ( 40 km) X-rays below 30 keV from celestial sources are undetectable due to absorption in the remaining atmosphere along the line of sights.
2.1. Pointing & Aspect System
A few days before the flight in 2012, we measured the boresight offset between the X-ray telescopes and the optical star camera using an 241Am radioactive source (Hong et al., 2013). The analysis showed that a relative offset is (az, el) = (+5′,+39′) for ProtoEXIST2 when there is no pressure difference between the inside and the outside of the pressure vessel (PV). During the flight, the pressure difference between the inside and the outside of the PV forced the top cap of the PV to bow out by a few degrees. Since the coded masks were mounted on the top cap, this introduced an additional shift between the X-ray telescopes and the star camera. We measured the additional offset by creating an artificial pressure difference on the ground after the flight. Under an about 12 psi difference, which is expected between the ground level of Ft. Sumner, New Mexico and the air pressure at altitude of 40 km, the additional offset was measured to be (az, el) = (+12.1′,+13.9′), so that the total boresight offset of ProtoEXIST2 relative to the star camera is (17.2′, 52.9′). The correction for this boresight offset is applied in reconstructing X-ray sky images from the ProtoEXIST2 observations below.
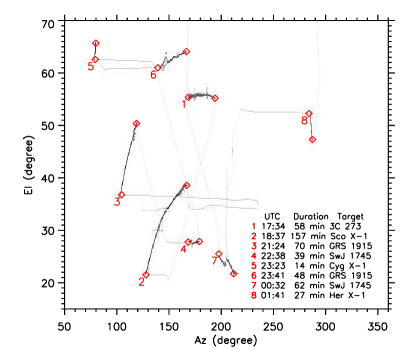
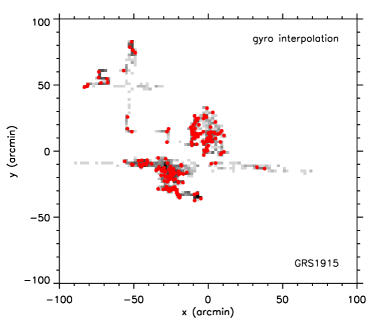
Figure 1 shows the pointing history of the ProtoEXIST telescopes during the 2012 flight in azimuth and elevation. We observed 6 X-ray sources with 8 separate pointings that lasted 15 to 160 mins each. While the ProtoEXIST2 telescope performed well during the flight (Hong et al., 2013), the pointing guidance system encountered a few issues that prevented the telescopes from locking on each target. The top panel in Figure 2 shows a scatter plot of the target positions relative to the pointing direction retrieved from the 206 star camera images during the observation of GRS 1915+105. The gray tracks are interpolated points by the onboard Gyroscope in between two successive star camera images. While the targets were mostly in the central FoV during the observations as seen in Figure 2, they were constantly drifting beyond the angular resolution of the telescope at various speeds.
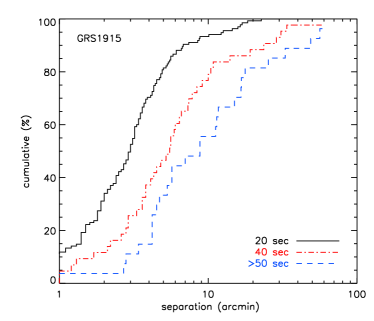
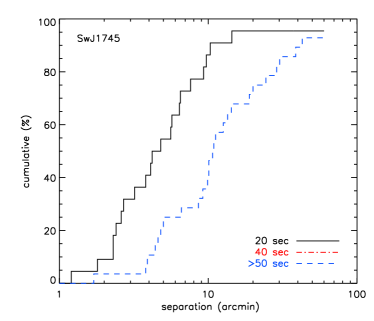
We have to rely on the star camera images to recalculate the precise pointing direction and apply the subsequent corrections. Unfortunately, the pointing software was not designed to store all the star camera images, and the number of the usable star camera images saved during the flight were limited to 20 during the observation of Sco X-1, 50 for Swift J1745.1–2624 and 206 for GRS 1915+105. The bottom two panels in Figure 2 show accumulative histograms of the changes in pointing direction between two successive star camera images during the observations of GRS1915+105 (middle) and Swift J1745.1–2624 (bottom). The shortest interval between two star camera images was 20 sec and the next 40 sec apart. In 20 and 40 sec the pointing system drifts more than 3′ and 5′ for a half of the time, respectively. Although the pointing system became more stable by the second observation of GRS 1915+105, the movement between two successive star camera images is often larger than the angular resolution (4.8′).
This indicates that one cannot rely on the aspect information beyond 10 sec within each star camera image. Unfortunately this severely limits the data unusable for X-ray imaging. For instance, in the case of GRS 1915+105, the relatively good time interval (GTI) is about 69 mins out of the 118 min observation. For the rest of sources, the GTIs range from about 7 to 14 mins total per source.
2.2. Sensitivity Estimate
We mainly focus on the observation of GRS 1915+105, which was conducted during a relatively stable pointing period and produced the largest number of the star camera images. Figure 3 shows the lightcurve of GRS 1915+105 measured by the Swift/BAT pointing and slew survey (BATSS) (Copete, 2012) around the ProtoEXIST2 observations of the source. A longer term lightcurve of the source shows that the 15–50 keV flux of GRS 1915+105 was 400 mCrab weeks before our observation but fluctuated down to 100–150 mCrab during our observation.

For an about 70 min observation of a 150 mCrab source, we expect 1400 photons on the detector in 30–100 keV after accounting for the atmospheric attenuation (by a factor of 3 on average). We observed about 1.1 cps per detector unit in 30–100 keV, so the total background is about 270000 counts. For an ideal system with perfect pointings and pure Poisson-driven background, we expect a signal-to-noise ratio (SNR) of 2.7. The finite mask to detector pixel ratio (1.8) introduces an imaging factor of 0.8 (Skinner, 2008), causing an additional loss in SNR by 20%. Assuming a relatively moderate aspect blurring of 1′ (likely an underestimate given the performance of the pointing system), we expect another reduction in SNR by 20%. We also expect that the non-uniformity in the background reduced the SNR by another 10% when untreated (see Section 3). Therefore a more realistic SNR expected from the source is 1.7. The sensitivity limit for a 5 detection in a 4000 sec observation is 450 mCrab. The limited GTIs due to relatively unstable pointings and the unexpectedly low hard X-ray fluxes of the observed sources ultimately hampered our ability to detect the sources.
According to Swift, the 15–50 keV X-ray fluxes of Swift J1745.1–2624 and Sco X-1 were about 500 mCrab and 1.5 Crab, respectively, during the time of the ProtoEXIST2 observations. However, for Swift J1745.1–2624, only 50 star camera images were saved and the pointing system was more unstable during the observation of Swift J1745.1–2624 by about a factor of 2 compared to the GRS 1915+105 as seen in Figure 2. The low elevation of the source would have also increased the atmospheric attenuation (Figure 1). In the case of Sco X-1, only 50 star camera images are available and its X-ray emission is dominantly soft, mostly below 30 keV, which is likely attenuated by the atmospheric absorption at the altitude of our flight.
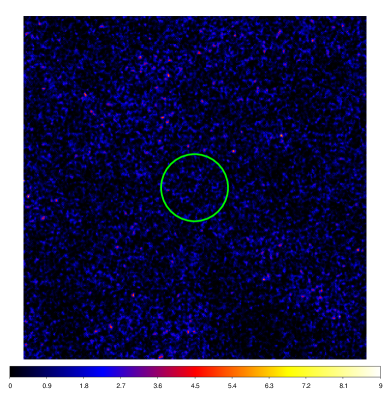
Figure 4 shows ProtoEXIST2 X-ray images of a 10 deg 10 deg region around GRS 1915+105. We extracted the data in a 20 sec interval around each of the 206 star camera images, and combined them with proper boresight and aspect corrections using the world coordinate system (WCS) of the star camera images. The reconstructed sky image on the left panel is without any background treatment and on the right with the background treatment described in the next section. There is no significant source in the FoV as expected from the SNR estimates in the above. Although the noise distribution in the sky image is well fitted by a Gaussian distribution, the sky image created without any background treatment shows large scale structures (e.g. diagonal and circular ridges), indicating the effects of the non-uniform background in the detector. In 20 sec, the average counts in each pixel of the detector is about 0.02 counts, so the non-uniform pattern of the background is not apparent in each individual detector plane image.
(a) 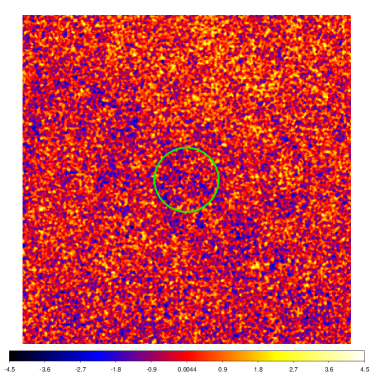 (b)
(b) 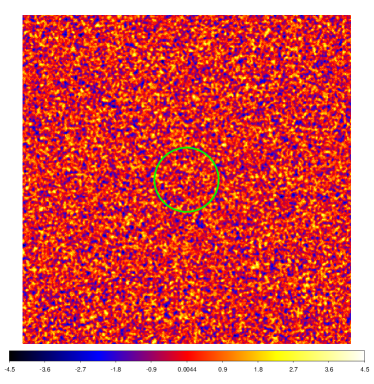
(c) 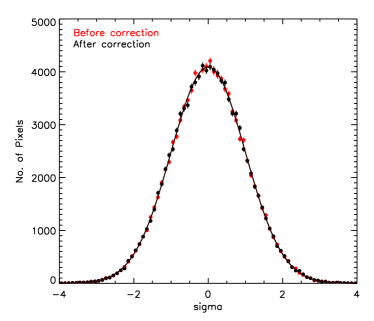 (d)
(d) 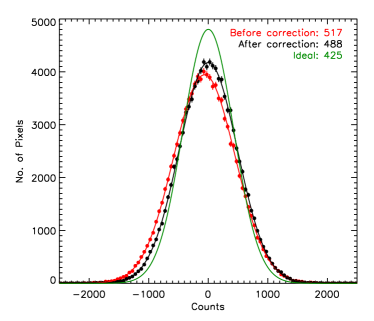
3. Self-Correcting Background Scheme
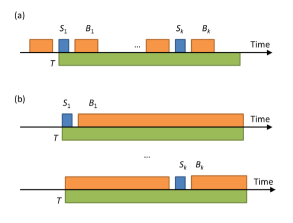
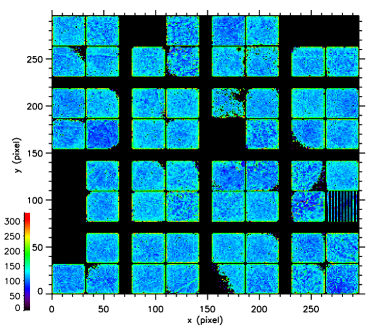

Figure 6 shows the distribution of X-ray events in the detector during the flight. The gaps between CZT crystals including additional space the wirebonds used for control and readout of the NuSTAR ASICs expose the side of each crystal to background radiation. As a result, edge pixels experience higher background counts than inner pixels. The edge pixel background enhancement is more clearly visible when the event distribution of each unit is stacked together (the right panel in the figure). Since the size of the gaps varies across the detector plane, each unit will have a different enhancement in the edge pixels. Besides the edge pixel background enhancement, there is also a more gradual trend of count increase toward the edges. The overall view of the event distribution in the detector (the left panel) also reveals other background patterns that are not originated from the coding pattern of the mask. These non-uniform background patterns are the source of large scale structures in reconstructed sky images (the left panel in Figure 4).
A common way to handle non-uniform background in coded-aperture telescopes is first establish a model of the background pattern from measurements and then subtract the properly scaled background model from the data set. For instance, in Swift/BAT, the detector plane image is ‘cleaned’ with a 14-element background model (Krimm et al., 2013).
During the 2012 flight, ProtoEXIST2 recorded about 1 counts ks-1 pix-1 in the 30–100 keV band after excluding X-ray events from the onboard 241Am source. Over an hour observation, each pixel would accumulate about 3 counts on average, which is too small to build a reliable analytic model for the background. Using a longer interval for background modeling would enable higher count statistics but it is not favorable since the background pattern often varies with time.
Alternatively one could try smoothing the event distribution to better identify the background pattern under the assumption that the background pattern does not have high spatial frequencies. However, as seen in the edge pixel enhancement due to detector gaps (Figure 6), it is not unusual to have high frequency noise fluctuations. Since bright sources will also generate high frequency fluctuations in the detector plane, it often requires complex multi-component background modeling with proper cleaning of bright sources to properly handle the systematics in the detector plane (e.g., Krimm et al., 2013).
In order to combat non-uniformity in the detector response in general, a continuous scan or slew motion instead of a fixed pointing has been proposed (Grindlay & Hong, 2004; Copete, 2012). During a scan, the relative position of each detector pixel with respect to a given sky pixel changes continuously, which allows any detector-coordinate dependent systematic errors to average out to some degree depending on how thoroughly the scanning operation covers the given FoV. In fact, scanning operation can be viewed as an extreme version of dithering motions, which are commonly used to reduce the systematics for both focusing and non-focusing telescopes.
In Swift/BAT, the roll angle is varied within 1 deg from an orbit to another to prevent the systematics errors from accumulating. The BAT slew survey (BATSS) takes advantage of the self-correcting feature in slew motions (Copete, 2012). In BATSS, given the high speed slews performed by Swift, one sky image is generated every 0.2 sec in order to minimize blurring, which is later combined to a single stacked image for source detection. Counts in each pixel of each 0.2 s image are relatively small and the pre-calculated background model may be not suitable for the rapid change of the telescope orientation during the slew. Nonetheless, the images generated by BATSS with no background handling procedure show an improvement relative to the images cleaned by a sophisticated background model from pointed observations of the equivalent duration (Copete, 2012). However, similarly to X-ray images generated from the ProtoEXIST2 data, the sky images from BATSS show large scale fluctuations due to lack of any treatment on the non-uniform background.
Figure 5 illustrates our new approach to auto-correct non-uniformity in the background under scanning or dithering motions while (unknown) sources of interests are in the FoV. The total duration of the observation is shown in the green interval (). First we divide the data into multiple segments, where each segment is well separated in terms of either pointing direction or roll angles more than the angular resolution. The figure shows, for the -th segment, the interval of each image () in blue and the background data set () in orange. In the case of Figure 5(a), each interval used for the background is chosen to surround the segment of the interest (): ideally the interval () should be long enough to have much higher photon counts than the same in (perhaps by a factor of 10 or more), but not long enough to allow any significant changes in the background pattern. If the background pattern has not changed significantly during the observation, the entire observation excluding each segment and its immediate neighbors can be used for the background interval for the segment as shown in Figure 5(b).
Assuming there is not enough photon statistics in any of to create a reliable analytic model, for each segment () we simply subtract the scaled (by /) raw counts in from (see Section 4 to handle the background without subtraction), and generate a background subtracted detector image. Then we combine the image of each segment with a proper aspect correction to make a final stacked image for source detection.
If changes in the pointing or roll angles between the segments are equivalent to or smaller than the angular resolution of the telescope, this procedure will eliminate the source signal as well as the background fluctuations since in essence it is a self-subtraction procedure. However, if each segment is different in pointing direction or roll angle larger than the angular resolution, this procedure will eliminate the background pattern tied to the detector coordinates within the limit of the given photon statistics while allowing the source counts to accumulate at the right sky position.
The right panel in Figure 4 shows an X-sky image generated with the background subtraction following the recipe in Figure 5 (b), which clearly shows a drastic reduction in the large scale variations, compared to the case without any background subtraction (a). In addition, while the overall noise distributions of the sky images in Figure 4 (a) and (b) follow Gaussian distributions as seen in Figure 4 (c), the noise distributions of the sky images in the raw count unit in Figure 4 (d) show that their noise spread is in fact larger than the spread expected from the pure statistical fluctuation of the observed counts (green). The large scale variations in Figure 4 (a) are also the cause of the offset in the noise distribution (red) in Figure 4(d). These indicate that there is indeed the systematic-driven contribution in Figure 4 (a). The self-correcting background scheme reduces the rms of the noise by 5–7% in addition to largely removing the large scale variations. Since our data did not have any detectable sources, in order to make sure that the source signal under the self-correction scheme does not get canceled out, we performed the same procedure with simulated sources.
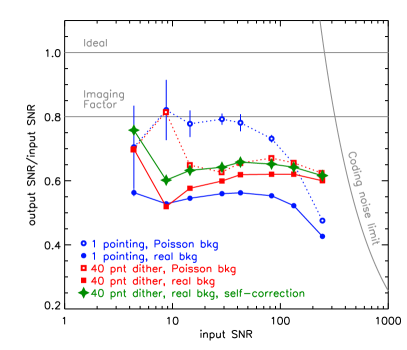
Figure 7 shows the ratio of the input and measured output SNR from simulated sources with a wide range of input signals. For background, we tested both pure Poisson statistics based backgrounds (dotted lines with open symbols) and the ProtoEXIST2 data (solid lines with solid symbols). Observations with fixed pointings (circles) are compared with the 40 point dithering motions (squares and diamonds). The results of a fixed pointing with pure Poisson noise set an ideal limit of the system, which is bounded by the imaging factor at low SNRs (80%) (Skinner, 2008) and by the coding noise limit at high SNRs. The coding noise is the mask pattern-induced noise (Skinner, 2008). The coding noise limit of the output SNR is about 296 for ProtoEXIST2. In observations with fixed pointings, the real background reduces the SNR down to 40-50% (closed circles) of the input SNR.
Dithering motions (red) alleviate the coding noise limit by mixing different parts of the mask pattern in the detector image, and thus outperforms pointed observations at high SNRs. To simulate realistic aspect corrections, we allowed about 1′ errors in simulated source positions, so even with pure Poisson noise backgrounds (open squares) the measured SNRs in the reconstructed images are lower than the input SNRs by about 60–70%. With the real background (closed squares), the output SNRs drop even more but not as much as the pointed observations, which illustrates the benefits of dithering or scanning motions. With the proposed treatment on the non-uniform background (green diamonds), the output SNRs recover almost up to the pure Poisson noise cases, which means about 3-10% improvements relative to the cases of no background handling. The improvements at low input SNRs are relatively larger: e.g. the proposed method improves the output SNR from 8.4 to 9.2. The improvement varies with the scale of dithering or scanning motions and the number of segments. If the number of segments is too small (or /10), the treatment will increase the rms of the sky background although it may still reduce the large scale structures.
4. Poisson Statistics based Detection Significance Map
A common method to reconstruct sky images (; represents the sky pixel index) for coded-aperture telescopes is to cross-correlate detector plane images (; represents the detector pixel index) with the mask pattern (=1 for open and 0 for closed pixels). The cross correlation is often performed through fast Fourier transformations (FFTs). In order to set the baseline value of the sky image at zero and the source counts at the right signal, the mask pattern is balanced by open fraction (), where the balanced pattern is 1 for open pixels, and for closed pixels. The detector plane image () is background () subtracted and masked out for dead pixels or inactive zones, if any, before cross-correlation. For a random mask pattern, detector plane images are ‘rebalanced’ to have the total counts of zero using a constant (), which suppresses large scale structures bigger than the angular resolution. The ‘rebalancing’ procedure is often essential for point source detection, but it suppresses a large scale variation even if its origin is celestial. In summary, the reconstructed sky image () is given by
| (1) |
where = 0.
The background subtraction, although it efficiently addresses non-uniformity of the detector, may not be optimal in handling non-negative counts of Poisson statistics especially for characterizing the detection significance of faint sources near the detection threshold. An alternative approach is to calculate the probability of having more than the observed counts from a random fluctuation of the background counts based on the Poisson statistics. For every sky position in the FoV, one can estimate the total observed counts () by cross-correlating the raw mask pattern and the raw detector plane image: .
The mask pattern () consists of non-negative numbers representing open fraction ranging from zero for totally opaque elements to one for fully open elements. The detector plane image also consists of non-negative raw counts. For the estimation of the background counts, we repeat the calculation using the background model.
Then for a given pixel () in the sky, the expected background () is given as
Note is an inverted mask pattern, which ranges zero for fully open elements to one for totally opaque elements, but the non-imaging opaque elements remain zero. Then, and represent the portion of the counts that cannot come from the sky pixel among the coded detector area for the sky position.
For the total observed counts () and the background estimate () at a given sky position (), the probability that the observed counts are purely due to a random fluctuation of the background counts is given by a normalized incomplete gamma function (Weisskopf et al., 2007; Kashyap et al., 2010)
| (2) | |||||
| (3) |
One can repeat the calculation for every sky position () to generate the probability map.
In order to make a sky image in a conventional way where bright sources have larger values, one can simply use an inverse of this probability map, which is the number of trials required to generate the observed counts from a random fluctuation. We call this map of required random trial numbers as a ‘trial’ map and it represents a significance map of source detection. Hong et al. (2016) first applied this trial map-based approach to point source detection in X-ray images taken from NuSTAR, and in this paper we extend the approach to coded-aperture imaging. Since each pixel in a sky image of a coded-aperture telescope represents one trial of source search, if the value in a trial map greatly exceeds the total number of the pixels in the image, it indicates a high chance of a real source (or a systematic artifact). Detection threshold setting, therefore, is more straightforward in trial maps generated by coded-aperture imaging than those by focusing telescopes, where the threshold depends on the (potentially varying) size of the point-spread function relative to the image.
A source in the partially coded FoV in a sky image generated by Eq. 1 have a less signal than a source of the same strength in the fully coded FoV, thus in order to reflect the source signal properly, the image has to be renormalized by the partial coding fraction. On the other hand, such a normalization enhances the noise fluctuation in the partial coded FoV. When stacking multiple sky images generated by Eq. 1, they have to be weighted by the variance in order to account for the proper coding fraction, where the error due to improper handling of Poisson statistics can propagate and amplify. In the case of trial maps, they describe a chance of having a real source in any part of the FoV regardless of the coding fraction. For stacking multiple images, one simply accumulates the sky images of and , then re-apply Eq. 3 to get the stacked new trial map.333In order to ‘clean’ bright sources (i.e., reduce the coding noise associated with the bright sources), the sky images of all four quantities , , and have to be tracked. The cleaning procedure simply recalculates by treating the contribution of the bright sources as a part of background, and thus it does not involve any subtraction from .
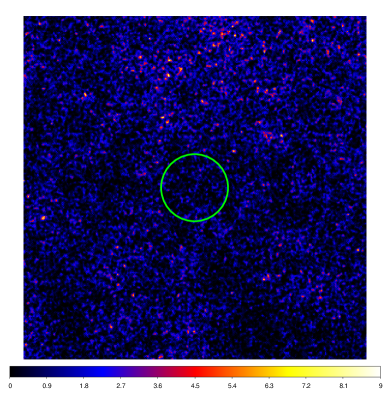
Figure 8 shows the trial maps of the same images in Figure 4. The images are color coded logarithmically with the trial numbers (10X). Each image has about 60k independent pixels, and the threshold for 0.1% false detection is about 7.8. The background treatment described in Section 3 reduces the large scale structures and lowered the noise fluctuation by about 100 in trial numbers, but the trial map on the right panel indicates there is some residual non-uniformity in the image, which is not apparent in Figure 4.
In terms of computational requirements, the total observed () and background counts () can be estimated through FFTs. The latter can be pre-calculated if the background model is known ahead and remains unchanged.
In coded-aperture imaging, source detection often relies on a large number of counts, but for high resolution imager aimed to detect fleeting signals from transient sources, the total number of counts can be relatively small, so that the suggested rigorous probabilistic approach of source search is more appropriate.
5. Conclusion and Future Work
In future, direct localization of transient sources like gamma-ray bursts without assistance of secondary instruments will enable a wide range of the time domain astrophysics. To achieve this, next generation wide-field hard X-ray telescopes should be capable of sub 2′ angular resolution. In high resolution coded-aperture telescopes, new challenges arise in handling non-uniformity in the detector system due to low count statistics per pixel. During a high altitude balloon flight in 2012, the ProtoEXIST2 telescope of 4.8′ resolution collected about 3 counts per hr in each detector pixel on average, which illustrates this new challenge. Dithering or continuous scan as shown in BATSS alleviates the effects of the systematics by automatically averaging out the non-uniformity even without special treatment but large scale variations still remain in their sky images, which can limit the detection and localization sensitivity.
We presented a method to improve the sensitivity of high resolution coded-aperture systems by self-correcting the non-uniform background of low statistics efficiently. Combining simulated sources with the real balloon flight data of the ProtoEXIST2 telescope, which exhibits pixel-dependent background variations, we demonstrated that the proposed techniques can reduce the large scale variation dramatically and improve the SNR by a few to 10% depending on the input SNR. We also proposed a new method to estimate detection significance using a Poisson statistics based probabilistic approach without relying on subtraction in background handling. We plan to apply these techniques to the Swift/BAT data to evaluate the improvements in a wide range of operating environments for further optimization.
6. Acknowledgment
This work was supported by NASA/APRA grant NNX14AD59G.
References
- Gehrels et al. (2004) Gehrels, N., Chincarini, G., Giommi, P., et al. 2004, ApJ, 611, 1005
- Winkler et al. (2003) Winkler, C., Courvoisier, T. J.-L., Di Cocco, G., et al. 2003, A&A, 411, L1
- Hong et al. (2013) Hong, J., Allen, B., Grindlay, J., et al. 2013, IEEE Transactions on Nuclear Science, 60, 4610
- Harrison et al. (2013) Harrison, F. A., Craig, W. W., Christensen, F. E., et al. 2013, ApJ, 770, 103
- Skinner (2008) Skinner, G. K. 2008, Appl. Opt., 47, 2739
- Krimm et al. (2013) Krimm, H. A., Holland, S. T., Corbet, R. H. D., et al. 2013, ApJS, 209, 14
- Grindlay & Hong (2004) Grindlay, J. E., & Hong, J. 2004, Proc. SPIE, 5168, 402
- Hong et al. (2016) Hong, J., Mori, K., Hailey, C. J., et al. 2016, ApJ, 825, 132
- Copete (2012) Copete, A. J. 2012, Ph.D. Thesis, Harvard Univ., 316C
- Weisskopf et al. (2007) Weisskopf, M. C., Wu, K., Trimble, V., et al. 2007, ApJ, 657, 1026
- Kashyap et al. (2010) Kashyap, V. L., van Dyk, D. A., Connors, A., et al. 2010, ApJ, 719, 900