Association of 3He-Rich Solar Energetic Particles with Large-Scale Coronal Waves
Abstract
Small 3He-rich solar energetic particle (SEP) events have been commonly associated with extreme-ultraviolet (EUV) jets and narrow coronal mass ejections (CMEs) which are believed to be the signatures of magnetic reconnection involvingfield . The elemental and isotopic fractionation in these events are thought to be caused by processes confined to the flare sites. In this study we identify 32 3He-rich SEP events observed by the Advanced Composition Explorer near the Earth during the solar minimum period 2007–2010 and examine their solar sources with the high resolution Solar Terrestrial Relations Observatory (STEREO) EUV images. Leading the Earth, STEREO-A provided for the first time a direct view on 3He-rich flares, which are generally located on the Sun’s western hemisphere. Surprisingly, we find that about half of the 3He-rich SEP events in this survey are associated with large-scale EUV coronal waves. An examination of the wave front propagation, the source-flare distribution and the coronal magnetic field connections suggests that the EUV waves may affect the injection of 3He-rich SEPs into interplanetary space.
1 Introduction
Solar energetic particles (SEPs) can be accelerated either at coronal mass ejection (CME) driven shocks in gradual large SEP (LSEP) events or by processes related to magnetic reconnection at the flare sites in impulsive or 3He-rich SEP events (see review by Reames, 2013). Anomalous elemental composition in impulsive SEP events, extremely different from coronal abundances, has not been so far sufficiently explained (see Kocharov & Kocharov, 1984; Mason, 2007; Reames, 2015, for a review). In addition to a preferential acceleration by resonant interactions with MHD turbulence (e.g., Miller, 1998; Liu et al., 2006), other non-wave mechanisms have been proposed (e.g., Drake & Swisdak, 2012). In contrast to LSEP events, 3He-rich SEP events have lower ion intensities and energies, shorter durations and are associated with minor X-ray flares. Though they are numerous these features make them a less explored phenomenon.
Solar sources of 3He-rich SEPs have been often associated with coronal X-ray and EUV jets (e.g., Nitta et al., 2006, 2008; Wang et al., 2006; Bučík et al., 2014; Chen et al., 2015; Innes et al., 2016) which sometimes show a high altitude extension in jet-like CMEs (Kahler et al., 2001; Wang et al., 2006, 2012). Jets have been considered to be a signature of magnetic reconnection involving open field (e.g., Shibata et al., 1992). Predominantly narrow CMEs in these events have been also reported by Nitta et al. (2006). Recently, new observations from the Solar Dynamics Observatory (SDO) and Solar Terrestrial Relations Observatory (STEREO) have revealed a few 3He-rich SEP events associated with large-scale coronal EUV waves (Nitta et al., 2015; Bučík et al., 2015). This finding appears to be surprising in view of previous associations with narrow flare signatures.
Four of the reported 3He-rich SEP events with a coronal wave were accompanied by slow (300 km s-1) CMEs (Nitta et al., 2015) but two others were without a CME (Bučík et al., 2015). Coronal waves have been so far reported in LSEP events in association with fast and wide CMEs (e.g., Torsti et al., 1999; Lario et al., 2014; Miteva et al., 2014). However, there is still some controversy on the nature of coronal waves (see Patsourakos & Vourlidas, 2012; Liu & Ofman, 2014; Warmuth, 2015, and references therein). Presently, it is believed they are true magnetosonic waves and not just coronal magnetic field reconfigurations induced by a CME. Indeed, a recent report on EUV waves associated with X-ray flares alone (Nitta et al., 2013) appears to be consistent with the true wave concept.
The aim of this paper is to examine how common an association of 3He-rich SEPs with large-scale coronal waves is without setting any restriction criteria on the selection of the events. For this purpose we collect 32 3He-rich SEP events within the solar activity minimum period 2007–2010 to avoid source confusion in the more active periods. We identify solar sources of 3He-rich SEPs using new viewing perspectives from angularly separated spacecraft. These observations are presented in Section 2. In Section 3 we discuss possible implications of associated coronal waves on energetic ion characteristics in these events.
2 Results
2.1 3He-rich SEP events
Table 1 lists 32 3He-rich SEP events observed near the Earth at the L1 point with the Advanced Composition Explorer (ACE) between January 2007 and December 2010. We have selected all detectable events by examining He mass spectrograms of low-energy (0.2–1 MeV nucleon-1) ions from the Ultra Low Energy Isotope Spectrometer (ULEIS; Mason et al., 1998) and of high-energy (4.5–16.3 MeV nucleon-1) ions from the Solar Isotope Spectrometer (SIS; Stone et al., 1998) including the events near the detection threshold reported in the previous studies (Mason et al., 2009; Wiedenbeck et al., 2013). The ULEIS is a high-resolution time-of-flight mass spectrometer which measures ions from He to Ni in the energy range from 20 keV nucleon-1 to several MeV nucleon-1. The SIS is a versus residual energy telescope measuring He to Zn nuclei from 10 to 100 MeV nucleon-1 range. Only 1/4 of all examined events showed a clear signature of 3He at the highest examined energy range of 7.6–16.3 MeV nucleon-1. The high-energy 3He-rich SEPs are relatively rare events (Leske et al., 2003) and it is not clear if they require an additional acceleration process (Wiedenbeck et al., 2010a).
| Number | Start date | Daysaaat 200–400 keV nuc.-1 but event 3 from Ref. (2); event 11 at 4.5–7.6 MeV nuc.-1; events 17, 27 at 7.6–16.3 MeV nuc.-1; 19, 21, 22, 24, 31 at 0.4–1 MeV nuc.-1 | 3He fluencebbat 320–450 keV nuc.-1; fluence unit – particles (cm2 sr MeV/nuc.)-1; values in events 3, 4 from Ref. (2); event 11 not seen at the ULEIS energies - an upper limit for 3He/4He at the lowest SIS energy bin (5.2 MeV nuc.-1) is 0.350.16 | 3He/4Hebbat 320–450 keV nuc.-1; fluence unit – particles (cm2 sr MeV/nuc.)-1; values in events 3, 4 from Ref. (2); event 11 not seen at the ULEIS energies - an upper limit for 3He/4He at the lowest SIS energy bin (5.2 MeV nuc.-1) is 0.350.16 | Fe/Obbat 320–450 keV nuc.-1; fluence unit – particles (cm2 sr MeV/nuc.)-1; values in events 3, 4 from Ref. (2); event 11 not seen at the ULEIS energies - an upper limit for 3He/4He at the lowest SIS energy bin (5.2 MeV nuc.-1) is 0.350.16 | IMF | References | |
|---|---|---|---|---|---|---|---|---|
| (103) | polaritycc() negative and (+) positive polarity with IMF oriented toward and away from the Sun respectively | |||||||
| 1 | 2007 Jan 14 | 14.25 – 14.54 | 1.220.29 | 0.140.04 | 0.700.36 | no | () | |
| 2 | 2007 Jan 24 | 24.50 – 27.50 | 7.510.73 | 0.120.01 | 1.040.11 | yes | (+) | 1 |
| 3 | 2007 May 23 | 143.31 – 143.92 | 2.901.40 | 0.0110.006 | 2.301.00 | no | (+) | 2 |
| 4 | 2008 Feb 4 | 35.00 – 37.50 | 7.202.30 | 0.160.05 | 1 | no | () | 2 |
| 5 | 2008 Jun 16 | 168.90 – 170.00 | 1.150.32 | 0.120.03 | ? | () | 2 | |
| 6 | 2008 Nov 4 | 309.50 – 312.71 | 1.440.37 | 0.050.01 | 1.450.44 | yes | () | 1, 2, 3 |
| 7 | 2009 Apr 29 | 119.90 – 121.20 | 0.960.32 | 0.900.41 | ? | (+) | 3 | |
| 8 | 2009 May 1 | 121.70 – 122.50 | 0.640.26 | 1.500.97 | ? | () | ||
| 9 | 2009 Jul 5 | 186.70 – 189.50 | 0.330.19 | 0.330.22 | ? | () | 3 | |
| 10 | 2009 Oct 6 | 279.88 – 281.75 | 1.640.44 | 1.400.58 | ? | () | ||
| 11 | 2009 Nov 3 | 307.25 – 308.75 | ? | () | 3 | |||
| 12 | 2009 Dec 22 | 356.88 – 359.50 | 1.550.43 | 0.230.07 | 1.160.62 | no | (+) | |
| 13 | 2010 Jan 16 | 16.29 – 18.00 | 4.290.72 | 1.640.44 | yes | () | ||
| 14 | 2010 Jan 27 | 27.13 – 28.63 | 5.720.83 | 0.130.02 | 0.580.10 | yes | (+) | 4 |
| 15 | 2010 Jan 31 | 31.00 – 32.00 | 0.950.34 | 4.003.16 | ? | () | ||
| 16 | 2010 Feb 8 | 39.66 – 42.50 | 21.51.6 | 0.210.02 | 0.890.16 | no | () | 3 |
| 17 | 2010 Feb 12 | 43.75 – 45.33 | 7.280.94 | 0.0180.002 | 0.350.04 | no | () | 3 |
| 18 | 2010 Feb 19 | 50.08 – 50.33 | 7.870.98 | 0.520.08 | 1.160.24 | yes | (+) | 3 |
| 19 | 2010 Mar 4 | 63.79 – 64.50 | 0.950.34 | 0.0330.012 | 0.730.24 | yes | () | |
| 20 | 2010 Mar 19 | 78.58 – 79.58 | 7.030.92 | 0.370.06 | 1.320.38 | yes | (+) | |
| 21 | 2010 Jun 12 | 163.75 – 166.13 | 22.91.7 | 0.0230.002 | 0.940.08 | no | () | 3 |
| 22 | 2010 Sep 1 | 244.25 – 244.83 | 1.310.40 | 0.0210.006 | 0.750.21 | no | () | 3 |
| 23 | 2010 Sep 2 | 245.75 – 247.08 | 7.760.96 | 3.100.78 | 0.870.67 | no | () | |
| 24 | 2010 Sep 4 | 247.63 – 248.88 | 9.951.09 | 0.0860.010 | 0.240.04 | yes | () | |
| 25 | 2010 Sep 17 | 260.50 – 261.75 | 0.480.24 | 0.0340.017 | no | () | ||
| 26 | 2010 Oct 17 | 290.83 – 292.75 | 21.01.6 | 0.460.04 | 1.270.23 | yes | (+) | 3, 5, 6 |
| 27 | 2010 Oct 19 | 292.33 – 293.00 | 14.41.3 | 1.530.22 | 1.930.43 | yes | () | 3, 5 |
| 28 | 2010 Nov 2 | 306.75 – 308.75 | 23.51.7 | 0.940.09 | 0.910.32 | yes | (+) | 3, 5 |
| 29 | 2010 Nov 14 | 318.38 – 321.46 | 26.31.8 | 0.200.01 | 1.200.18 | no | () | 3, 5, 6, 7 |
| 30 | 2010 Nov 17 | 321.67 – 322.42 | 32.82.0 | 2.750.33 | 1.250.34 | yes | () | 5, 6, 7 |
| 31 | 2010 Nov 29 | 333.50 – 334.25 | 3.810.67 | 0.910.22 | ? | (+) | ||
| 32 | 2010 Dec 10 | 344.71 – 346.25 | 1.550.43 | 0.590.21 | ? | () |
Note. —
Column 1 in Table 2.1 indicates the event number, column 2 the particle event start date. Column 3 shows the approximate 3He-rich interval at 200–400 keV nucleon-1 (in decimal days) where the ion travel time from the Sun is 7 hr without scattering. Sometimes we have used higher energy ranges to define the 3He period (see Table 2.1) where the event was clearer. Columns 4, 5, 6 provide 3He fluence, 3He/4He and Fe/O abundance ratios, respectively, at 320–452 keV nucleon-1 integrated over the period shown in column 3. Column 8 gives the interplanetary magnetic field (IMF) polarity during the event, determined from the observed IMF (Smith et al., 1998) vector orientation relative to the nominal Parker magnetic field. The Parker angle was calculated using the observed solar wind speed (McComas et al., 1998). The last column indicates references to previous studies of these events. Previously 19 events from this survey were reported but the solar source flare was identified only for 9 events. In 2007 and 2008 we found only 3 events per year. An increase of sunspot numbers led to the 6 events in 2009. In 2010 we identified 20 events.
Four of the 3He-rich SEP events in this survey (numbers 12, 17, 21, 22) were accompanied by 25 MeV (SOHO/ERNE; Torsti et al., 1995) lower-intensity solar proton events (Richardson et al., 2014). These events probably include a mix of both 3He-rich and LSEP components. Such events with both flare and gradual components have been previously reported (e.g., Cohen et al., 1999; Mason et al., 1999; Cane et al., 2003). Two of these events (12, 21) have type II radio bursts in the Solar Radio Bursts Report (ftp://ftp.ngdc.noaa.gov/STP/space-weather/solar-data /solar-features/solar-radio/radio-bursts). The source for event 22 was limb occulted. The 386 keV nucleon-1 3He/4He ratio attains the lowest values in these events, 2% in three events (17, 21, 22) but in event 12 the ratio reached 23%. The events 17 and 22 are more enhanced at high energies than low. The 10.5 MeV nucleon-1 3He/4He ratio is and for events 17 and 22, respectively. The average 386 keV nucleon-1 Fe/O ratio in these four events is 80%, typical of 3He-rich SEPs. All these events are associated with a coronal EUV wave (see Section 2.2). Note that another event (number 16) occurred during the decay phase of a gradual SEP event. Half of the four 3He-rich SEP events (3He/4He 8% and 36% in 0.5–2.0 MeV nucleon-1) with coronal waves reported by Nitta et al. (2015) were also accompanied by weak high-energy solar proton events.
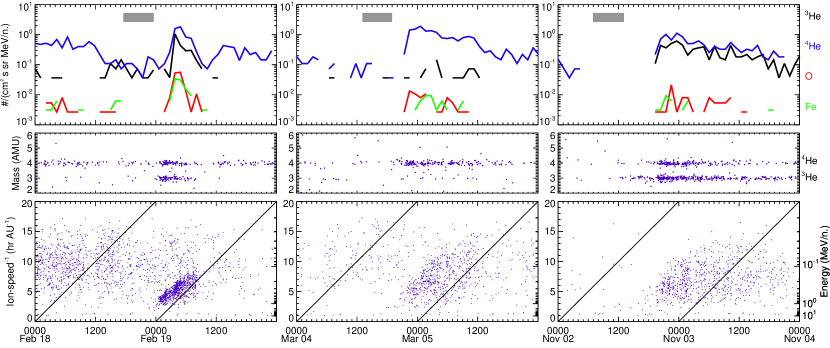
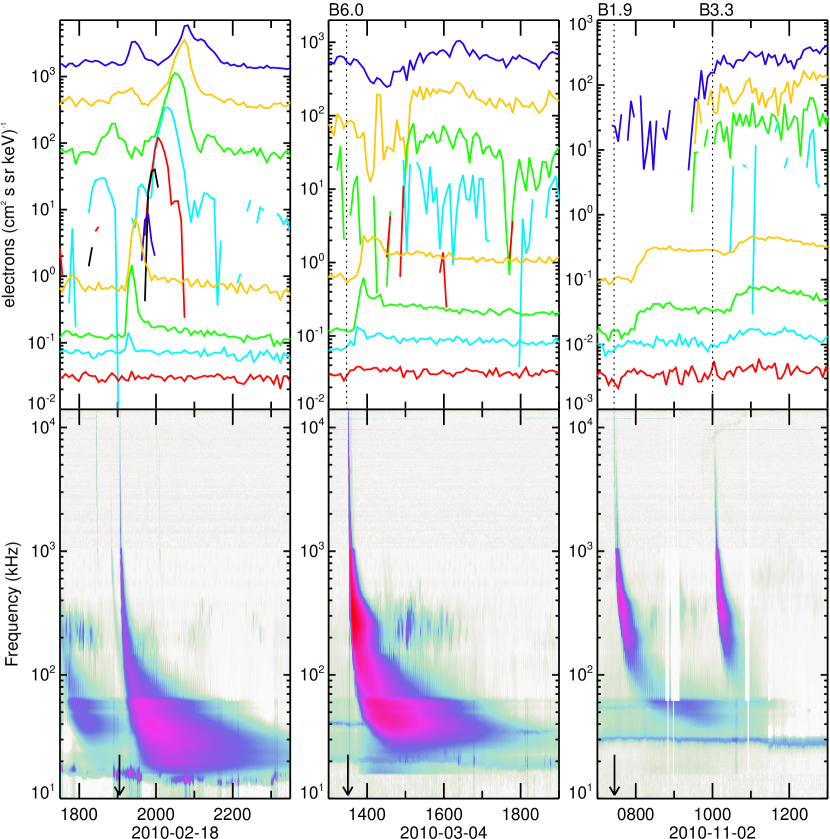
Figure 1 shows three examples of 3He-rich SEP events associated with a coronal EUV wave: the 2010 February 19, March 4 and November 2 events. The top panels in Figure 1 present 4He, 3He, O, Fe intensities at 230–320 keV nucleon-1, the middle panels present He mass spectrograms at 0.4–10 MeV nucleon-1 and the bottom the inverted ion-speed spectrograms showing high energy ions arriving earlier than low energy ones. The corresponding solar electron events and the related type III radio bursts are shown separately in Figure 2. The top panels in Figure 2 present electron intensities at different energy channels from Wind/3DP (Lin et al., 1995) and ACE/EPAM (Gold et al., 1998) instruments. The bottom panels are Wind/WAVES (Bougeret et al., 1995) radio spectrograms. Note that Wind was also at L1 location.
2.2 Solar sources
| Number | Flare | Type III | Electron eventbbenergy ranges from Wind/3DP (1.3–182 keV) and ACE/EPAM (45–235 keV); background from a preceding event at low (events 1, 11) and high (events 7, 23) energies | CMEccspeed (km s-1), width (∘) from SOHO/LASCO catalog (http://cdaw.gsfc.nasa.gov/CME_list) | L1 footpoint | PFSS | Connection | |||||||
|---|---|---|---|---|---|---|---|---|---|---|---|---|---|---|
| Class | Start | Location | NOAA AR | EUV typeaab: brightening, w: wave (direction of propagation), j: jet | start | 3DP | EPAM | Speed | Width | Longitude | Timeddwhen the wave front intersects the L1 foot-point; for events 7, 9, 11, 17, 22, 31, 32 - when the wave front disappears | polarityeethe source surface altitude at 2.5 ; () negative, (+) positive polarity, (C) closed field | to ARffapproximate longitudinal separation between the L1 foot-point and open ecliptic field lines is indicated | |
| 1 | B2.6 | Jan 13 15:08 | S05W80 | 0933 | b | 15:12 | 45–134 | W60 | yes | |||||
| 2 | B5.1 | Jan 24 00:28 | S05W58 | 0939 | b | 00:29 | 1.3–13 | 45–134 | W58 | () | yes | |||
| 3 | B3.9 | May 22 14:30 | N03W38 | 0956 | w (S) | 14:24 | 1.3–19 | 45–74 | 544 | 108 | W53 | 14:22–14:32 | (C) | |
| 4 | A1.1 | Feb 4 13:35 | S11W24 | 0982 | b | W41 | () | yes | ||||||
| 5 | Jun 16 00:56 | S10W17 | 0998 | j | 00:55 | W37 | () | yes | ||||||
| 6 | C1.0 | Nov 4 03:17 | N37W46 | 1107 | w (NW) | 03:24 | 1.3–182 | 45–134 | 732 | 66 | W59 | 03:55–04:05 | () | yes |
| 7 | Apr 29 01:56 | N17W135 | w (E) | 01:55 | 1.3–2.8 | 239 | 44 | W75 | 02:45 | |||||
| 8 | B2.2 | May 1 08:54 | S09W85 | 1016 | w (S) | 08:57 | 1.3–182 | 45–134 | W76 | 09:05 | (C) | |||
| 9 | B3.6 | Jul 4 01:02 | S26E13 | 1024 | w (S) | 01:04 | W69 | 01:46 | (C) | |||||
| 10 | Oct 6 08:10 | S31W102 | 1026 | b | 08:15 | W63 | (+) | no (32∘) | ||||||
| 11 | Nov 3 03:30 | N12W130 | 1029 | w (SE) | 03:32 | 45–235 | W59 | 04:15 | () | no (33∘) | ||||
| 12 | C7.2 | Dec 22 04:50 | S27W46 | 1036 | w (NE) | 04:54 | 1.3–4.2 | 45–235 | 318 | 47 | W64 | 05:05 | (+) | yes (2∘) |
| 13 | Jan 15 23:35 | N26W47 | 1040 | j | W53 | () | yes | |||||||
| 14 | B3.2 | Jan 26 17:01 | N19W75 | 1042 | w (S) | 17:03 | 1.3–6.1 | 45–134 | W62 | 17:20 | (C) | |||
| 15 | Jan 30 13:55 | N22W90 | w | 219 | 47 | W63 | 14:25 | |||||||
| 16 | C7.7 | Feb 8 04:04 | N22W00 | 1045 | w (S) | 04:12 | 4.2–19 | 45–235 | W60 | 04:50 | () | no (17∘) | ||
| 17 | M8.3 | Feb 12 11:19 | N25E12 | 1046 | w (S) | 11:25 | 13–19 | 45–235 | 509 | 360 | W68 | 12:00 | (+) | no (55∘) |
| 18 | Feb 18 18:58 | S19W58 | 1047 | w (SE), b | 19:03 | 1.3–19 | 45–134 | 223 | 14 | W51 | 19:03 | (C) | ||
| 19 | B6.0 | Mar 4 13:28 | S17W60 | 1052 | w (NE) | 13:30 | 2.0–4.2 | 45–235 | 374 | 44 | W51 | 13:35 | (C) | |
| 20 | B1.4 | Mar 19 04:55 | N13W60 | 1054 | w (SW) | 04:49 | 1.3–19 | 45–134 | W56 | 04:55–04:58 | () | yes | ||
| 21 | M2.0 | Jun 12 00:30 | N23W50 | 1081 | w (SW) | 00:54 | 6.1–182 | 45–235 | 486 | 119 | W64 | 01:05 | () | yes |
| 22 | Aug 31 20:50 | S22W145 | 1100 | w (NE) | 20:50 | 1.3–182 | 45–235 | 1304 | 360 | W72 | 21:25 | (C) | ||
| 23 | Sep 2 10:48 | N24W62 | 1102 | j | 10:48 | 1.3–2.8 | W54 | () | yes | |||||
| 24 | B1.8 | Sep 4 07:51 | N23W85 | 1102 | b | 07:51 | 1.3–66 | 45–74 | W59 | () | no (20∘) | |||
| 25 | B5.7 | Sep 17 00:14 | S20W02 | 1106 | j | 00:16 | 40–182 | 45–74 | W49 | (+) | yes | |||
| 26 | C1.7 | Oct 17 08:52 | S18W32 | 1112 | w (NW) | 08:55 | 1.3–182 | 45–235 | 304 | 54 | W58 | 09:20 | (+) | yes |
| 27 | C1.3 | Oct 19 06:45 | S18W58 | 1112 | b | 06:48 | 2.0–182 | 45–134 | 385 | 77 | W57 | (+) | yes (8∘) | |
| 28 | B1.9 | Nov 2 07:26 | N19W90 | 1117 | w (SE) | 07:26 | 2.0–66 | 45 | 253 | 67 | W66 | 07:35 | () | yes (7∘) |
| 29 | C1.1 | Nov 13 23:50 | S23W28 | 1123 | b | 23:50 | 442 | 63 | W49 | () | yes | |||
| 30 | B3.4 | Nov 17 08:07 | S23W72 | 1123 | j | 08:08 | 1.3–182 | 45–134 | 639 | 41 | W47 | (+) | no (52∘) | |
| 31 | B2.4 | Nov 29 05:25 | N28E112 | 1131 | w (S) | 05:31 | 505 | 85 | W56 | 05:51 | ||||
| 32 | Dec 10 05:55 | N35W99 | w | 299 | 72 | W69 | 06:20 | |||||||
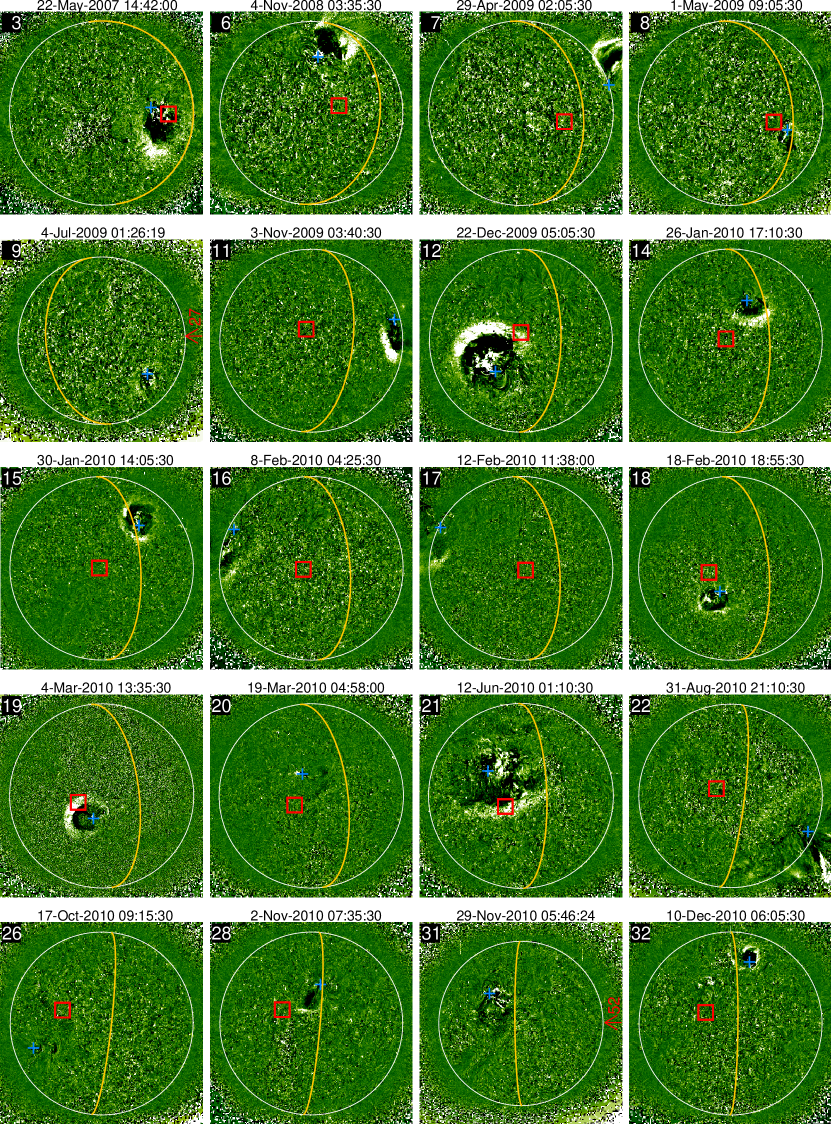
The solar sources for the investigated 3He-rich SEP events were identified on the basis of their high association with type III radio bursts which are excited by low-energy electrons (30 keV) streaming outward through interplanetary space (e.g., Reames & Stone, 1986; Krucker et al., 1999). The parent electrons are not always observed which could be an instrumental or magnetic connection issue. A similar identification approach has been used in previous studies (e.g., Nitta et al., 2006). We first determined the approximate ion injection time at the Sun. For the events with a velocity dispersive onset (12 of 32) we extrapolated backward in time using the inverse velocity-time spectrograms (e.g., Reames et al., 1985) and for the other events with unclear (9) or non-dispersive onset (11) we subtracted the interplanetary propagation time (without scattering) along the Parker spiral from the observed start time of the event. The uncertainty in the 1 MeV nucleon-1 ion injection time of 3He-rich SEP events has been estimated at 45 minutes using the velocity dispersion technique (Mason et al., 2000). The fitting of the heavy ion count-rate time profiles at several low-energy bins between 0.097 and 1.67 MeV nucleon-1 in ten good electron/3He-rich SEP events provides the average uncertainty of 37 minutes (Wang et al., 2016). In the next step we inspected the Wind/WAVES dynamic radio spectra for type III radio emissions. The frequency range of the WAVES instrument covers emissions generated from about 2 to 1 AU. Then we localized the solar sources by examining high cadence (minimum 2.5-min resolution) full-disk STEREO EUV images from the SECCHI/EUVI instrument (Howard et al., 2008) for flaring at the time of the type III burst. The EUVI observes the Sun in 20482048 1.6 arc second pixels in a circular field of view which extends to 1.7 . During the very quiet period in 2007–2009 the source identification, even for the threshold events, was quite reliable as there was no simultaneous activity on the solar disk. In 2010, when the solar activity increased and the state of the corona became more complex, we benefited from the angular separation between the two STEREOs observing almost the full Sun (see Appendix for the concrete examples). STEREO-A is leading and STEREO-B trailing the Earth on their heliocentric orbits at 1 AU. Two more radio receivers on the two STEREOs (Bougeret et al., 2008) provided additional clues to the source location.
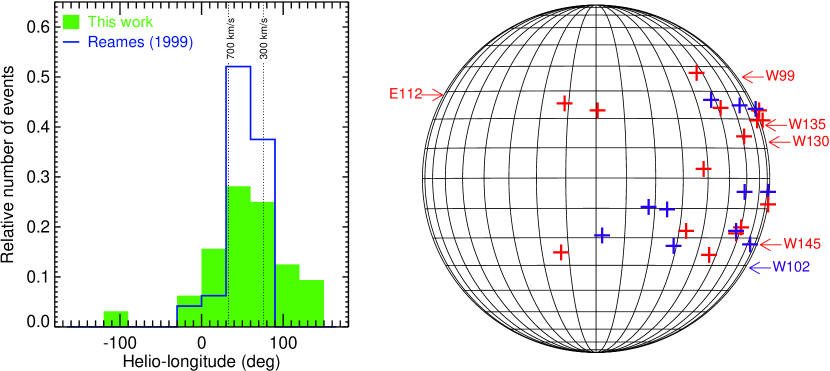
Table 2 presents the solar source properties for the 3He-rich SEP events in this survey. Column 1 gives the event number. Column 2 indicates the GOES X-ray flare class and column 3 the flare start time from the Solar Event List (ftp://ftp.swpc.noaa.gov/pub/warehouse) but inputs in event 4 are from Mason et al. (2009). If the X-ray flare is not reported then the time of the STEREO/EUVI flare is shown. Note that flares in events 2–6, 8, 12, 16, 17, 19, 21 are included in the STEREO/SECCHI EUVI catalog (http://secchi.lmsal.com/EUVI/MOVIES_FLARES _CMES) reporting flares in 2006 December–2010 October. Column 4 gives the flare location from the Earth view, column 5 the NOAA active region (AR) number, column 6 the EUV flare type (brightening, jet or wave). For events 3, 6, 12, 14 and 21 the EUV wave speed has been reported and ranges between 300 km s-1 and 500 km s-1(Warmuth & Mann, 2011; Nitta et al., 2013, 2014; Bučík et al., 2015). Column 7 gives the type III radio burst start time as observed by Wind/WAVES, columns 8 and 9 the energy ranges of the solar electron event from the Wind/3DP (column 8) and ACE/EPAM (column 9) telescopes. The high-energy (40–182 keV) electron observations from the Wind/3DP/SST are not available for events 1–3, 10–20. Columns 10 and 11 indicate the CME speed and width, respectively, obtained from the SOHO LASCO CME catalog. In events 9, 11, 16, 17 a CME is not reported but the coronagraph COR-1 on STEREO observed an ejection (in events 11 and 17 only faint outflow). The SOHO LASCO C2 and STEREO COR-1 cover 1.5–6 and 1.4–4 , respectively. Column 12 gives the IMF foot-point longitude at a distance of 2.5 from the Sun center, connecting L1 at the flare onset time. The L1 foot-point longitude was determined from the Parker spiral angle using the measured solar wind speed. Column 13 gives the time when the wave front crossed the foot-point location or disappeared. Column 14 indicates the magnetic field polarity of the open coronal field in the source AR. The polarity is not determined for four ARs (events 7, 15, 31, 32) which were not visible or present in the magnetograms. The AR in events 7, 15 was just emerging near the west limb and in event 31 it was behind the east limb. The last column indicates whether the L1 foot-point is connected to the source AR via coronal field. The coronal field is computed with a potential-field source-surface (PFSS) model (Schatten et al., 1969) using the Solar Soft PFSS package (http://www.lmsal.com/~derosa/pfsspack). The source surface which separates open and closed fields was set at 2.5 from the Sun center (but see Section 2.4). The appendix provides further features of the investigated events, particularly those with multiple ion injections and where the determination of a solar source was less straightforward.
Figure 3, left panel, shows distributions of flare (X-ray or EUV) longitudes for the events in this survey and from an earlier study (Reames, 1999) where source flares were determined from single spacecraft observations. The Gaussian fits to these distributions provide standard deviations of 42∘ and 16∘, respectively. As probably expected, with STEREO-A we are able to locate 3He-rich SEP sources behind the west solar limb. The right panel shows the flare distribution on the Sun’s disk from the Earth view. Interestingly, almost all sources behind the limb (5 of 6) are associated with a coronal wave. The one with a longitude W145 was related to a high-energy solar proton event.
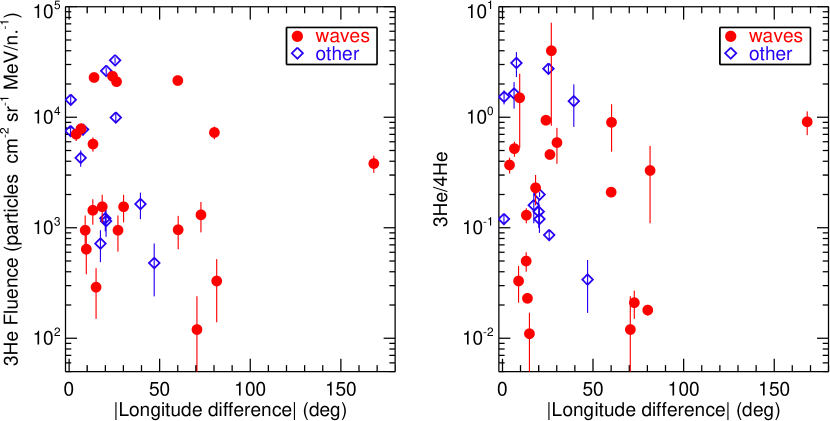
Figure 4 shows 3He fluence (left panel) and 3He/4He ratio (right panel) versus longitudinal distance of L1 foot-point to the source flare. We can see that neither fluence nor ratio is obviously organised by this distance. These scatter plots show that source flares separated by 50∘ from a nominal connection are all wave associated (two were with LSEP component). The median of 3He fluences in events associated with a coronal wave is slightly lower (a factor of 3) compared to the events with no waves. Right panel of Figure 4 reveals that the 3He/4He ratio is more scattered in the events with waves. Specifically, the events with lower ratios are those with a coronal wave but note that in three of the seven events with 3He/4He 0.05 a high-energy solar protons were detected. The 3He/4He (320–450 keV nucleon-1) median values are similar for both sets of events with (3He/4He0.3) or without (3He/4He0.2) coronal waves.
2.3 Coronal waves
Figure 5 shows the 3He-rich SEP event sources associated with coronal waves in the STEREO 195 Å EUV running differences images of the whole solar disk. The 195 Å channel observes emissions from a bright Fe XII line formed at 1.6 MK and a Fe XXIV line formed at 20 MK. The waves are visible as moving bright fronts of increased EUV emission followed by a dark area of decreased emission. The waves were poorly seen in the 171 Å EUV channel which however had a higher temporal cadence (2.5 minutes) during the first months of the STEREO mission. The images (mostly from STEREO-A) are shown at times, usually a few minutes after the X-ray flare, when the coronal waves were well visible. The waves associated with 3He-rich SEPs in events 14 and 28 have been included in recent studies (Nitta et al., 2015; Bučík et al., 2015). The most spatially extended wave fronts were seen in the 3He-rich events with high-energy solar proton population (12, 21, 22). The bright fronts were observed in the 2008 November 4, 2009 November 3, 2010 January 27 and 2010 March 4 3He-rich events. It has been noted that bright and sharp fronts may indicate shocks (e.g., Biesecker et al., 2002) which may be formed in the early stages after the wave expulsion (e.g., Warmuth & Mann, 2011). The type II radio bursts, a coronal shock signature, are reported for three events (3, 12, 21). Two events (2010 March 19, 2010 October 17) show no clear waves but the motions of a dimming front can be seen in the animations. It might be that with 5-min resolution images we miss brighter wave fronts in these events. The wave fronts in the events of 2009 May 1 and 2009 July 5 are smaller in size and less bright. We observe that several wave-associated events (e.g., 7, 14, 19, 20) started with a jet. The animations, shown in Figure 5 for faint wave events, contain only a few frames to demonstrate the wave front motions. In the 2009 April 29 and May 1 events we have also limited EUV data coverage.
The analysis of sequences of EUV difference images showed that the wave fronts in seven 3He-rich SEP events propagated toward the L1 foot-point position but faded before crossing that point. In the following four events, 2009 April 29 , 2009 November 3 , 2010 February 12 and 2010 September 1 , the waves disappear 35–50 minutes after the type III radio burst onsets. It may be only an instrument resolution issue that they are not seen crossing the foot-point. The remaining three events, 2009 July 5 , 2010 November 29 and 2010 December 10 , do not show significant lateral expansion of the associated waves.In all other 13 3He-rich events the waves passed the L1 foot-point (see Table 2, Column 13). For a quite remote source AR in the 2008 November 4 event the west flank of a dim wave front passed by the L1 foot-point at 04 UT (35 min after type III burst). In the 2010 January 31 event at 14:25 UT and in the 2010 February 8 event at 04:50 UT (38 min after type III emission). In the remaining 10 events delays were shorter, mostly 5–15 minutes which is within the ion injection time uncertainties. Note that all these events with larger wave front delays are too weak for performing any reliable timing analysis. Several previous works reported delayed ion injection by about 1 hr relative to the solar electrons in some 3He-rich SEP events (e.g., Reames et al., 1985; Wang et al., 2016). This may be consistent with the above mentioned later wave front arrivals at the L1 foot-point.
2.4 Magnetic connection
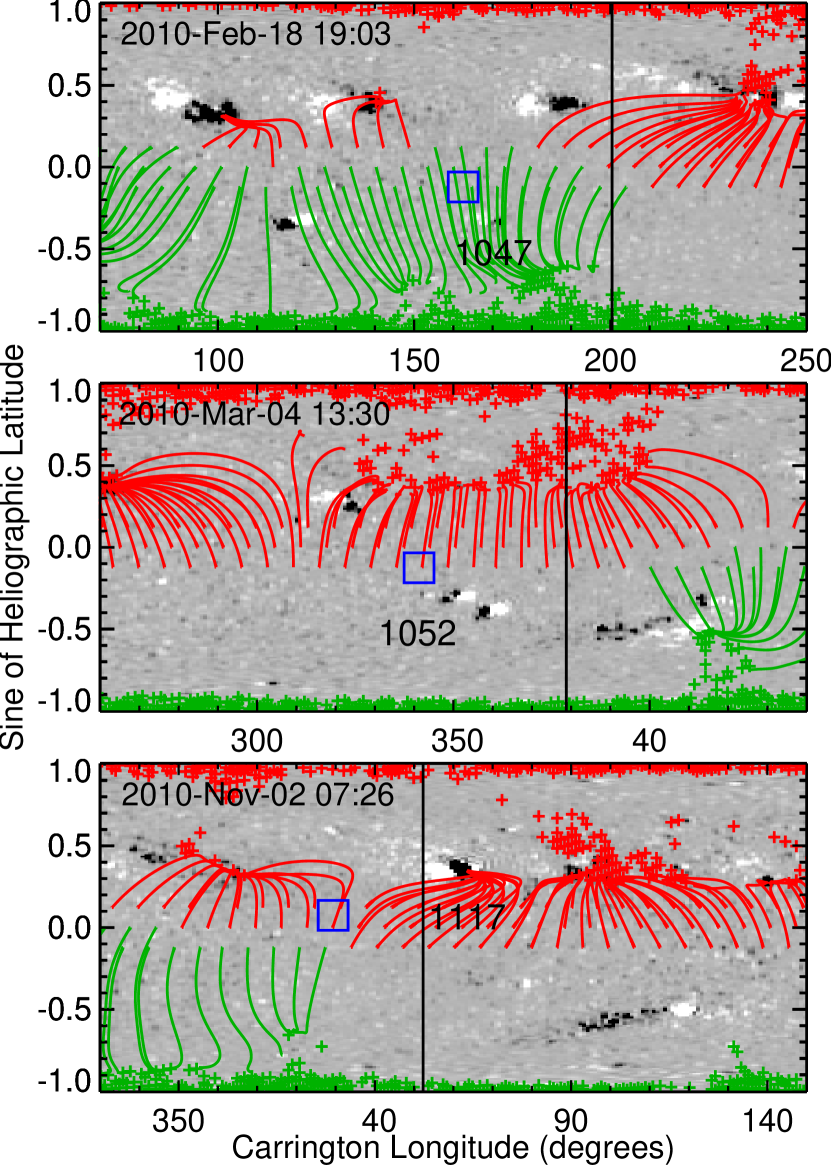
Figure 6 shows photospheric magnetic field maps with the PFSS model coronal field (with source surface at 2.5 ) for the wave-associated events (18, 19, 28) from Figure 1. The source ARs, marked by NOAA number, show no open field in the February 19 and March 4 events. As seen in the magnetograms these two ARs are quite faint, having small size and no particularly strong magnetic fields. One region (AR1047) is not well seen behind the set of open field lines emanating from the south-polar region. A further common feature of these two events is a close proximity of the L1 foot-point to the source AR . The polarity of the open fieldfor the November 2 event is inconsistent with the in-situ polarity. Note that in this case the magnetic field in the AR located close to the solar limb is not well observed.
Tracing the magnetic field through interplanetary space and the corona (e.g., Neugebauer et al., 1998), from L1 to its origin at the Sun, was performed for almost all events in this study. For events 7, 15, 31, 32 where the associated ARs are not visible in the magnetograms the coronal field could not be extrapolated.
We find the source ARs in seven events (3, 8, 9, 14, 18, 19, 22) showing no-open field configuration according to the PFSS model. Interestingly, all these events were associated with an EUV wave . By decreasing the source surface altitude to 1.9 the AR in the two events (14, 18) already showed open field (consistent with the in-situ polarity) connected to the L1 foot-point in event 18. Note that in some events the associated AR was in unobserved (event 22) or not well observed (8, 14) areas behind or near the west limb, where the magnetograms are based on flux transport models.
The source ARs in another seven events (2, 10, 17, 20, 27, 28, 30) show open to ecliptic coronal field with polarity inconsistent with the in-situ polarity. The events 17, 20, 28 were associated with an EUV wave that could distribute particles on the field with opposite polarity. Note that the source ARs in events 10 and 28 were in unobserved areas, near the west solar limb (at W102 and W90, respectively). The L1 (or ACE) foot-point in the events 2, 20, 27, 28 is connected to the source AR via coronal field with the polarity different from the in-situ. The polarity would be consistent if source surface is lowered to 1.9 for events 27 and 30. Then the L1 foot-point shows connection in event 27 and it is within 20∘ of longitude in event 30.
The ACE foot-point at the source surface was directly connected via coronal field (consistent with IMF) to the associated AR in ten events (1, 4, 5, 6, 13, 21, 23, 29). In three other events (11, 16, 24) the ACE foot-point was within 33∘, 17∘ and 20∘ of longitude from the coronal field connecting the source AR. Two of them (11, 16) were associated with an EUV wave . The source AR in event 25 shows open to ecliptic field lines with both polarities, where the ACE foot-point is connected via the positive polarity field and it is 40∘ of longitude from the negative polarity field lines.
3 Discussion and conclusion
We collected 32 3He-rich SEP events observed by ACE at L1 during the solar minimum period 2007–2010. This extended period of low solar activity provided favorable conditions for the identification of 3He-rich solar sources characterized by faint flare signatures. We include in this study also weak events with 3He intensity close to the detection threshold. We examined the solar sources with STEREO EUV imaging observations. At the beginning of 2007 the STEREO-A was near the Earth while at the end of the investigated period the angular separation extended to 90∘ from the Earth-Sun line allowing for the first time a direct view of the near west solar limb SEP sources.
Surprisingly, we find that more than half of the events of this survey (20 of 32) are clearly associated with large-scale coronal waves. The finding remains unchanged (16 of 28) after excluding the events with a high-energy solar proton component. Other events, not counted in this number, like the 2008 June 16 and 2010 November 14 events, might also have secondary ion injections related to the wave expulsion (see Appendix). The EUV wave fronts passed by or showed close approach the L1 magnetic foot-point in several (13–17) investigated events. However, this occurred either too fast after the type III radio burst onset or the events were too weak to distinguish between the flare and the potential wave-front ion injections. At least 10 events of this study have been associated with EUV jets including the wave events starting as a jet. Some events classified as having a brightening might have shown a narrow ejection from a different observing angle. Several 3He-rich events in the investigated period were reported in previous surveys (see references in Table 2.1). Mason et al. (2009) focused on solar activity minimum conditions associated with acceleration of 3He-rich SEPs during the period March 2007–December 2008, Wiedenbeck et al. (2013) on 3He-rich SEPs with wide longitudinal spread observed on multiple spacecraft between January 2007 and January 2011, and Nitta et al. (2015) on solar source characteristics derived from high resolution EUV images on SDO in the period May 2010–May 2014.
The present study shows a quite broad source flare longitude distribution in the 3He-rich SEP events where the most remote locations were associated with EUV waves. It has been noted that the connection to a distant source can not be sufficiently explained by a divergence of the coronal field lines below the source surface (Wiedenbeck et al., 2013). The magnetic connection controlled by large scale EUV waves in the corona has been discussed in several LSEP events (e.g., Torsti et al., 1999; Krucker et al., 1999; Malandraki et al., 2009; Rouillard et al., 2012; Nitta, 2012; Park et al., 2013; Richardson et al., 2014) and recently suggested as a possible mechanism also for 3He-rich SEPs (Nitta et al., 2015). The PFSS model has been considered to be adequate for the extrapolation of global magnetic fields in the corona. For our 12 3He-rich SEP events with jet/brightening the magnetic connection to the source AR is found in 9 cases (events 1, 2, 4, 5, 13, 23, 25, 27, 29) while for 16 events with a coronal wave only in 6 cases (6, 12, 20, 21, 26, 28). In addition none of the events with jets show closed model field but all cases with a closed configuration are found for the events with EUV waves. This suggests that in some 3He-rich SEP events the ion injection may be instigated by EUV wave expulsions.
We found that 9 events with a wide longitudinal spread of 3He-rich SEPs are associated with large-scale coronal waves.
In summary, the multi-spacecraft EUV imaging and radio observations on angularly separated STEREOs provided the most reliable identification of 3He-rich SEP sources as we have ever had. This study reveals quite common (60%) association of 3He-rich SEPs with large-scale coronal EUV waves. While in LSEP events the presence of significant CMEs expanding in all directions can mimic the role of EUV waves, the relation with energetic ions can be better seen in 3He-rich SEP events which are often found without a CME or accompanied by weak coronal outflows. Note that half of the EUV wave events in this survey are accompanied by slow CMEs (300 km s-1) or by no CME at all.
2007 January 24 event
This multiday (3 days) event was associated with a B5.1 flare (January 24 00:28 UT) from AR0939 (see Table 2). The same region produced 5 hrs later a B6.8 flare (05:13 UT), a type III radio burst (05:15 UT), and an electron event but no obvious new 3He increase. This later flare was associated with a CME (67∘ wide; 295 km s-1). The STEREO SECCHI EUVI catalog reports a jet-like ejection. The candidate B5.1 flare was shortly preceded by a B1.2 flare (January 23 23:58 UT), a type III radio burst and a jet (in EUVI catalog) from the same AR.
2007 May 23 event
The same AR (N03W53) launched later another EUV wave (in EUVI catalog; Nitta et al., 2014) in association with a B5.3 flare (May 23 07:15 UT), type III (07:17 UT) and type II (07:22 UT) radio bursts, a CME (679 km s-1, 90∘ wide) and a solar electron event. The high-energy solar proton event has been also reported (Richardson et al., 2014).
2008 February 4 event
This weak event, reported in an earlier survey (Mason et al., 2009), has not been associated with a particular type III radio burst. The type III bursts that occurred closest in time to the SEP event were produced by the source AR (W02) on February 3 (00:35, 03:23 UT), less than one day before the start of the event. These were accompanied by jets but no electron events or X-ray flares. Though one day is certainly a long time for SEPs to take to arrive at L1, the events near the detection threshold may only show peak intensities and not the event onset or its early rising phase.
2008 June 16 event
There are two possible candidate flares for this weak event: 1) a brightening in the source AR at 05:25 UT (see EUVI catalog) with a faint wave-like motion accompanied by a weak type III burst (barely visible and only below 0.5 MHz); the COR1 CME catalog (http://cor1.gsfc.nasa.gov/catalog) reports narrow ejection seen by STEREO-B; 2) a quite intense type III burst at 00:55 UT, 20 hrs before the event appearance, with a jet-like ejection (Table 2). Also in this weak event the observed start of 3He period may already correspond to the peak intensities.
2008 November 4 event
The source AR (N35W75) produced another strong type III burst and an A9.3 flare (included in EUVI catalog) on November 6 at 11:19 UT with a narrow (29∘) CME (487 km s-1) but no electron event was observed. Whether this flare provided 3He-rich SEPs to the end of this multiday period is not clear.
2009 April 29 event
The only active region (AR1016) on the solar disk seen from the two STEREOs (angularly separated by 95∘) appears to not be the event source. The type III radio burst preceding the event was stronger (over the whole frequency range) on STEREO-A than on Wind suggesting a more westward origin. In addition, at the time of the type III radio burst the AR1016 (S08W53) showed only a weak brightening. Simultaneously STEREO-A/EUVI observed a huge eruption behind the west solar limb that was most likely related to this event (see Table 2).
2009 July 5 event
The event was observed on STEREO-B and at the threshold level on ACE (Wiedenbeck et al., 2013). The solar electron event was only observed on STB (3.6–41 keV) with the STE instrument (Lin et al., 2008). An association with the solar source is straightforward as there was only one AR on the solar disk as seen from the two separated STEREOs.
2010 January 16 event
Though there was only one AR (AR1040) on the solar disk as observed from the two widely separated (134∘) STEREOs the source identification is not obvious. Since the event started at the beginning of January 16, the ion injection would be expected around the end of previous day. However, only one (and too late for the event onset) type III radio burst (January 16 05:41 UT) was observed within the two day interval January 15 00:00 UT–January 17 00:00 UT. This originated in AR1040 and was accompanied by a jet-like emission. On January 15 there was little activity seen on the solar disk but a jet in AR1040 at 23:35 UT would be a candidate source for this event. Though the source flare for the event can not be unambiguously determined there were nothing like EUV waves seen on the solar disk.
2010 January 31 event
The start time of 3He period of this weak event implies an ion injection before 16 UT on January 30. On that day the Wind/WAVES data show three quite weak type III radio bursts: the burst at 10:47 UT from the region behind the west limb in the STEREO-A (separated 65∘ from L1) view, and the bursts at 14:35 UT (N30E125) and 17:55 UT (N30E120) from the region behind the east limb in the Earth view. The most noticeable activity includes the expulsion of two coronal waves on January 30 13:55 UT and 17:18 UT (also a B1.1 flare) from a small AR located at the west limb (in the Earth view). The coronal waves propagated symmetrically to all sides and one at 13:55 UT appears to be the most plausible candidate for this event.
2010 February 12 event
Note that another AR (AR1045, N20W70), associated with a previous (February 8) event, produced quite intense type III radio burst (February 12 17:05 UT), a jet and a narrow EUV wave and might also have contributed later to the February 12 event.
2010 February 19 event
The event is associated with an EUV brightening, a type III radio burst (19:03 UT) and an electron event . However the same AR released 25 min earlier an EUV wave which was still visible in the vicinity of the AR at time of the type III burst onset.
2010 June 12 event
Kozarev et al. (2011) reported high initial speed (1287 km s-1) of the associated EUV wave and an open field geometry in the source AR. The authors suggested that this wave may be the EUV signature of a coronal shock. The same region (N23W52) produced 8 hrs later another flare (C6.1, 09:02 UT), type III (09:12 UT) and type II (09:16 UT) emissions, an EUV wave (Nitta et al., 2013) and a CME (382 km s-1, 76∘ wide). The associated electron event is probably masked by the ongoing electron event from the previous flare. The 3He-rich SEP contribution from this flare to this multi-day (3 days) event can not be ruled out. The same concerns a C1.5 flare from the same AR (N25W70) on June 14 00:41 UT, accompanied by a type III radio burst (00:47 UT), an electron event, a small-scale EUV wave (included in the EUVI catalog) and a CME (343 km s-1, 62∘ wide).
2010 September 1 event
The event was observed also on STEREO-A (Wiedenbeck et al., 2013), separated 81∘ on the west from L1, together with a dispersive solar electron event observed with the STE and SEPT (Müller-Mellin et al., 2008) instruments. The L1 electron event was non-dispersive and delayed (by 25 min at 100 keV) relative to the event on STA. The SECCHI/EUVI flare was very bright.
2010 September 4 event
The source AR (N23W90) produced 7 hrs later another type III burst (14:33 UT), a B2.5 flare (14:31 UT), jet-like emission and a dispersive solar electron event that also might have contributed to the observed 3He-rich SEPs.
2010 October 19 event
We note that 9 hrs later another flare (B3.2; 15:57 UT) in the source AR, accompanied by an EUV brightening and a type III burst (but no solar electron event), could contribute to this event especially with low energy (1 MeV nucleon-1) SEPs which started near the end of October 19 and peaked in the middle of next day.
2010 November 2 event
Note that the associated B1.9 flare at 07:26 UT was closely followed by a B3.3 flare at 10:00 UT, as well as an electron event and a jet from the same AR.
2010 November 14 event
This is a multiday event where the 3He-rich SEP period lasted for 3 days. Chen et al. (2015) pointed out that a B7.6 flare at 14:36 UT on November 15 in the same AR, about one day after the beginning of this 3He-rich period, could contribute SEPs. The flare produced an electron event but no obvious 3He-rich SEP increase. It was associated with a fast eruption seen from STA and STB (in COR1 CME catalog) and the EUV wave (Nitta et al., 2013, see catalog at http://aia.lmsal.com/AIA_Waves/).
2010 November 17 event
Note that during the event (10 hrs after the associated flare) the source AR (S23W78) produced another EUV jet, a type III (18:13 UT), and electron event (2–66 keV).
2010 November 29 event
Notice that the location of a 3He-rich SEP source region so far to the east (E112) appears to be quite peculiar. However, there are examples of 3He-rich SEP sources at similar eastern longitudes. Wang et al. (2012) have reported four electron- and 3He-rich SEP source ARs between E80–E60. More extreme locations might have been omitted in the past with imagers observing only Sun’s front side. The candidate region for the November 29 event produced several strong type III radio bursts (01:19, 03:50, 05:31, 11:25, 19:05 UT) as observed by STEREO-B. On STEREO-A all these were very faint, brief and not extending to the high frequencies. Two bursts at 05:31 UT and 19:05 UT were accompanied by a coronal wave. The start time of the 3He period implies ion injection before 8 UT. STEREO-B, separated by 90∘ from L1 on the east, had better magnetic connection to this source. The higher energy 3He was not observed by LET (at 2.3–8.0 MeV nucleon-1) on STEREO-B, which is consistent with lack of high energy 3He at SIS. There was only a small He event below 1 MeV nucleon-1 detected by SIT (Mason et al., 2008) on STEREO-B but 3He could not be resolved due to large instrumental background.
References
- Biesecker et al. (2002) Biesecker, D. A., Myers, D. C., Thompson, B. J., Hammer, D. M., & Vourlidas, A. 2002, ApJ, 569, 1009
- Bougeret et al. (2008) Bougeret, J. L., Goetz, K., Kaiser, M. L., et al. 2008, Space Sci. Rev., 136, 487
- Bougeret et al. (1995) Bougeret, J.-L., Kaiser, M. L., Kellogg, P. J., et al. 1995, Space Sci. Rev., 71, 231
- Bučík et al. (2015) Bučík, R., Innes, D. E., Guo, L., Mason, G. M. & Wiedenbeck, M. E. 2015, ApJ, 812, 53
- Bučík et al. (2013) Bučík, R., Innes, D. E., Mall, U., Korth, A. & Mason, G. M. 2013, in Proc. 33rd ICRC (Rio de Janeiro), paper SH-EX 0552, http://www.cbpf.br/ĩcrc2013/proc_icrc2013.html
- Bučík et al. (2014) Bučík, R., Innes, D. E., Mall, U., et al. 2014, ApJ, 786, 71
- Cane et al. (2003) Cane, H. V., von Rosenvinge, T. T., Cohen, C. M. S., Mewaldt, R. A. 2003, Geophys. Res. Lett., 30, 817
- Chen et al. (2015) Chen, N.-H., Bučík, R., Innes, D. E. & Mason, G. M. 2015, A&A, 580, A16
- Cohen et al. (1999) Cohen, C. M. S., Mewaldt, R. A., Leske, R. A., et al. 1999, Geophys. Res. Lett., 26, 2697
- Drake & Swisdak (2012) Drake, J. F. & Swisdak, M. 2012, Space Sci. Rev., 172, 227
- Gloeckler & Geiss (1998) Gloeckler, G. & Geiss, H. 1998, Space Sci. Rev., 84, 275
- Gold et al. (1998) Gold, R. E., Krimigis, S. M., Hawkins, S. E., et al. 1998, Space Sci. Rev., 86, 541
- Howard et al. (2008) Howard, R. A., Moses, J. D., Vourlidas, A., et al. 2008, Space Sci. Rev., 136, 67
- Innes et al. (2016) Innes, D. E., Bučík, R., Guo, L.-J. & Nitta, N. V. 2016, arXiv: 1603.03258, AN in press
- Kahler et al. (2001) Kahler, S. W., Reames, D. V., & Sheeley Jr., N. R. 2001, ApJ, 562, 558
- Klein et al. (2008) Klein, K.-L., Krucker, S., Lointier, G., & Kerdraon, A. 2008, A&A, 486, 589
- Kocharov & Kocharov (1984) Kocharov, L. G. & Kocharov, G. E. 1984, Space Sci. Rev., 38, 89
- Kozarev et al. (2011) Kozarev, K. A., Korreck, K. E., Lobzin, V. V., Weber, M. A., & Schwadron, N. A. 2011, ApJ, 733, L25
- Krucker et al. (1999) Krucker, S., Larson, D. E., Lin, R. P. & Thompson, B. J. 1999, ApJ, 519, 864
- Lario et al. (2014) Lario, D., Raouafi, N. E., Kwon, R.-Y., et al. 2014, ApJ, 797, 8
- Leske et al. (2003) Leske, R. A., Wiedenbeck, M. E., Cohen, C. M. S., et al. 2003, in Proc. 28th ICRC (Tsukuba), pp. 3253, http://www-rccn.icrr.u-tokyo.ac.jp/icrc2003/proceedings_ pdf.html
- Lin et al. (1995) Lin, R. P., Anderson, K. A., Ashford, S., et al. 1995, Space Sci. Rev., 71, 125
- Lin et al. (2008) Lin, R. P., Curtis, D. W., Larson, D. E., et al. 2008, Space Sci. Rev., 136, 241
- Liu & Ofman (2014) Liu, W. & Ofman, L. 2014, Sol. Phys., 289, 3233
- Liu et al. (2006) Liu, S., Petrosian, V. & Mason, G. M. 2006, ApJ, 636, 462
- Malandraki et al. (2009) Malandraki, O. E., Marsden, R. G., Lario, D., et al. 2009, ApJ, 704, 469
- Mason (2007) Mason, G. M. 2007, Space Sci. Rev., 130, 231
- Mason et al. (2000) Mason, G. M., Dwyer, J. R., & Mazur, J. E. 2000, ApJ, 545, L157
- Mason et al. (1998) Mason, G. M., Gold, R. E., Krimigis, S. M., et al. 1998, Space Sci. Rev., 86, 409
- Mason et al. (2008) Mason, G. M., Korth, A., Walpole, P. H., et al. 2008, Space Sci. Rev., 136, 257
- Mason et al. (1999) Mason, G. M., Mazur, J. E., & Dwyer, J. R. 1999, ApJ, 525, L133
- Mason et al. (2009) Mason, G. M., Nitta, N. V., Cohen, C. M. S. & Wiedenbeck, M. E. 2009, ApJ, 700, L56
- McComas et al. (1998) McComas, D. J., Bame, S. J., Barker, P., et al. 1998, Space Sci. Rev., 86, 563
- Mewaldt et al. (2008) Mewaldt, R. A., Cohen, C. M. S., Cook, W. R., et al. 2008, Space Sci. Rev., 136, 28
- Miller (1998) Miller, J. A. 1998, Space Sci. Rev., 86, 79
- Miteva et al. (2014) Miteva, R., Klein, K.-L., Kienreich, I., et al. 2014, Sol. Phys., 289, 2601
- Müller-Mellin et al. (2008) Müller-Mellin, R., Böttcher, S., Falenski, J., et al. 2008, Space Sci. Rev., 136, 363
- Neugebauer et al. (1998) Neugebauer, M., Forsyth, R. J., Galvin, A. B., et al. 1998, J. Geophys. Res., 103, 14587
- Nitta (2012) Nitta, N. V. 2012, AIP Conf. Proc., 1436, 259
- Nitta et al. (2014) Nitta, N. V., Aschwanden, M. J., Freeland, S. L., et al. 2014, Sol. Phys., 289, 1257
- Nitta et al. (2015) Nitta, N. V., Mason, G. M., Wang, L., Cohen, C. M. S. & Wiedenbeck, M. E. 2015, ApJ, 806, 235
- Nitta et al. (2008) Nitta, N. V., Mason, G. M., Wiedenbeck, M. E., et al. 2008, ApJ, 675, L125
- Nitta et al. (2006) Nitta, N. V., Reames, D. V., DeRosa M. L., et al. 2006, ApJ, 650, 438
- Nitta et al. (2013) Nitta, N. V., Schrijver, C. J., Title, A. M. & Liu, W. 2013, ApJ, 776, 58
- Nolte & Roelof (1973) Nolte, J. T., & Roelof, E. C. 1973, Sol. Phys., 33, 241
- Park et al. (2013) Park, J., Innes, D. E., Bucik, R., & Moon, Y.-J. 2013, ApJ, 779, 184
- Patsourakos & Vourlidas (2012) Patsourakos, S. & Vourlidas, A. 2012, Sol. Phys., 281, 187
- Reames (1999) Reames, D. V. 1999, Space Sci. Rev., 90, 413
- Reames (2013) Reames, D. V. 2013, Space Sci. Rev., 175, 53
- Reames (2015) Reames, D. V. 2015, Space Sci. Rev., 194, 303
- Reames et al. (1985) Reames, D. V., von Rosenvinge, T. T., & Lin, R. P. 1985, ApJ, 292, 716
- Reames & Stone (1986) Reames, D. V., & Stone, R. G. 1986, ApJ, 308, 902
- Richardson et al. (2014) Richardson I. G., von Rosenvinge T. T., Cane H. V., et al. 2014, Sol. Phys., 289, 3059
- Rouillard et al. (2012) Rouillard, A. P., Sheeley, N. R., Tylka, A., et al. 2012, ApJ, 752, 44
- Schatten et al. (1969) Schatten, K. H., Wilcox, J. M., & Ness, N. F. 1969, Sol. Phys., 6, 442
- Shibata et al. (1992) Shibata, K., Ishido, Y., Acton, L. W., et al. 1992, PASJ, 44, L173
- Smith et al. (1998) Smith, C. W., L’Heureux, J., Ness, N. F., et al. 1998, Space Sci. Rev., 86, 613
- Stone et al. (1998) Stone, E. C., Cohen, C. M. S., Cook, W. R., et al. 1998, Space Sci. Rev., 86, 357
- Torsti et al. (1999) Torsti, J., Kocharov, L. G., Teittinen, M. & Thompson, B. J. 1999, ApJ, 510, 460
- Torsti et al. (1995) Torsti, J., Valtonen, E., Lumme, M., et al. 1995, Sol. Phys., 162, 505
- Wang et al. (2016) Wang, L., Krucker, S., Mason, G. M., Lin, R. P. & Li, G. 2016, A&A, 585, A119
- Wang et al. (2012) Wang, L., Lin, R. P., Krucker, S. & Mason, G. M. 2012, ApJ, 759, 69
- Wang et al. (2006) Wang, Y.-M., Pick, M. & Mason, G. M. 2006, ApJ, 639, 495
- Warmuth (2015) Warmuth, A. 2015, LRSP, 12, 3
- Warmuth & Mann (2011) Warmuth, A. & Mann, G. 2011, A&A, 532, A151
- Wiedenbeck et al. (2010a) Wiedenbeck, M. E., Cohen, C. M. S., Leske, R. A., et al. 2010a, ApJ, 719, 1212
- Wiedenbeck et al. (2013) Wiedenbeck, M. E., Mason, G. M., Cohen, C. M. S., et al. 2013, ApJ, 762, 54
- Wiedenbeck et al. (2010b) Wiedenbeck, M. E., Mason, G. M., Gómez-Herrero, R., et al. 2010b, AIP Conf. Proc., 1216, 621