A test of Gaia Data Release 1 parallaxes: implications for the local distance scale
Abstract
Aims. We present a comparison of Gaia Data Release 1 (DR1) parallaxes with photometric parallaxes for a sample of 212 Galactic Cepheids at a median distance of 2 kpc, and explore their implications on the distance scale and the local value of the Hubble constant .
Methods. The Cepheid distances are estimated from a recent calibration of the near-infrared Period-Luminosity () relation. The comparison is carried out in parallax space, where the DR1 parallax errors, with a median value of half the median parallax, are expected to be well-behaved.
Results. With the exception of one outlier, the DR1 parallaxes are in remarkably good global agreement with the predictions, and there is an indication that the published errors may be conservatively overestimated by about 20%. Our analysis suggests that the parallaxes of 9 Cepheids brighter than may be systematically underestimated; trigonometric parallaxes measured with the Hubble Space Telescope Fine Guidance Sensor for three of these objects confirm this trend. If interpreted as an independent calibration of the Cepheid luminosities and assumed to be otherwise free of systematic uncertainties, DR1 parallaxes would imply a decrease of 0.3% in the current estimate of the local Hubble constant, well within their statistical uncertainty, and corresponding to a value 2.5 (3.5 if the errors are scaled) higher than the value inferred from Planck CMB data used in conjunction with CDM. We also test for a zeropoint error in Gaia parallaxes and find none to a precision of . We caution however that with this early release, the complete systematic properties of the measurements may not be fully understood at the statistical level of the Cepheid sample mean, a level an order of magnitude below the individual uncertainties. The early results from DR1 demonstrate again the enormous impact that the full mission will likely have on fundamental questions in astrophysics and cosmology.
Key Words.:
astrometry: parallaxes – cosmology: distance scale – cosmology: observations – stars: variables: Cepheids – space vehicles: instruments1 Introduction
The Gaia Mission (Prusti, 2012; Gaia Collaboration et al., 2016b), launched in December 2013 by the European Space Agency, will revolutionize our knowledge of individual stellar objects and of the structure of the Milky Way by providing distance and velocity measurements of unprecedented precision for over a billion individual objects within the Milky Way. Gaia end-of-mission results will also have a major impact on cosmology, enabling the determination of the Hubble Constant to better than , assuming concomitant control of statistical and systematic errors beyond the parallax measurements (Riess et al., 2016, hereafter R16). The mission is expected to last at least 5 years, and the final astrometric measurements, with expected accuracy for the best-measured stars, will be released in 2022.
The Gaia DR1 (Gaia Collaboration et al., 2016a), which took place September 14, 2016, is based on measurements taken within the first 14 months of observations (Lindegren et al., 2016), and includes data for over a billion stars brighter than magnitude 20.7. Due to the short observing period and the limited number of separate measurements for each target, parallax and proper motion are partially degenerate, and for a majority of the star only positions are available in DR1. However, for about 2 million stars in common with the Hipparcos (Perryman et al., 1997; van Leeuwen, 2007) and Tycho-2 (Høg et al., 2000) catalogs, parallaxes and proper motions could be determined as part of the Tycho-Gaia Astrometric Solution (hereafter TGAS; Michalik et al. 2015) and are included in DR1. These stars are typically brighter than visual magnitude 11.5 and have typical parallax uncertainties of .
One of the early difficulties encountered by the Gaia mission has been a somewhat unexpected variation of the Basic Angle, the angular separation between the two fields of view, with an amplitude of several mas, as reported by the on-board Basic Angle Monitor (BAM). Data taken during commissioning (Mora et al., 2014) prove that the variation reported by the BAM is real. Self-calibration procedures have been devised to correct for the Basic Angle variation, and it is expected that the residuals are degenerate with a global zero point error in the parallax (Michalik & Lindegren, 2016). A sample of 135,000 AGN has been used as part of the solution and its verification; from an analysis of parallaxes for both Hipparcos stars and AGN, Lindegren et al. (2016) suggest that parallax zero point errors are in magnitude, with possible zonal variations and color terms, and a systematic difference between Northern and Southern hemispheres.
Lindegren et al. (2016) offer several observational and scientific tests and validations of the TGAS results. Because of the inherent challenge in reaching a new level of parallax precision, it is important to produce additional tests of the set of Gaia parallax measurements. Here we employ an additional validation, based on the sample of 249 Galactic Cepheids in van Leeuwen et al. (2007), at a median distance of 2 kpc. A similar test, based on the sample of Cepheids in Fouqué et al. (2007) but excluding nearby Cepheids (within 1 kpc), is reported in Section C3 of Lindegren et al. (2016).
The Cepheid relation, called the Leavitt Law (Leavitt & Pickering, 1912), provides a tight correlation between period and luminosity of Fundamental Mode Cepheids and has been central to the determination of the scale of the Universe for a century. Yet most Galactic Cepheids are at a distance of a few kpc; until recently, this placed them well beyond the useful range for measurements of accurate trigonometric parallaxes. Benedict et al. (2002, 2007) used the Fine Guidance Sensors (FGS) on the Hubble Space Telescope (HST) to measure the parallaxes of ten Cepheids within , reaching individual precisions of 150 to 300 , or an average of 8% per object. More recently, Riess et al. (2014) and Casertano et al. (2016) measured two Cepheid parallaxes using HST Wide Field Camera 3 in scanning mode, with precision of 54 and 38 , respectively. With the addition of a few Hipparcos measurements with errors of , the resulting sample of 15 Galactic Cepheids had a weighted mean precision of 2.1% and provided one of three anchors for the determination of the Hubble constant (R16; see also Riess et al., 2011; Freedman et al., 2012). As discussed in Section 2, this precision requires the use of reddening-insensitive Wesenheit magnitudes Madore (1982) anchored in the near-infrared (R16, Macri et al. 2015), and a careful calibration of the characteristics of the relation.
In principle, TGAS parallaxes could provide a test of the zero point of the relation and thus contribute an independent calibration of the local distance scale (see Section 4); however, given the early nature of this release, we caution that systematic effects an order of magnitude below the typical measurement error, yet large enough to affect the resulting calibration, are difficult to rule out, thus the results of this analysis must be seen as tentative.
The rest of this Letter is organized as follows. In Section 2 we describe the Cepheid sample and the underlying data on which the comparison is based. In Section 3 we carry out the test of the quality of TGAS parallaxes for stars in our sample. In Section 4 we provide a tentative analysis of the implications for the zero point calibration of the Leavitt Law and for the determination of the Hubble constant . Finally, in Section 5 we summarize our conclusion and indicate the potential impact of the full-mission Gaia results on the determination of .
2 Data collected for the Cepheid parallax test
The main sample we use to validate and interpret the Gaia TGAS parallax measurements is a set of 249 Milky Way Cepheids identified by van Leeuwen et al. (2007) as having Hipparcos measurements, together with the ground-based optical and near-infrared photometry included therein. We estimate the distance of these Cepheids on the basis of the infrared relation as calibrated by R16. In order to reduce the impact of object-by-object reddening and extinction, the relation is often formulated in terms of a so-called Wesenheit magnitude (Madore, 1982; Macri et al., 2015, see R16 for details of our implementation). Wesenheit magnitudes are formed by subtracting from the primary magnitude a color term in the same direction as the reddening law; if the spectra are smooth and the reddening law is well constrained, a Wesenheit magnitude is then reddening-free, in the sense that a given source will have the same Wesenheit magnitude when exposed to different degrees of reddening. For Cepheids, Wesenheit magnitudes, especially those for which the primary filter is in the near-IR, have the additional advantages that the color term is small and insensitive to the reddening raw, the relation is insensitive to metallicity, and its intrinsic width is reduced. We use the same quantity as in R16:
| (1) |
where , , and are the Vega-system magnitudes in the WFC3 filters F160W (near-IR), F555W, and F814W, with central wavelength 1537, 531, and 802 nm, respectively. The coefficient is appropriate to a Galactic reddening law (Fitzpatrick, 1999) with . Since the available photometry in van Leeuwen et al. (2007) is ground-based, while the best calibration of the relation obtained in R16 is based on HST data, we use the ground-to-HST transformations given in R16, Equations 10–12. The systematic uncertainty in this transformation, found by R16 to be 0.013 mag, is small compared to the 0.05 mag precision for the mean of the sample (see Section 3). However, to retain the full precision of future Gaia Cepheid parallax measurements it will be crucial to measure the Milky Way Cepheid mean magnitudes directly with HST, as discussed in Section 5.
We adopt the primary calibration of the relation from R16:
| (2) |
where is the absolute magnitude in the same Wesenheit system of Equation 1, and is the Cepheid period in days. The slope of this relation is constrained to 0.02 (0.6%) by 2500 Cepheids measured in over 20 different systems, including the Large Magellanic Cloud, M31, NGC 4258, and galaxies that hosted a Type Ia supernova. These Cepheids also demonstrate the lack of any significant break in slope near days which appears in optical bands (Ngeow & Kanbur, 2005; Ngeow et al., 2005).
The zero point of the relation was determined by R16 by using three independent geometric calibrations: trigonometric parallaxes for the 15 Galactic Cepheids mentioned in the Introduction, eight late-type detached eclipsing binaries in the Large Magellanic Cloud (Pietrzyński et al., 2013), and the geometric distance measurement based on the kinematic of a ring of OH masers in the galaxy NGC 4258 (Humphreys et al., 2013). Together, these measurements provide a calibration of the intercept in Equation 2 with an uncertainty of 0.035 mag (1.6% in distance). This calibration relates directly to the value of ; its role in our comparison will be discussed further in Section 3.
The absolute magnitude of each Cepheid from Equation 2, combined with its reddening-free apparent magnitude from Equation 1, together provide a photometric parallax estimate for each individual Cepheid. The main statistical error in the photometric parallaxes is due to the intrinsic width of the relation, which for is estimated to be mag in the LMC (Macri et al., 2015); errors due to photometric measurements are much smaller in comparison. Therefore the statistical uncertainty in each parallax estimate is —substantially smaller than the median measurement error of 50% reported for the TGAS solution (see Section 3)—thus providing a suitable test of the quality of the TGAS parallaxes. However, these uncertainties will be very significant when the full mission results are available and the typical Gaia parallax uncertainty per star will likely be . Systematic uncertainties, as in nearly all distance scale projections, will result primarily in a multiplicative scaling factor on the photometric parallax estimates, discussed further in Sections 3 and 4.
3 Parallax comparison
As described in Section 2, the available magnitude and period information allows us to predict the parallax for the 212 stars in the van Leeuwen et al. (2007) list for which photometry is available in the V, I, J, and H band and for which a TGAS parallax is available in DR1.
We carry out our analysis in parallax space, rather than in distance or photometry, because of the low signal-to-noise ratio (SNR, median value ) of individual parallaxes. The determination of the absolute magnitude of a Cepheid follows from its apparent magnitude and parallax, where and is the distance modulus derived from parallaxes, including standard corrections for bias (often referred to as Lutz-Kelker bias) arising from the finite SNR of parallax measurements (Lutz & Kelker, 1973; Hanson, 1979). For SNR , the bias correction becomes large and complex, as one must contend with a skewing of the likelihood due to the selection bias (of presumably a disk population) which is asymmetric with distance and a non-Gaussian conversion from parallax to magnitudes. A number of papers have argued about the optimal way to contend with these issues for low SNR parallax measurements (Francis, 2014; Feast, 2002; Hanson, 1979; Benedict et al., 2007). The approach we have adopted here is to use the high precision of Cepheid magnitudes and parameters (SNR 100) in R16 to predict the parallaxes to the Gaia DR1 parallaxes and compare the results. As a result, we are using the Gaia first release catalogue as a test of the R16 results, rather than as an independent calibration of the Cepheid . We expect the best use of the Gaia results to change dramatically as the Gaia precision improves by more than an order of magnitude.
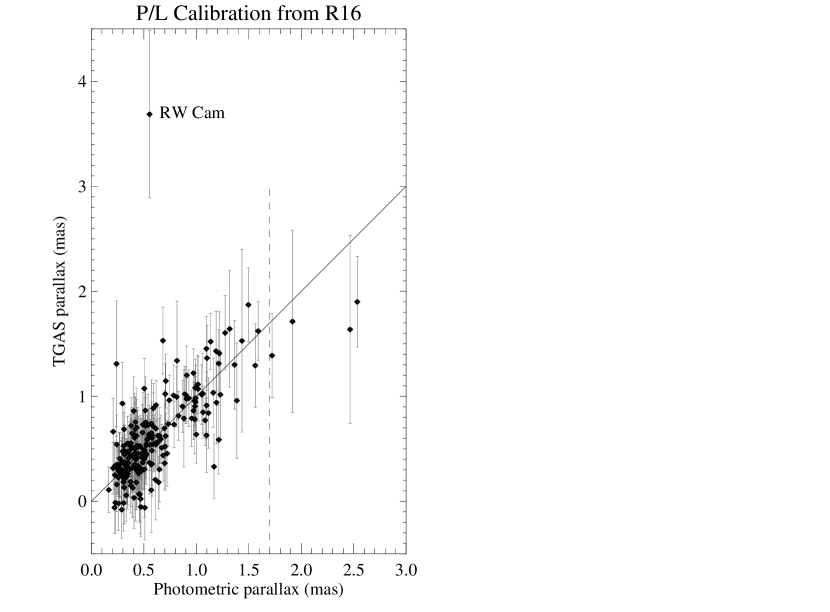
The distribution of TGAS vs. photometric parallaxes for the 212 Cepheids is shown in Figure 1, with the error bars indicating the reported TGAS uncertainty. Clearly the distributions are in good basic agreement, with the exception of the outlier RW Cam (labeled in Fig. 1), which has a TGAS parallax of mas, vs. a predicted value of 0.608 mas. RW Cam is known to have a very luminous, B8.2 III companion (Evans & Udalski, 1994), instead of the typical main-sequence companion (Bohm-Vitense & Proffitt, 1985); Fernie (2000) concludes that the bright companion is the cause of its unusual photometric properties. The bright companion can affect both the photometric distance determination and the parallax measurement (see, e.g., the discussion in Anderson et al. 2016). Therefore we exclude RW Cam from further analysis.
With the exception of this outlier, most points in Figure 1 lie within the nominal 1- error bars, suggesting that perhaps the errors may be overestimated. Indeed, under the simplistic model that the photometric and TGAS parallax are equal aside from measurement errors, the per degree of freedom (no free parameters) is 0.63 (a less than 1 in chance). If we assume that the errors are underestimated by a constant multiplicative factor, its likely value is , or about 20%. While the assumption of a single multiplicative factor may be simplistic, the conclusion that the error are underestimated—at least for the sample of Cepheids for which we carry out the comparison—appears solid, as there is no commonality of information between our photometric parallax estimates and the TGAS parallax measurements. Lindegren et al. (2016) indicate that the formal uncertainties reported by the solution process have been inflated by a factor derived from a comparison with Hipparcos parallaxes (see their Equation 4 and Appendix B; has a minimum value of 1.4). Our comparison suggests that, at least for the stars we consider, this inflation factor may have been overestimated. In the following we will consider two options: the errors as reported, and scaled errors that are 0.8 times the values reported.
In addition to the inflation factor applied to the formal errors, Lindegren et al. (2016) also indicate that there may be an additional systematic error of on the reported parallaxes, and that parallax errors may be correlated on scales up to . We tested for the possibility of a correlation by analyzing the residuals with respect to the photometric parallax estimates. The Cepheids fainter than mag in our sample form 20301 unique pairs, of which 0.5% are separated by , and 6.7% by . (Parallaxes for brighter stars may be systematically underestimated, as discussed below.) Therefore our Cepheids are very weakly correlated according to the Lindegren et al. (2016) criteria. These relatively close pairs offer the opportunity to estimate the angular correlation of parallaxes directly from the data. We find that the two-point correlation between residuals in the 1363 unique pairs separated by is , suggesting that the correlation on such scales is too small to be detected with this test. Note that our test treats all separations smaller than equally, and is therefore insensitive to a correlation that changes sign within that range (e.g., as suggested by Figure D3 in Lindegren et al. 2016). Nonetheless, our finding of smaller errors than reported suggests that additional systematics and correlations, if they exist, are significantly smaller than the formal uncertainties.
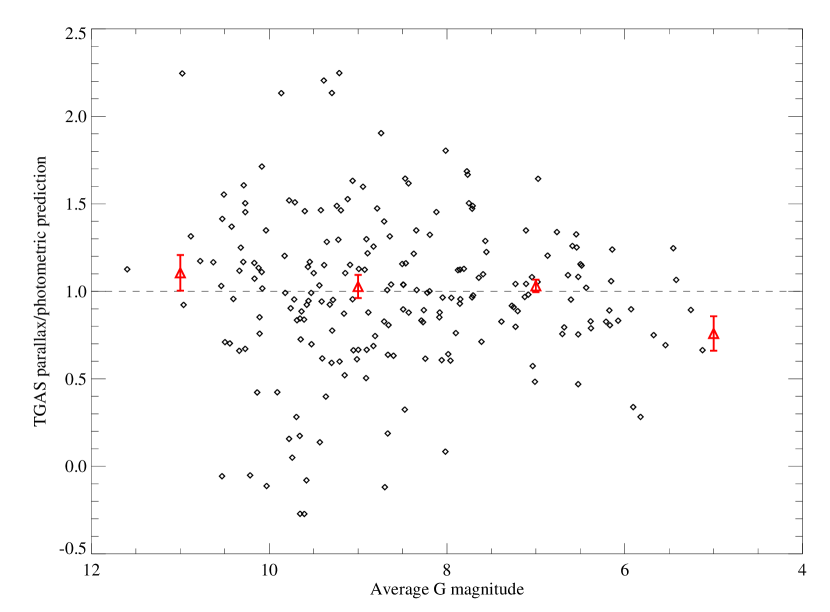
The distribution shown in Figure 1 also suggests that for some of the largest photometric parallaxes (), the TGAS parallaxes may be consistently low. These stars are also among the brightest in the sample. All of the Cepheids in our sample are brighter than the Gaia saturation limit ( mag in the Gaia band) and therefore require the use of gating (Gaia Collaboration et al., 2016b; Fabricius et al., 2016; Lindegren et al., 2016; Gaia Collaboration et al., 2016a) to be measured; the details of the process depend on the brightness of each individual star. In Figure 2 we show the ratio of measured to predicted parallax as a function of average magnitude as measured by Gaia; the red symbols show the average ratio in bins 2 mag wide. For stars fainter than mag, the unweighted average ratio between TGAS and predicted parallax is (uncertainty in the mean); for the 9 stars brighter than mag, the average ratio is . A formal significance test indicates a significant difference but is of limited value, as the error distribution is not fully characterized (more on this below); however, stars brighter than are in fact treated slightly differently from fainter stars. At , a larger download window is used (Fabricius et al., 2016); near this magnitude, the core of the stellar image will likely saturate at the shortest gating interval used (TDI gate 4, 16 lines; Gaia Collaboration et al. 2016b). Thus a separation between stars brighter and fainter than mag is naturally driven by the specifics of the measurement process and merits the a priori check. Additional confirmation that the difference is likely in the TGAS measurements can be obtained by considering the 3 stars for which and an independent trigonometric parallax measurement has been obtained with HST (Benedict et al., 2002, 2007; van Leeuwen et al., 2007). For these, the Gaia DR1 values are also low, with a mean which is 0.70 0.35 mas smaller than the independent parallaxes, indicating that the apparent difference between TGAS and photometric parallaxes for is not due to any issues with photometric parallax estimates for nearby, bright stars. To be conservative, we exclude the 9 stars brighter than mag from further analysis; their exclusion does not change significantly the value of the reduced or the apparent error overestimate.
There are thus 202 Cepheids from van Leeuwen et al. (2007) with parallaxes in the TGAS sample that provide the means to explore the present distance scale in R16 or alternatively the possibility of a zeropoint parallax error in Gaia. Despite the one outlier and the possible underestimation of parallaxes for the few Cepheids brighter than mag, the agreement between the TGAS parallaxes and the photometric distances predicted from the R16 Cepheid calibration is remarkably good. This is consistent with the comparison in Lindegren et al. (2016), who use 141 stars in the Fouqué et al. (2007) sample, likewise excluding the nearest Cepheids (within 1 kpc).
In Figure 3 we show the change in that would result from either a multiplicative term in the photometric parallaxes (left panel) or an additive term in the TGAS parallaxes (right panel). The formal minimum for the multiplicative term is obtained for a value of with 0.8 scaled errors and for nominal errors, consistent with no difference. For a global additive term, we find a preferred value of , with a formal uncertainty of for scaled errors ( for nominal errors. An additive term could arise, e.g., from a parallax zero point error due to from imperfections in the correction for Basic Angle variations (Michalik & Lindegren, 2016). Lindegren et al. (2016) carry out several tests for zero point errors, finding terms with magnitude and possible dependence on hemisphere and color; given the small number of sources in our sample, we limit our analysis to a single global zero point offset, which we find to be less than (1-).
Note that in our analysis, the assumption is implicitly made that the term in consideration (additive or multiplicative) is the only systematic in the data. Additional systematics could exist (e.g., terms that depend on magnitude, color, phase of observations, or location in the sky), and if they are below the measurement errors, would not be possible to detect without a specific test, but could reduce the precision with which an additive or multiplicative term can be determined.
We conclude that the TGAS parallaxes for the sample of Galactic Cepheids under consideration are in very good agreement, to the limit of their current precision, with the predicted parallaxes based on the calibration of R16. There is an indication and independent confirmation of an underestimation of parallax for the few stars brighter than mag, and we estimate that the reported errors appear conservatively overestimated by approximately 20%.
4 Implications for the local value of Hubble Constant
The multiplicative scaling of the parallax predicted from Cepheid photometry is formally equivalent to a change in the zero point of the calibration of the Leavitt Law; from the analysis in R16, this is equivalent to a change in the estimated value of . The R16 value of corresponds of course to a multiplicative factor of 1.0, which is well within the 1- range. The best-fit factor of ( without rescaling the errors) would produce a “recalibration” to =73.0 km s-1 Mpc-1 if interpreted as such. The Planck Collaboration et al. (2016) value of , based on Planck CMB data with CDM, corresponds to a factor of 0.91, which would produce a change in total of 8.1 with the nominal errors, or of 12.6 if the errors are scaled by a factor 0.8, and thus a tension at the 2.5–3.5 level, respectively, with the DR1 parallaxes. However, it is difficult to determine whether there are additional systematic uncertainties globally affecting this analysis. Specifically, we do not know if we can reasonably combine so many low SNR measurements to produce one, high SNR measurement without penalty and thus the present result is tentative.

5 Discussion
The Gaia mission appears to be off to a tremendous start, and there is little doubt that the full mission will produce results of great import for cosmology. While individual parallaxes have been measured for a small number of Cepheids at better precision than Gaia DR1, the new and exciting feature of DR1 is the angular breadth of the measurements, providing for 300 as precision for hundreds of classical Cepheids. Indeed, the comparison of the parallaxes predicted for of these Cepheids suggests that the Gaia DR1 uncertainties may have been conservatively overestimated. The dispersion of and -band based Wesenheit magnitudes and log periods has been observed to be 0.08 magnitudes for over 1000 objects in the LMC (Macri et al., 2015), which would result in random, individual errors of just . The fact that the () likely results from a 20% overestimate of Gaia errors, as the errors in the predictions are too small to have any impact.
The sample mean of the DR1 parallaxes for the Cepheids we consider has a nominal error of . IF there are no systematic errors at this level in the DR1 measurements, then these Cepheids would produce an independent calibration of the Cepheid distance scale with an uncertainty of 3.1% (original errors) to 2.5% (80% errors), competitive with the best geometric calibrations from NGC 4258 (2.6%), previous MW Cepheid parallaxes (2.1%) and detached eclipsing binaries in the LMC (2.0%) (R16). The factor of twenty or more improvement expected for Gaia parallaxes by mission end will push the uncertainty due to geometric distance calibration well below 1%, assuming systematics can be kept under comparable control.
However, the geometric calibration of Cepheids, central to measuring the Hubble constant, depends not on just the mean parallax precision of the sample but also on the ability to compare them photometrically to their cousins in distant galaxies. The photometry of extragalactic Cepheids in SN Ia hosts can only be measured at present in space with HST and has been achieved most extensively with WFC3. On the other hand, the photometry of the Gaia DR1 Cepheid sample analyzed here was obtained from various ground-based sources. Due to the high foreground extinction of the Milky Way fields and in external galaxies, the use of near-infrared magnitudes and colors is especially important. Ground-based NIR filter systems are based on natural (and nightly changing) breaks in water and OH emission and do not well match the space based system. This produces systematic uncertainties at the level of approximately 0.02 mag, including the relative uncertainties in NIR zeropoints and dereddened colors (R16). These uncertainties are currently below the precision of the geometric calibration of the distance scale, but will be well above the precision that can be achieved with Gaia full-mission results.
One of the best ways to mitigate the systematic error resulting from comparing ground and space-based Cepheid photometry is to observe the MW Cepheids with HST’s WFC3. We have undertaken a series of HST programs to measure the magnitudes of 50 MW Cepheids with relatively low extinction and we have employed rapid spatial scanning with HST to avoid the saturation which would occur with direct imaging of such bright stars. In the future, the combination of these 50 parallaxes from Gaia and their HST photometry in F555W, F814W, and F160W should produce a complete and effective calibration of extragalactic Cepheids with a mean error of 0.5 %, and an anchor for a 1% determination of the Hubble constant.
We have chosen to use the Gaia DR1 parallaxes as a test rather than an augmentation of the current calibration of by R16 to avoid the complication of Lutz-Kelker type bias corrections that would be large and necessary for parallax measurements with mean SNR , and in recognition that these parallaxes are expected to dramatically improve in the near term (thus reducing the need for such corrections as well).
This is the start of an exciting phase of measurement and perhaps discovery in the long-lived field of parallax measurement, with the best yet to come.
Acknowledgements.
This work has made use of data from the European Space Agency (ESA) mission Gaia (http://www.cosmos.esa.int/gaia), processed by the Gaia Data Processing and Analysis Consortium (DPAC, http://www.cosmos.esa.int/web/gaia/dpac/consortium). Funding for the DPAC has been provided by national institutions, in particular the institutions participating in the Gaia Multilateral Agreement. Support for this work was provided by NASA through program GO-13101 from the Space Telescope Science Institute, which is operated by AURA, Inc., under NASA contract NAS 5-26555, and by the Agenzia Spaziale Italiana (ASI) through ASI grant 2014-025-R.1.2015.References
- Anderson et al. (2016) Anderson, R. I., Mérand, A., Kervella, P., et al. 2016, MNRAS, 455, 4231
- Benedict et al. (2007) Benedict, G. F., McArthur, B. E., Feast, M. W., et al. 2007, AJ, 133, 1810
- Benedict et al. (2002) Benedict, G. F., McArthur, B. E., Fredrick, L. W., et al. 2002, AJ, 123, 473
- Bohm-Vitense & Proffitt (1985) Bohm-Vitense, E. & Proffitt, C. 1985, ApJ, 296, 175
- Casertano et al. (2016) Casertano, S., Riess, A. G., Anderson, J., et al. 2016, ApJ, 825, 11
- Evans & Udalski (1994) Evans, N. R. & Udalski, A. 1994, AJ, 108, 653
- Fabricius et al. (2016) Fabricius, C., Bastian, U., Portell, J., & others. 2016, ArXiv e-prints [arXiv:1609.04273]
- Feast (2002) Feast, M. 2002, MNRAS, 337, 1035
- Fernie (2000) Fernie, J. D. 2000, AJ, 120, 978
- Fitzpatrick (1999) Fitzpatrick, E. L. 1999, PASP, 111, 63
- Fouqué et al. (2007) Fouqué, P., Arriagada, P., Storm, J., et al. 2007, A&A, 476, 73
- Francis (2014) Francis, C. 2014, MNRAS, 444, L6
- Freedman et al. (2012) Freedman, W. L., Madore, B. F., Scowcroft, V., et al. 2012, ApJ, 758, 24
- Gaia Collaboration et al. (2016a) Gaia Collaboration, Brown, A., Vallenari, A., et al. 2016a, A&A, ”in press”
- Gaia Collaboration et al. (2016b) Gaia Collaboration, Prusti, T., deBruijne, J., et al. 2016b, A&A, ”in press”
- Hanson (1979) Hanson, R. B. 1979, MNRAS, 186, 875
- Høg et al. (2000) Høg, E., Fabricius, C., Makarov, V. V., et al. 2000, A&A, 355, L27
- Humphreys et al. (2013) Humphreys, E. M. L., Reid, M. J., Moran, J. M., Greenhill, L. J., & Argon, A. L. 2013, ApJ, 775, 13
- Leavitt & Pickering (1912) Leavitt, H. S. & Pickering, E. C. 1912, Harvard College Observatory Circular, 173, 1
- Lindegren et al. (2016) Lindegren, L., Lammers, U., Bastian, U., et al. 2016, ArXiv e-prints [arXiv:1609.04303]
- Lutz & Kelker (1973) Lutz, T. E. & Kelker, D. H. 1973, PASP, 85, 573
- Macri et al. (2015) Macri, L. M., Ngeow, C.-C., Kanbur, S. M., Mahzooni, S., & Smitka, M. T. 2015, AJ, 149, 117
- Madore (1982) Madore, B. F. 1982, ApJ, 253, 575
- Michalik & Lindegren (2016) Michalik, D. & Lindegren, L. 2016, A&A, 586, A26
- Michalik et al. (2015) Michalik, D., Lindegren, L., & Hobbs, D. 2015, A&A, 574, A115
- Mora et al. (2014) Mora, A., Bastian, U., Biermann, M., et al. 2014, in EAS Publications Series, Vol. 67, EAS Publications Series, 65–68
- Ngeow & Kanbur (2005) Ngeow, C.-C. & Kanbur, S. M. 2005, MNRAS, 360, 1033
- Ngeow et al. (2005) Ngeow, C.-C., Kanbur, S. M., Nikolaev, S., et al. 2005, MNRAS, 363, 831
- Perryman et al. (1997) Perryman, M. A. C., Lindegren, L., Kovalevsky, J., et al. 1997, A&A, 323, L49
- Pietrzyński et al. (2013) Pietrzyński, G., Graczyk, D., Gieren, W., et al. 2013, Nature, 495, 76
- Planck Collaboration et al. (2016) Planck Collaboration, Aghanim, N., Ashdown, M., et al. 2016, ArXiv e-prints [arXiv:1605.02985]
- Prusti (2012) Prusti, T. 2012, Astronomische Nachrichten, 333, 453
- Riess et al. (2014) Riess, A. G., Casertano, S., Anderson, J., MacKenty, J., & Filippenko, A. V. 2014, ApJ, 785, 161
- Riess et al. (2011) Riess, A. G., Macri, L., Casertano, S., et al. 2011, ApJ, 730, 119
- Riess et al. (2016) Riess, A. G., Macri, L. M., Hoffmann, S. L., et al. 2016, ApJ, 826, 56
- van Leeuwen (2007) van Leeuwen, F., ed. 2007, Astrophysics and Space Science Library, Vol. 350, Hipparcos, the New Reduction of the Raw Data
- van Leeuwen et al. (2007) van Leeuwen, F., Feast, M. W., Whitelock, P. A., & Laney, C. D. 2007, MNRAS, 379, 723