Gold Photoluminescence Wavelength and Polarization Engineering
Abstract
We demonstrate engineering of the spectral content and polarization of photoluminescence (PL) from arrayed gold nanoparticles atop a subwavelength-thin dielectric spacer and optically-thick gold film, a configuration that supports gap-surface plasmon resonances (GSPRs). Choice of shapes and dimensions of gold nanoparticles influences the GSPR wavelength and polarization characteristics, thereby allowing us to enhance and spectrally mold the plasmon-assisted PL while simultaneously controlling its polarization. In order to understand the underlying physics behind the plasmon-enhanced PL, we develop a simple model that faithfully reproduces all features observed in our experiments showing also good quantitative agreement for the PL enhancement.
keywords:
Metal photoluminescence, plasmonics, gold nanostructures, polarization, gap surface plasmonsUniversity of Southern Denmark] Department of Technology and Innovation, University of Southern Denmark, Niels Bohrs Allé 1, DK-5230 Odense M, Denmark \abbreviationsGSPR, gap surface plasmon resonance; GSP, gap surface plasmon; IR, infrared; LSP, localized surface plasmon; PL, Photoluminescence; SEM, scanning electron microscopy; SI, supporting information; Ti, titanium.
![[Uncaptioned image]](/html/1609.04930/assets/x1.png)
Photoluminescence (PL) from gold was first brought to attention in 1969 by Mooradian1, who observed broadband unpolarized emission from a plane gold film, which was also independent on the pump light polarization. PL from gold has conventionally been attributed to a three-step process consisting of photoexcitation of electron-hole pairs by excitation of d-band valence electrons to the s-p conduction band, relaxation of electron-hole pairs, and finally photon emission by electron-hole recombination2. The radiative recombination of electrons and holes from a plane gold film was reported to be an extremely inefficient process with an estimated quantum yield of . Experimental observations of PL enhancement from rough gold surfaces was later theoretically treated by Boyd et al. 3. By approximating surface roughness as a random collection of noninteracting hermispheriods, PL enhancement was assigned to the excitation of localized surface plasmons (LSPs), which resulted in improvement of both excitation and emission efficiency by enhancing the local electric field at the respective wavelengths. The electric field enhancement picture, presented by Boyd et al., has been widely adopted for the description of PL from nanoparticles for both linear 4, 5 and nonlinear excitation 6, 7. Experimental evidence of the plasmon-enhanced PL has been demonstrated with single gold nanoparticles, for which the PL spectra were strongly modulated by a pronounced peak at the wavelength of the LSP 8, 9. Very large enhancements in PL quantum yield (up to ) have been reported when conducting ensemble measurements of gold nanorods in solutions10, and tuning the transverse and longitudinal LSPs to the excitation and emission wavelength, respectively.
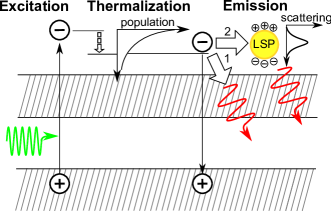
More recently, increased attention has been given to the mechanism of radiative recombination of electrons and holes. The radiative decay of electron-hole pairs has been suggested11 to consist of a direct contribution from recombination into photons and an indirect contribution from excitation of an LSP that subsequently decays via both absorption (ohmic loss) and radiation in the form of PL (Figure 1). The mechanism of plasmon-enhanced PL as being associated with the LSP excitation is largely confirmed, since many of the LSP properties were found to be imprinted into the corresponding PL characteristics. For example, LSP wavelengths seen in scattering were found to practically coincide with the peaks in PL spectra12, 13, 14, 15. Also, the temporal delay of plasmon-enhanced PL emission with respect to its excitation is fs16 and, thus, of the same order as the LSP lifetime17. Finally, it has recently been demonstrated that plasmon-enhanced PL is polarized along the resonant axis of gold nanorods18, 19 or transverse to a silver nanowire on a dielectric spacer/gold surface20. In this regard, it is worth noting that polarization resolved PL studies of nanorods have been limited to the long-axis LSP excitation, although utilization of the transverse LSP may improve the overall control of PL polarization.
In this work, we demonstrate the PL wavelength and polarization engineering by exploiting arrayed gold nanoparticles atop a subwavelength-thin dielectric spacer and optically-thick gold film, a configuration that supports gap-surface plasmon (GSP) resonances21. Spectral positions of GSP resonances (GSPRs) can be straightforwardly controlled by choosing shapes and dimensions of the nanoparticles22, 23. Moreover, GSP-based structures in this geometry are characterized not only by large electric field enhancements at resonance, but also by ease of nanofabrication with one step of electron-beam lithography being involved21, 23. These properties make GSP-resonator arrays attractive for plasmon-enhanced PL wavelength and polarization engineering. Especially, the usage of arrayed rectangular shaped nanoparticles (i.e. nanobricks) allows us to illustrate the excitation dependent interplay of two non-degenerate LSPs (associated with the resonant excitation of two orthogonally propagating GSPs) and its use for the gold PL engineering. In order to understand the underlying physics responsible for spectral and polarization properties of the plasmon-enhanced PL, we develop an intuitive model incorporating the local field enhancement effects at the excitation wavelength and explicitly relating the PL occurrence to the excitation of an LSP(Figure 1), whose radiative decay generates the enhanced PL with the corresponding spectral and polarization properties. This model faithfully reproduces all PL features observed in our experiments, including the PL dependence on the excitation polarization that has recently been reported20, 24. Moreover, it is also found in good quantitative agreement when evaluating the PL enhancement, thus providing design guidelines for the PL wavelength and polarization engineering.
1 Results and discussion
Experimental Results
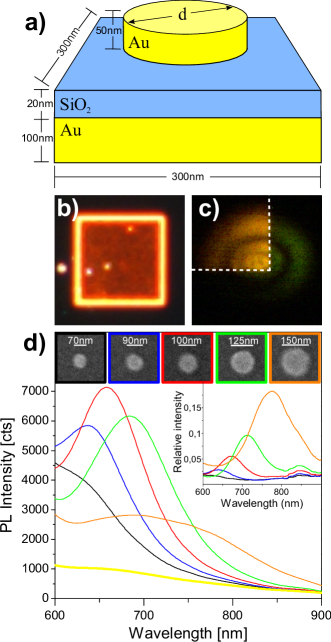
Let us start by considering plasmon-enhanced gold PL arising from a GSP-resonator array of circular shaped nanoparticles (i.e. nanodisks) illuminated at a wavelength of 532 nm. The GSP-resonator configuration consists of a 100-nm-thick gold film on a silicon substrate with a 20-nm-thin SiO2 dielectric spacer layer and a 50 nm top gold layer of nanodisks, defined by electron beam lithography, in a 5050 µm2 array with a 300 nm period (Figure 2a). The structure features Fabry-Perot like resonances25, originating from propagating GSP modes that for certain wavelengths (or disk sizes) form standing wave LSPs due to efficient reflection at disk boundaries. Here, we only consider the fundamental GSPR, which is (within the metamaterial community) also known as the magnetic resonance26, whose LSP wavelength can be simply controlled by varying the diameter of the disks. In fact, we vary the LSP wavelength from nm by varying the average nanodisk diameter from nm, as evident from correlating scanning electron microscopy (SEM) images and dark-field scattering spectra (Figure 2d). Note also a distinct dark-red color of a nanodisk array, observed with a dark field microscopy, originating from the strong scattering of light at the corresponding LSP wavelength (Figure 2b). The LSP modes have apparent influence on the strength and spectral distribution of the PL signal, as illustrated by imaging the PL with the excitation laserspot only partially overlapping the nanodisk array (Figure 2c). In order to quantify the influence of GSP-resonator arrays on the PL signal, we have recorded the PL spectrum for each array (Figure 2d) using a linear polarized pulsed laser at wavelength of 532 nm, weakly focused on the sample to ensure a broad excitation covering the center portion of the array. The PL count was found linearly dependent on the excitation power, confirming that the observed PL is related to single photon absorption. The PL from the plane gold film is seen to gradually decrease in intensity towards long wavelengths, since the population of excited charge carriers decreases for energies being further away from the excitation. Contrary, the PL spectra from the nanodisk arrays are strongly modulated, featuring higher photon counts and reaching maxima that are progressively red shifted when increasing the disk diameter. The plasmonic origin of the observed PL enhancement is confirmed by a direct comparison of the PL and scattering spectra (Figure 2d), that reveal a close resemblance between spectral peak positions.
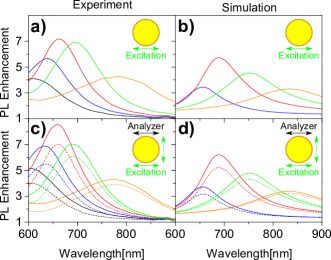
The decreasing PL intensity for LSP wavelengths below 650 nm, we attribute to increased non-radiative damping of the LSP from interband transitions in the gold, which is well known to set in for wavelengths nm27. Interestingly, the PL intensity also falls off at a significant rate for the LSP wavelengths red-shifted beyond 650 nm, despite the fact that the radiative damping of the LSP is increasingly dominating over the non-radiative decay channel with increasing particle size. The same effect has previously been attributed to the decreasing population of non-equilibrium charge carriers for plasmon excitation at long wavelengths24 . In order to account for charge carrier population effects, we obtain the PL enhancement of the respective nanodisk arrays (Figure 3a) by normalizing the PL spectra with an identically measured PL spectrum of the plane gold film, for which the PL intensity should be directly proportional to the excited charge carrier population. It is important to note, that the PL spectra arise from a large excitation spot area on the array containing both areas of weak PL (gold film) and strong PL (nanodisks). The PL enhancement therefore represents the surface average enhancement, which is very different from single nanoparticle PL enhancement for which only the nanoparticle area is considered. The PL enhancement is decreasing for LSP wavelengths 650nm, hereby indicating a secondary effect (beyond a decreasing charge carrier population) is contributing to the decline in PL intensity. As will be clear from the proposed theoretical model, plasmon-enhanced PL results from the spatial overlap between the absorption profile within the metal, at the excitation wavelength, and LSP mode profile. The decline in PL enhancement at long LSP wavelengths is a consequence of decreasing overlap, resulting from the gold becoming more metallic at long wavelengths, thus lowering the fraction of LSP mode energy in the metal. Furthermore, the enhanced absorption via off-resonant LSP excitation at the pump wavelength is progressively diminished with increased LSP red-shift from excitation wavelength. Finally, we note that the PL peaks, in accordance with the LSP resonances observed in scattering, spectrally broaden with increasing particle size. The broadening of the line width results from increasing LSP damping, for which especially radiative damping intensify with particle size. As such, one may narrow the spectral width of PL peaks by suppressing the influence of the electric dipole moment of the LSP mode28. The cost, however, is a reduced PL enhancement because of the decreased LSP quantum yield.
We now consider the polarization-dependent properties of the nanodisk arrays. By inserting an analyzer in the PL collection path, the PL polarization was checked as a function of excitation polarization (Figure 3c). Despite the fact that nanodisks possess two orthogonal degenerate LSP modes, the PL is slightly polarized along the direction of excitation, as PL intensity is consistently strongest in the parallel analyzer-excitation configuration. We would like to emphasize that the same conclusion can be reached by utilizing an orthogonally oriented analyzer [see Figure S1 in Supporting Information (SI)]. The observation can be explained by the absorption profile in the metal spatially overlapping more strongly with the co-polarized LSP mode profile compared to the orthogonally polarized, thus resulting in an uneven excitation of the LSP modes. As a measure of the polarization contrast of PL, we define the quantity at the LSP wavelength, where and are, respectively, the PL intensity polarized parallel and perpendicular to excitation. For the nanodisk arrays, we find a value of for the peak PL intensity (Figure 3c; red curve), with the quantity decreasing for longer wavelengths.
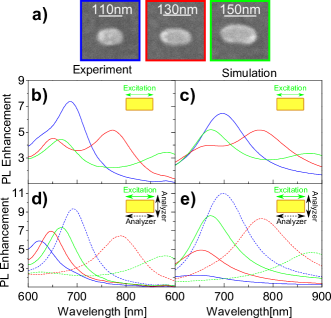
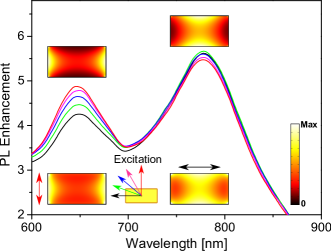
It is clear from the above discussion that nanodisk arrays allow for an enhanced and spectrally-engineered PL emission, with the polarization contrast being weak due to the degeneracy of orthogonal LSP modes. As a way to control the polarization properties of plasmon-enhanced PL, we now study nanobrick GSP-resonator arrays, featuring two orthogonal non-degenerate LSPs that can be spectrally tuned by adjusting the size and aspect ratio of the nanobricks. The nanobricks were prepared with the same layer thickness and array configuration as the nanodisk arrays. Three arrays with average geometrical cross sections of nanobricks being nm2, nm2, and nm2 (Figure 4a) were investigated (Figures 4b and 4d). The corresponding PL spectra (Figure 4b) show two peaks resulting from the two orthogonally polarized LSP modes associated with the short and long axis, as confirmed by scattering measurements (see Figure S2 in SI). Consequently, the polarization resolved PL spectra feature individual peaks related to the correspondent LSPs, resulting thereby in strongly polarized emission at both LSP wavelengths (Figure 4d). For excitation polarized along the long axis of the nanobrick, the polarization contrast at the corresponding long wavelength LSP is as large as (Figure 4d; red curves), with an average value of for the three cases considered. For the short wavelength LSP, the polarization contrast is slightly lower with for the two largest nanobrick configurations, while the latter configuration (Figure 4d; blue curves) demonstrates . It is evident from the presented -values that nanobrick arrays facilitate the possibility (within a desired wavelength range) to engineer the polarization of PL from being completely unpolarized to strongly polarized by choosing nanobricks of proper size and aspect ratio. In this regard, it is worth noting that the nature of PL does not allow for complete polarization contrast () since the omni-present PL contribution from the direct radiative decay of an electron-hole pair, although it might be small compared to the plasmonic contribution, is unpolarized. As a final comment, it should be emphasized that the total PL spectrum of nanobrick arrays can be modified by varying the angle of the excitation polarization relative to the nanobrick axes (Figure 5), which alters the relative contribution from the two non-degenerate orthogonal LSPs.
Similar to the case of the nanodisk array, the largest contribution to PL from an LSP mode is achieved when the excitation polarization is aligned with the associated axis, as the absorption profile in the metal achieves the largest spatial overlap with the LSP mode profile (see insets in Figure 5). The PL dependency on excitation polarization is observed to weaken when the LSP wavelength moves away from excitation wavelength. Note that this effect has also been observed for the other two nanobrick arrays (see Figure S3 in SI).
Theoretical discussion
As a way to better understand the underlying physics behind PL spectra from gold nanostructures, we develop a theoretical model that (despite its simplicity) is able to account for all the features observed in the above experiments. Following the discussion of related work11, 13, 24, the generation of PL is considered as a three-step process (Figure 1) involving excitation of electron-hole pairs, thermalization (giving rise to broad distribution of electron energies), and relaxation either via direct radiative recombination or indirectly by excitation of an LSP that may subsequently decay radiatively as PL or nonradiatively (ohmic loss). As a starting point, we assume the three processes to be independent, meaning that for a plane gold film, in which the plasmonic relaxation path is not an option, we may write the position-dependent PL intensity as
| (1) |
where is the angular frequency, is the excitation frequency, is the coordinate vector, is the Ohmic heating density that represents the rate of excitation, F/m is the vacuum permittivity, is the imaginary part of the relative gold permittivity, is the local electric field, represents the probability density distribution of excited electron-hole pairs, and is the quantum yield. Note that has the property that , which ensures that the total PL intensity (obtained by integrating equation 1 over volume and frequency) divided by the total power dissipated in the metal at the excitation frequency equals , as originally defined by Mooradin1. If we now consider a metallic nanostructure, there is a probability for relaxation of excited electron-hole pairs by excitation of an LSP, which leads to the position-dependent PL intensity
| (2) |
where the validity of the last equality owes to , since the quantum yield of the LSP is determined by the ratio of scattering to extinction cross section at resonance and, hence, typically for particles larger than a few tenths of nanometers11. In order to proceed, we note that the probability of an excited electron-hole pair at position to relax via LSP excitation is proportional to the local density of states of the LSP mode at that position29. Here, we approximate the probability of LSP excitation by the local field intensity enhancement at resonance, i.e.,
| (3) |
where is a proportionality factor and is the electric field in the metal of the LSP mode, which we find by numerical means (using the commercial finite element software Comsol Multiphysics) by plane wave excitation with amplitude at resonance frequency . The fact that probability of LSP excitation should decrease for frequencies that deviate from the resonance LSP frequency is accounted for by the function , which has the property that and decreases towards zero away from resonance. In this work, we extract from calculation of the absorption spectrum of GSP-resonator arrays, but could also be approximated with a Lorentzian function whose center frequency and linewidth equals the resonance frequency and linewidth of the GSPR, respectively.
We can now setup a simple expression for the enhancement factor (EF) of PL intensity by the ratio of equations 1 and 2 integrated over the respective metal volumes, while taking into account all LSPs (denoted by integer ) found in the system, i.e.,
| (4) |
where is the power absorbed in the metal (subscript or film), and is defined as
| (5) |
and characterizes the spatial overlap between the absorption distribution at excitation frequency and the mode intensity at the LSP frequency. The different field distributions are exemplified in insets of Figure 5, hereby visually underlining that (for a given LSP mode) the spatial overlap depends on the excitation polarization. Note that the factor in front of the square bracket in equation 4 accounts for the increased absorption at excitation frequency due to an increased amount of metal in GSP-resonator arrays relative to the metal film or due to any resonance effects at the excitation frequency, while the first term inside the square brackets represents PL from direct radiative decay of excited electron-hole pairs. The sum inside the square brackets, on the other hand, describes the plasmonic contribution to PL, with the integer representing all different LSPs that can be excited. For example, in considering detection of the total PL from GSP-resonator arrays we must take into account the two orthogonal LSPs whose contribution to the PL spectrum depends on the excitation polarization (i.e., depends on excitation polarization via ). In the different case of an analyzer in front of the detector (see, e.g., Figure 4e), we calculate the PL response by properly weighting the contribution from the two LSP modes, with modes of orthogonal polarization with respect to the analyzer axis being completely suppressed. It is interesting to note that the plasmonic part in equation 4 resembles recently derived formulas4 that have been used to accurately account for experimental observations. As a final comment, it ought to be mentioned that the direct applicability of equation 4 rests on the knowledge of the product in which , as previously stated, can be estimated from the associated optical cross sections. No such simple estimation of exists (to the best of our knowledge), but it can be used as a fit parameter to experimental PL spectra. Alternatively, as adopted in this work, we can rely on studies of PL from spheres11 and nanorods19, which conclude that the PL quantum yield related to plasmonic resonances is to a large degree independent of size and shape due to the counter-acting processes of decreasing probability of electron-hole pair relaxation via LSP excitation and increasing radiative decay of the LSP when the size of the nanostructure increases. As such, we can to a first approximation assume constant, with a value of used throughout this work.
Having developed a simple expression for the plasmon-assisted PL enhancement (equation 4), we apply the formalism to the nanodisk and brick arrays studied in this work (Figures 3b,d and 4c,e). Note that the dimensions of the nanoparticles used in calculations were chosen to demonstrate the plasmon-induced influence on PL when the LSP is scanned through the wavelength range 600–900 nm. As such, the dimensions of the simulated GSP-resonator arrays were adjusted wrt. the fabricated arrays in order to match resonance wavelength. In fact, since the shapes of fabricated nanodisks and nanobricks were not ideal (Figures 2d and 4a), their dimensions are not well defined. Additionally, the thickness and refractive index of the evaporated silica spacer layer are difficult to control21. Overall, the modeled PL enhancement is in good agreement with experimental values and reflects the observed spectral tendencies. For nanodisk arrays, it is clear that the model predicts a maximum PL enhancement for LSP wavelengths near nm (Figure 3b), with an associated maximum polarization contrast of (Figure 3d). This is in line with experiments, though calculations predict a faster decrease in PL intensity for LSP wavelengths below nm; a fact that we relate to the additional damping included in calculations, hereby leading to too strong contribution from interband transitions. Importantly, it should be stressed that in calculations the plasmonic contribution to the PL intensity lies solely in the parameter (equation 5), meaning that large plasmon-enhanced PL can be reached by strong field enhancement at the excitation and LSP wavelengths together with a significant spatial overlap of the corresponding fields. Finally, let us consider calculations of PL from nanobrick arrays. In agreement with experimental results, the total PL enhancement features two peaks when the two orthogonal LSPs are spectrally separated (Figure 4c), while detection of PL with analyzer along either of the two nanobrick axes confirms the possibility of strongly polarized PL (Figure 4e). Neglecting the smallest array of nanobricks due to a strongly damped short-axis LSP, the remaining two configurations (Figure 4e; red and green curves) show average polarization contrast of at the long and short LSP wavelength, respectively.
In the above presented work, the engineering of metal PL has been demonstrated within the spectral range 600-900 nm, which is not an arbitrary chosen wavelength interval, but ultimately defined by the band gap of gold, hereby determining the availability of electrons and holes to recombine at a particular wavelength. Furthermore, the strong plasmon-induced modulation of PL relies upon gold being a relative good conductor in the considered wavelength range. As such, the engineering of metal PL in a different spectral range requires the usage of another plasmonic metal with a suitable band gap. For example, silver with a band gap at nm is a potential option for transferring PL engineering to the blue and green spectral range30.
2 Conclusion
In summary, we have demonstrated the flexibility of the GSP-resonator configuration for engineering the spectral and polarization content of gold PL by defining, in a single electron-beam lithography step, the dimensions of arrayed gold nanoparticles atop a subwavelength-thin dielectric spacer on a optically thick gold layer. The configuration features LSP modes that are excited by relaxation of excited charge carriers in gold and resulting in PL enhancement (at the geometrically defined LSP wavelength) via the LSP radiative decay. Broad wavelength tunability of PL enhancement was demonstrated, for which limiting factors were identified to be interband damping of LSP mode (short wavelengths) and diminished LSP excitation resulting from decreasing mode confinement in metal (long wavelengths). The PL was found to be either weakly or strongly polarized depending whether nanoparticles exhibited degenerate (nanodisk) or non-degenerate (nanobrick) orthogonal LSP modes. Additionally, we have shown how the relative contributions of the two orthogonal LSP modes are influenced by the polarization of the pump light. In order to understand the underlying physics behind plasmon-enhanced PL, we have developed a simple model that takes into account the two relaxation paths of excited electron-hole pairs in metallic nanostructures, while relating local field enhancement effects at the excitation wavelength to enhanced PL emission at the LSP wavelength through the spatial overlap of absorption and LSP intensity profiles. The model faithfully reproduces all the PL features observed in experiment, including the dependence on excitation polarization and the strongly polarized nature of PL from nanobrick arrays with good quantitative agreement on PL enhancement values. We believe that the presented systematic study clearly demonstrates the potential of PL engineering by utilizing plasmonic resonances, with the developed theoretical model allowing one to properly choose system parameters, thereby providing guidelines for the wavelength and polarization engineering of PL. The results obtained might, in our opinion, also find implications in engineering of two-photon luminescence7 and cathodeluminescence31.
3 Methods
Fabrication
Samples were prepared on a diced silicon substrate by e-beam evaporation of 100 nm gold (Au) and RF-sputtering of 20 nm silicon dioxide (SiO2) with intermediate 3 nm layers of Titanium (Ti), added for adhesive purposes. The sample were then spincoated with PMMA 2A 950k to 100nm thickness and prebaked for 90 s at 180 C∘. Arrays of 300 nm period disks or bricks were then defined by electron beam lithography (JSM-6400LV JEOL), developed in Methyl isobutyl(MIBK): Isopropyl alcohol(IPA) 1:3 (30s) with subsequent IPA stopper (30s) and blow-dried with nitrogen. Finally, 3 nm Ti/ 50 nm Au was deposited by thermal evaporation, and lift-off was done by leaving sample in acetone overnight ( 10h). The sample was removed from the acetone bath under constant rinse of IPA and subsequently blow-dried with nitrogen. Disk and brick arrays were prepared under two separate fabrication cycles.
PL measurement
PL spectra of the prepared GSP-resonator arrays were obtained on a PL spectroscopy setup constructed on a IX73 microscope (Olympus). The arrays were excited by a linearly polarized, pulsed laser (LDH-P-FA-530L Pico Quant) at 532 nm wavelength and 40 MHz repetition rate, resulting in 1.2 mW average power incident on sample. A half-waveplate were inserted in excitation path for rotating excitation polarization. Excitation and back collection of PL were done through a x100 IR objective(NA 0.95), defocused to ensure broad excitation of the center portion of the array. The defocused spot was continuously reproduced by defocusing on the plane gold film to achieve the same spot image observed on CCD (wrt. image markers). PL was separated from excitation by a dichroic mirror and subsequent LP filter (band edge 550 nm) and fiber coupled to a grating spectrometer(QE65000 Ocean Optics). For measurements of fluorescence polarization, an analyzer was fitted infront of the fiber coupler.
Scattering measurement
Scattering spectra were obtained using a dark-field spectroscopy setup on a BX51 microscope (Olympus). The arrays were illuminated by a halogen lamp at highly oblique angles 70∘, while scattered light, was collected in the range 0-64∘ by a x100 (NA 0.9) objective. The collection of scattered light was restricted to a 32 µm spot (centered on array) by a pinhole in the objective image plane and fiber coupled to a grating spectrometer (QE65000 Ocean Optics). For measurements of polarization of scattered light, an analyzer was inserted infront of the pinhole. Scattering spectra were obtained relative to a reflection measurement of a silver mirror.
Simulations
All modeling results are performed using the commercially available finite-element software Comsol Multiphysics, version 4.3b. In the calculations, we only model a single unit cell of the two-dimensional GSP-resonator arrays, applying periodic boundary conditions on the vertical sides of the cell. The lower boundary of the simulation domain, representing the truncation of the optically thick gold substrate, behaves as a perfect electric conductor, while the air domain above the GSP-resonator array is truncated using a port boundary. The same port boundary is also used for excitation of plane waves that propagate normal to the gold surface. Throughout this paper, we use a unit cell period of 300nm, a dielectric spacer thickness of 20nm, and nanostructures of height 50nm. The spacer is assumed to be silicon dioxide with a constant permittivity of 2.1, while the permittivity of gold is described by interpolated experimental values27. The imaginary part of the gold permittivity is increased by four times as a way of modeling the increased electron relaxation rate due to surface scattering and grained boundaries, and the presence of 3-nm-thin Ti adhesion layers32, 33.
We acknowledge financial support for this work from the Danish Council for Independent Research (the FNU project, contract no. 12-124690) and the European Research Council, Grant 341054 (PLAQNAP).
Comparative PL spectra of disk arrays for excitation co- and cross- polarized to either horizontal or vertical analyzer (S1); scattering and PL spectral comparison for analyzer probing polarization along short or long axis of brick arrays (S2); PL spectra of brick arrays for excitation polarized along short or long axis (S3).
References
- Mooradian 1969 Mooradian, A. Photoluminescence of Metals. Phys. Rev. Lett. 1969, 22, 185–187
- Apell et al. 1988 Apell, P.; Monreal, R.; Lundqvist, S. Photoluminescence of Noble Metals. Phys. Scripta 1988, 38, 174–179
- Boyd et al. 1986 Boyd, G. T.; Yu, Z. H.; Shen, Y. R. Photoinduced Luminescence from the Noble Metals and its Enhancement on Roughened Surfaces. Phys. Rev. B 1986, 33, 7923–7936
- Lumdee et al. 2014 Lumdee, C.; Yun, B.; Kik, P. G. Gap-Plasmon Enhanced Gold Nanoparticle Photoluminescence. ACS Photonics 2014, 1, 1224–1230
- Lee et al. 2004 Lee, J.; Govorov, A. O.; Dulka, J.; Kotov, N. A. Bioconjugates of CdTe Nanowires and Au Nanoparticles: Plasmon−Exciton Interactions, Luminescence Enhancement, and Collective Effects. Nano Lett 2004, 4, 2323–2330
- Bouhelier et al. 2003 Bouhelier, A.; Beversluis, M. R.; Novotny, L. Characterization of Nanoplasmonic Structures by Locally Excited Photoluminescence. Appl. Phys. Lett. 2003, 83, 5041–5043
- Beermann et al. 2008 Beermann, J.; Novikov, S. M.; Søndergaard, T.; Boltasseva, A.; Bozhevolnyi, S. I. Two-photon mapping of localized field enhancements in thin nanostrip antennas. Opt. Express 2008, 16, 17302–17309
- Bouhelier et al. 2005 Bouhelier, A.; Bachelot, R.; Lerondel, G.; Kostcheev, S.; Royer, P.; Wiederrecht, G. P. Surface Plasmon Characteristics of Tunable Photoluminescence in Single Gold Nanorods. Phys. Rev. Lett. 2005, 95, 267405
- Beversluis et al. 2003 Beversluis, M.; Bouhelier, A.; Novotny, L. Continuum generation from single gold nanostructures through near-field mediated intraband transitions. Phys. Rev. B 2003, 68, 115433
- Mohamed et al. 2000 Mohamed, M. B.; Volkov, V.; Link, S.; El-Sayed, M. A. The ‘Lightning’ Gold Nanorods: Fluorescence Enhancement of over a Million Compared to the Gold Metal. Chem. Phys. Lett. 2000, 317, 517 – 523
- Dulkeith et al. 2004 Dulkeith, E.; Niedereichholz, T.; Klar, T. A.; Feldmann, J.; von Plessen, G.; Gittins, D. I.; Mayya, K. S.; Caruso, F. Plasmon Emission in Photoexcited Gold Nanoparticles. Phys. Rev. B 2004, 70, 205424
- Shahbazyan 2013 Shahbazyan, T. V. Theory of Plasmon-Enhanced Metal Photoluminescence. Nano Lett. 2013, 13, 194–198
- Walsh and Negro 2013 Walsh, G. F.; Negro, L. D. Engineering Plasmon-Enhanced Au Light Emission with Planar Arrays of Nanoparticles. Nano Lett. 2013, 13, 786–792
- Steiner et al. 2008 Steiner, M.; Debus, C.; Failla, A. V.; Meixner, A. J. Plasmon-Enhanced Emission in Gold Nanoparticle Aggregates. J.Phys.Chem.C 2008, 112, 3103–3108
- Fang et al. 2012 Fang, Y.; Chang, W.-S.; Willingham, B.; Swanglap, P.; Dominquez-Medina, S.; Link, S. Plasmon Emission Quantum Yield of Single Gold Nanorods as a Function of Aspect Ratio. ACS Nano 2012, 6, 7177–7184
- Varnavski et al. 2003 Varnavski, O. P.; Mohamed, M. B.; El-Sayed, M. A.; Goodson, T. Relative Enhancement of Ultrafast Emission in Gold Nanorods. J. Phys. Chem. B 2003, 107, 3101–3104
- Sönnichsen et al. 2002 Sönnichsen, C.; Franzl, T.; Wilk, T.; von Plessen, G.; Feldmann, J.; Wilson, O.; Mulvaney, P. Drastic Reduction of Plasmon Damping in Gold Nanorods. Phys. Rev. Lett. 2002, 88, 077402
- Tcherniak et al. 2011 Tcherniak, A.; Dominguez-Medina, S.; Chang, W.-S.; Swanglap, P.; Slaughter, L. S.; Landes, C. F.; Link, S. One-Photon Plasmon Luminescence and Its Application to Correlation Spectroscopy as a Probe for Rotational and Translational Dynamics of Gold Nanorods. J. Phys. Chem. C 2011, 115, 15938–15049
- Yorulmaz et al. 2012 Yorulmaz, M.; Khatua, S.; Zijlstra, P.; Gaiduk, A.; Orrit, M. Luminescence Quantum Yield of Single Gold Nanorods. Nano lett. 2012, 12, 4385–4391
- Hu et al. 2013 Hu, H.; Akimov, Y. A.; Duan, H.; Li, X.; Liao, M.; Tan, R. L. S.; Wu, L.; Chen, H.; Fan, H.; Bai, P.; Lee, P. S.; Yang, J. K. W.; Shen, Z. X. Photoluminescence via Gap Plasmons between Single Silver Nanowires and a Thin Gold Film. Nanoscale 2013, 5, 12086–12091
- Nielsen et al. 2012 Nielsen, M. G.; Pors, A.; Albrektsen, O.; Bozhevolnyi, S. I. Efficient Absorption of Visible Radiation by Gap Plasmon Resonators. Opt. Express 2012, 20, 13311–13319
- Pors and Bozhevolnyi 2013 Pors, A.; Bozhevolnyi, S. I. Efficient and broadband quarter-wave plates by gap-plasmon resonators. Opt. Express 2013, 21, 2942–2952
- Roberts et al. 2014 Roberts, A. S.; Pors, A.; Albrektsen, O.; Bozhevolnyi, S. I. Subwavelength Plasmonic Color Printing Protected for Ambient Use. Nano Lett. 2014, 14, 783–787
- Hu et al. 2012 Hu, H.; Duan, H.; Yang, J. K.; Shen, Z. X. Plasmon-Modulated Photoluminescence of Individual Gold Nanostructures. ACS Nano 2012, 6, 10147–10155
- Bozhevolnyi and Søndergaard 2007 Bozhevolnyi, S. I.; Søndergaard, T. General Properties of Slow-Plasmon Resonant Nanostructures: Nano-Antennas and Resonators. Opt. Express 2007, 15, 10869–10877
- Yuan et al. 2007 Yuan, H.-K.; Chettiar, U. K.; Cai, W.; Kildishev, A. V.; Boltasseva, A.; Drachev, V. P.; Shalaev, V. M. A negative permeability material at red light. Opt. Express 2007, 15, 1076–1083
- Johnson and Christy 1972 Johnson, P. B.; Christy, R. W. Optical Constants of the Noble Metals. Phys. Rev. B 1972, 6, 4370–4379
- Pors et al. 2010 Pors, A.; Willatzen, M.; Albrektsen, O.; Bozhevolnyi, S. I. From plasmonic nanoantennas to split-ring resonators: tuning scattering strength. J. Opt. Soc. Am. B 2010, 27, 1680–1687
- Viarbitskaya et al. 2013 Viarbitskaya, S.; Teulle, A.; Marty, R.; Sharma, J.; Girard, C.; Arbouet, A.; Dujardin, E. Tailoring and Imaging the Plasmonic Local Density of States in Crystalline Nanoprisms. Nat. Mater. 2013, 12, 426–432
- Alqudami and Annapoorni 2007 Alqudami, A.; Annapoorni, S. Fluorescence From Metallic Silver and Iron Nanoparticles Prepared by Exploding Wire Technique. Plasmonics 2007, 2, 5–13
- García de Abajo 2010 García de Abajo, F. J. Optical excitations in electron microscopy. Rev. Mod. Phys. 2010, 82, 209–275
- Chen et al. 2010 Chen, K.-P.; Drachev, V. P.; Borneman, J. D.; Kildishev, A. V.; Shalaev, V. M. Drude Relaxation Rate in Grained Gold Nanoantennas. Nano Lett. 2010, 10, 916–922
- Pors et al. 2013 Pors, A.; Nielsen, M. G.; Bozhevolnyi, S. I. Broadband plasmonic half-wave plates in reflection. Opt. Lett. 2013, 38, 513–515