Giant anisotropic nonlinear optical response
in transition metal monopnictide Weyl semimetals
Although Weyl fermions have proven elusive in high-energy physics, their existence as emergent quasiparticles has been predicted in certain crystalline solids in which either inversion or time-reversal symmetry is brokenWanPRB2011 ; BurkovPRL2011 ; WengPRX2015 ; HuangNatComm2015 . Recently they have been observed in transition metal monopnictides (TMMPs) such as TaAs, a class of noncentrosymmetric materials that heretofore received only limited attention XuScience2015 ; LvPRX2015 ; YangNatPhys2015 . The question that arises now is whether these materials will exhibit novel, enhanced, or technologically applicable electronic properties. The TMMPs are polar metals, a rare subset of inversion-breaking crystals that would allow spontaneous polarization, were it not screened by conduction electrons anderson1965symmetry ; shi2013ferroelectric ; kim2016polar . Despite the absence of spontaneous polarization, polar metals can exhibit other signatures of inversion-symmetry breaking, most notably second-order nonlinear optical polarizability, , leading to phenomena such as optical rectification and second-harmonic generation (SHG). Here we report measurements of SHG that reveal a giant, anisotropic in the TMMPs TaAs, TaP, and NbAs. With the fundamental and second harmonic fields oriented parallel to the polar axis, the value of is larger by almost one order of magnitude than its value in the archetypal electro-optic materials GaAs bergfeld2003second and ZnTe wagner1998dispersion , and in fact larger than reported in any crystal to date.
The last decade has witnessed an explosion of research investigating the role of bandstructure topology, as characterized for example by the Berry curvature in momentum space, in the electronic response functions of crystalline solids NiuRMP2010 . While the best established example is the intrinsic anomalous Hall effect in time-reversal breaking systems NagaosaRMP2010 , several nonlocal Orenstein2013 ; Zhong2015 and nonlinear effects related to Berry curvature generally MoorePRL2010 ; SodemannPRL2015 and in WSM’s specifically Ishizuka2016 ; Chan2016 have been predicted in crystals that break inversion symmetry. Of these, the most relevant to this work is a theoretical formulation Morimoto2015 of SHG in terms of the shift vector, which is a quantity related to the difference in Berry connection between two bands that participate in an optical transition.
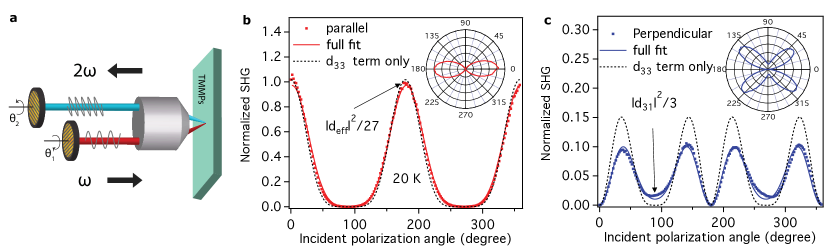
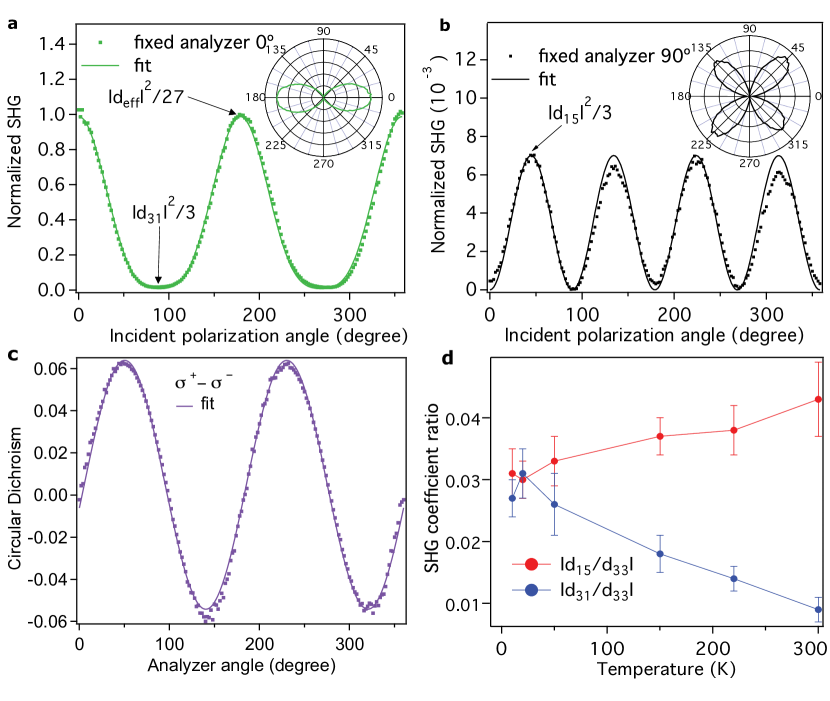
Fig. 1a and caption provide a schematic and description of the optical set-up for measurement of SHG in TMMP crystals. Figs. 1b,c show results from a (112) surface of TaAs. The SH intensity from this surface is very strong, allowing for polarization rotation scans with signal-to-noise ratio above 106. In contrast, SHG from a TaAs (001) surface is barely detectable (at least six orders of magnitude lower than (112) surface). Below, we describe the use of the set-up shown in Fig. 1a to characterize the second-order optical susceptibility tensor, , defined by the relation, .
As a first step, we determined the orientation of the high-symmetry axes in the (112) surface, which are the [1,-1,0] and [1,1,-1] directions. To do so, we simultaneously rotated the linear polarization of the generating light (the generator) and the polarizer placed before the detector (the analyzer), with their relative angle set at either 0∘ or 90∘. Rotating the generator and analyzer together produces scans, shown in Figs. 1b, c, which are equivalent to rotation of the sample about the surface normal. The angles at which we observe the peak and the null in Fig. 1b and the null in Fig. 1c allow us to identify the principle axes in the (112) plane of the surface.
Having determined the high symmetry directions, we characterize by performing three of types of scans, the results of which are shown in Fig. 2. In scans shown in Figs. 2a, b, we oriented the analyzer along one of the two high symmetry directions and rotated the plane of linear polarization of the generator through 360∘. Fig. 2c shows the circular dichroism of the SHG response, that is, the difference in SH generated by left and right circularly polarized light. For all three scans the SHG intensity as a function of angle is consistent with the second-order optical susceptibility tensor expected for the point group of TaAs, as indicated by the high accuracy of the fits in Fig. 1b, c and Fig. 2a-c.
In the structure and are mirror planes but reflection through the plane is not a symmetry; therefore TaAs is an acentric crystal with an unique polar () axis. In crystals with symmetry there are three independent nonvanishing elements of : , , and . Note that each has at least one component, implying null electric dipole SHG when all fields are in the plane. This is consistent with observation of nearly zero SHG for light incident on the (001) plane. Below, we follow the convention of using the second-rank tenor , rather than , to express the SHG response, where the relation between the two tensors for TaAs is: , , and Boyd (See Methods and Supplementary Information section A).
Starting with the symmetry constrained tensor, we derive expressions, specific to the (112) surface, for the angular scans with fixed analyzer shown in Fig. 2 a,b (Methods and Supplementary Information section A). We obtain and for analyzer parallel to [1,1,-1] and [1,-1,0], respectively, where . Fits to these expressions yield two ratios: and . Although we do not determine and directly, it is clear from the extreme anisotropy of the angular scans that , which gives the SHG response when both generator and analyzer are parallel to the polar axis, is much larger than the other two components. We can place bounds on and by setting and in and out of phase with . We note that the observation of circular dichroism in SHG, shown in Fig. 2c, indicates that relative phase between and is neither or , but rather closer to (Supplementary Information section A).
The results of this analysis are plotted in Fig. 2d, where it is shown that falls in the range for all temperatures, and increases from to with increasing temperature. Perhaps because of its polar metal nature, the anisotropy of the second-order susceptibility in TaAs is exceptionally large compared with what has been observed previously in crystals with the same set of nonzero . For example, -ZnS, CdS, and KNiO3 have shoji1997absolute , while in BaTiO3 the relative sizes are reversed, with miller1964optical .
Even more striking than the extreme anisotropy of is the absolute size of the SHG response in TaAs. The search for materials with large second-harmonic optical susceptibility has been of continual interest since the early years of nonlinear optics bloembergen1962light1 . To determine the absolute magnitude of the coefficients in TaAs we used GaAs and ZnTe as benchmark materials. Both crystals have large and well characterized second-order optical response functions bergfeld2003second ; wagner1998dispersion , with GaAs regarded as having among the largest of any known material. GaAs and ZnTe are also ideal as benchmarks because their response tensors have only one nonvanishing coefficient, .
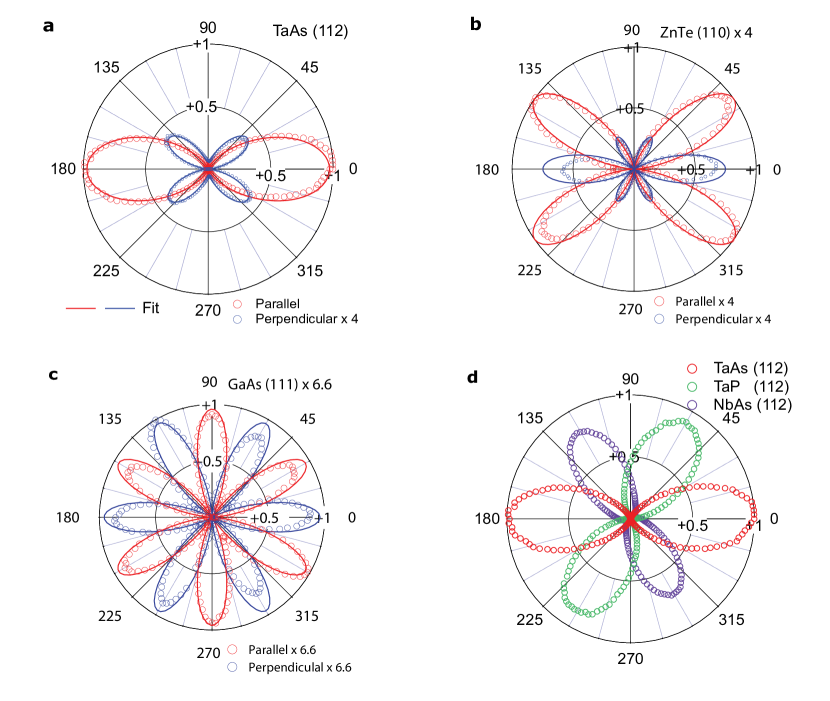
Figs. 3a-c show polar plots of SHG intensity as TaAs (112), ZnTe (110), and GaAs (111) are (effectively) rotated about the optic axis with the generator and analyzer set at 0∘ and 90∘. Also shown (as solid lines) are fits to the polar patterns obtained by rotating the tensor to a set of axes that includes the surface normal, which is (110) and (111) for our ZnTe and GaAs crystals respectively (Methods and Supplementary Information section A). Even prior to analysis to extract the ratio of coefficients between the various crystals, it is clear that the SHG response of TaAs (112) is large, as the peak intensity in this geometry exceeds ZnTe (110) by a factor of 4.0() and GaAs (111) by a factor of 6.6(). Fig. 3d compares the parallel polarization data for TaAs shown in Fig. 3a with SHG measured under the same conditions in other TMMP’s TaP and NbAs (112) facets. The strength of SHG from the three crystals, which share the same 4 point group, is clearly very similar, with TaP and NbAs intensities relative to TaAs of 0.90(0.02) and 0.76(0.04), respectively. The SHG response in these compounds is also dominated by the coefficient. Finally, we found that the SHG intensity of all three compounds does not decrease after exposure to atmosphere for several months.
| Material | (pm/V) | Fundamental wavelength (nm) | Reference | |
|---|---|---|---|---|
| TaAs | 3600 () | 800 | This work | |
| GaAs | 350∗ | 810 | Ref. bergfeld2003second, | |
| ZnTe | 250, 450∗ | 800, 700 | Ref. wagner1998dispersion, | |
| BaTiO3 | 15 | 900 | Ref. miller1964optical, | |
| BiFeO3 | 15-19 | 1550, 800 | Ref. haislmaier2013large, ; ju2009electronic, t | |
| LiNbO3 | 26 | 852 | Ref. shoji1997absolute, | |
| BiFeO3 | 130∗ | 500 | Ref. ju2009electronic, t | |
| BaTiO3 | 100∗ | 170 | Ref. young2012first, t | |
| PbTiO3 | 200∗ | 150 | Ref. young2012first, t |
To obtain the response of TMMP’s relative to the two benchmark materials we used the Bloembergen-Pershan formula bloembergen1962light1 to correct for the variation in specular reflection of SH light that results from the small differences in the index of refraction of the three materials at the fundamental and SH frequency. (See Methods. Details concerning this correction, which is less than 20, can be found in Supplementary Information section B). Table 1 presents the results of this analysis, showing that pm/V at fundamental wavelength 800 nm in TaAs exceeds values in benchmark materials GaAs bergfeld2003second and ZnTe wagner1998dispersion by approximately one order of magnitude, even when measured at wavelengths where their response is largest. The coefficient in TaAs at 800 nm exceeds corresponding values in ferroelectric materials BiFeO3 haislmaier2013large , BaTiO3 miller1964optical , LiNbO3 shoji1997absolute by two orders of magnitude. In the case of the ferroelectric materials, SHG measurements have not been performed in their spectral regions of strong absorption, typically 3-7 eV. However, ab-initio calculations consistently predict that the resonance enhanced values in this region do not exceed roughly 500 pm/Vju2009electronic ; young2012first .
The results described above raise the question of why in the TMMP’s is so large. Answering this question quantitatively will require further work in which measurements of as a function of frequency are compared with theory based on ab initio bandstructure and wavefunctions. For the present, we describe a calculation of using a minimal model of a WSM that is based on the approach to nonlinear optics proposed by Morimoto and Nagaosa (MN) Morimoto2015 . This theory clarifies the connection between bandstructure topology and SHG, and provides a concise expression with clear geometrical meaning for . Hopefully this calculation will motivate the ab initio theory that is needed to quantitatively account for the large SH response of the TMMP s and its possible relation to the existence of Weyl nodes.
The MN result for the dominant () response function is,
| (1) |
In Eq. 1 the nonlinear response is expressed as a second-order conductivity, , relating the current induced at to the square of the applied electric field at , i.e., . (The SH susceptibility is related to the conductivity through the relation ). The indices 1 and 2 refer to the valence and conduction bands, respectively, is the transition energy, and is the matrix element of the velocity operator . Bandstructure topology appears in the form of the “shift vector,” , which is a gauge-invariant length formed from the derivative of the phase of the velocity matrix element, , and the difference in Berry connection, , between bands 1 and 2. Physically, the shift vector is the -resolved shift of the intracell wave function for the two bands connected by the optical transition.
We consider the following minimal model for a time-reversal symmetric WSM that supports four Weyl nodes,
| (2) |
Here, and are Pauli matrices acting on orbital and spin degrees of freedom, respectively, is a measure of the bandwidth, is the lattice constant, and are parameters that introduce anisotropy, and inversion breaking is introduced by . The Hamiltonian defined in Eq. 2 preserves two-fold rotation symmetry about the -axis and the mirror symmetries and . These symmetries form a subset of point group which is relevant to optical properties of TMMP’s.
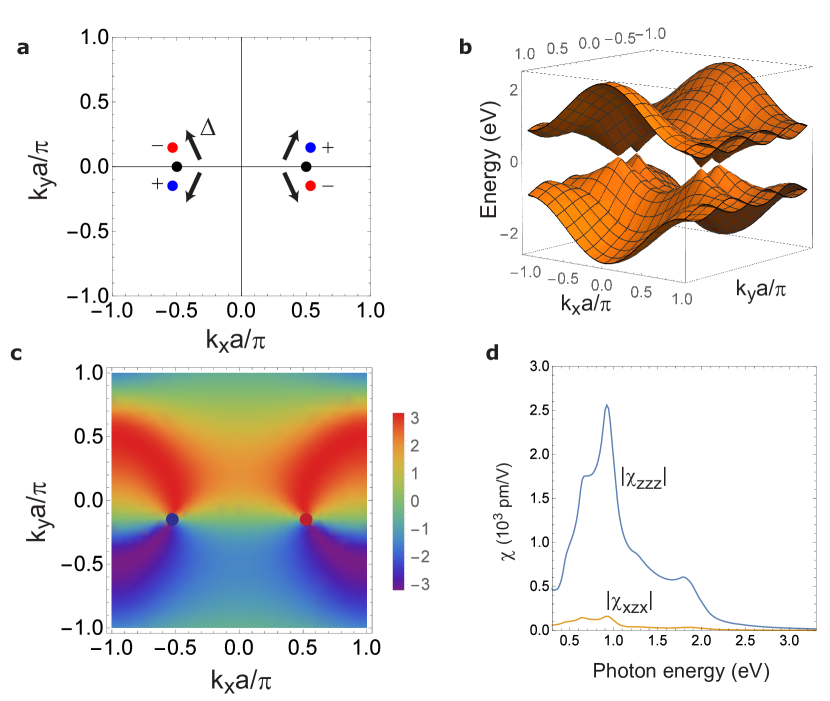
Fig. 4 illustrates the energy levels, topological structure, and SHG spectra that emerge from this model. As shown in Fig. 4a, pairs of Weyl nodes with opposite chirality overlap at two points, , in the inversion-symmetric case with . With increasing the nodes displace in opposite directions along the axis, with . The energy of electronic states in plane, illustrating the linear dispersion near the four Weyl points, is shown in Fig. 4b. Fig. 4c shows the corresponding variation of for the bands whose Weyl points are located at (the variation of for the bands is obtained from the transformation ). The magnitude of derived from this model vanishes as and is also sensitive to the anisotropy parameters and . Fig. 4d shows that spectra corresponding to parameters eV, , , and can qualitatively reproduce the observed amplitude and large anisotropy of .
As discussed above, our minimal model of an inversion-breaking WSM is intended mainly to motivate further research into the mechanism for enhanced SHG in the TMMP’s. However, the model does suggest universal properties of that arise from transitions near Weyl nodes between bands with nearly linear dispersion. According to bulk bandstructure measurements YangNatPhys2015 , such transitions are expected at energies below approximately 100 meV in TaAs family, corresponding to far-infrared and THz regimes. In this regime, where the interband excitation is within the Weyl cones, the momentum-averaged tends to nonzero value, , leading to the prediction that as . Because , the joint density of states for Weyl fermions is proportional to , we predict that approaches a constant (or alternatively diverges as ) as , even as the linear optical conductivity vanishes in proportion to hosur2012charge . The scaling of SHG and optical rectification is a unique signature of a WSM in low-energy electrodynamics, as it requires the existence of both inversion breaking and point nodes. In real materials, this divergence will be cutoff by disorder and nonzero Fermi energy. Disorder induced broadening, estimated from transport scattering rates xu2016optical1 and Pauli blocking from nonzero Fermi energy, estimated from optical conductivity xu2016optical1 and band calculation WengPRX2015 , each suggests a low energy cutoff in the range of a few meV.
We conclude by observing that the search for inversion-breaking WSMs has led, fortuitously, to a new class of polar metals with unusually large second-order optical susceptibility. Although WSM ’s are not optimal for frequency doubling applications in the visible regime because of their strong absorption, they are promising materials for THz generation and opto-electronic devices such as far-infrared detectors because of their unique scaling in the limit. Looking forward, we hope that our findings will stimulate further investigation of nonlinear optical spectra in inversion-breaking WSM’s for technological applications and in order to identify the defining response functions of Weyl fermions in crystals.
References
- (1) Wan, X., Turner, A. M., Vishwanath, A. & Savrasov. S. Topological semimetal and Fermi-arc surface states in the electronic structure of pyrochlore iridates. Physical Review B, 83, 205101 (2011).
- (2) Burkov, A. & Balents, L. Weyl semimetal in a topological insulator multilayer. Physical Review Letters, 107, 127205 (2011).
- (3) Weng, H., Fang, C., Fang, Z., Bernevig, B. A. & Dai, X. Weyl semimetal phase in noncentrosymmetric transitionmetal monophosphides. Physical Review X, 5, 011029 (2015).
- (4) Huang, S.-M. et al. A Weyl Fermion semimetal with surface Fermi arcs in the transition metal monopnictide TaAs class Nature Communications, 6, 7373 (2015).
- (5) Xu, S.-Y. et al. Discovery of a Weyl fermion semimetal and topological Fermi arcs. Science, 349, 613 (2015).
- (6) Lv, B. et al. Experimental discovery of Weyl semimetal TaAs. Physical Review X, 5, 031013 (2015).
- (7) Yang, L. et al. Weyl semimetal phase in the noncentrosymmetric compound TaAs. Nature Physics, 11, 728 (2015).
- (8) Anderson, P. & Blount, E. Symmetry considerations on martensitic transformations:“ ferroelectric” metals? ”Physical Review Letters, 14, 217 (1965).
- (9) Shi, Y. et al. A ferroelectric-like structural transition in a metal. Nature Materials, 12, 1024 (2013).
- (10) Kim, T. et al. Polar metals by geometric design. Nature, 533, 68 (2016).
- (11) Bergfeld, S. & Daum, W. Second-harmonic generation in GaAs: Experiment versus theoretical predictions of Physical Review Letters, 90, 036801, (2003).
- (12) Wagner, H. P., Kuhnelt, M., Langbein, W. & Hvam, W. Dispersion of the second-order nonlinear susceptibility in ZnTe, ZnSe, and ZnS. Physical Review B, 58, 10494, (1998).
- (13) Xiao, D., Chang, M.-C. & Niu, Q. Berry phase effects on electronic properties. Review of Modern Physics, 82, 1959 (2010).
- (14) Nagaosa, N., Sinova, J., Onoda, S., MacDonald, A. H. & Ong, N. P. Anomalous Hall effect. Review of Modern Physics, 82, 1939 (2010).
- (15) Orenstein, J. & Moore, J. E. Berry phase mechanism for optical gyrotropy in stripe-ordered cuprates. Phys. Rev. B, 87, 165110 (2013).
- (16) Zhong, S., Orenstein, J. and Moore, J. E. Optical Gyrotropy from Axion Electrodynamics in Momentum Space. Phys. Rev. Lett., 115, 117403 (2015).
- (17) Moore, J. E.& Orenstein, J. Confinement-induced Berry phase and helicity-dependent photocurrents. Phys. Rev. Lett., 105, 165110 (2010).
- (18) Sodemann, I. & Fu, L. Quantum nonlinear Hall effect induced by Berry curvature dipole in time-reversal invariant materials.Physical Review Letters, 115, 216806 (2015).
- (19) Ishizuka, H., Hayata, T., Ueda, M. & Nagaosa, N. Emergent Electromagnetic Induction and Adiabatic Charge Pumping in Weyl Semimetals. arXiv:1607.06537, (2016).
- (20) Chan, C.-K., Lindner, N. H., Refael, G, & Lee, P. A. Photocurrents in Weyl semimetals. arXiv: 1607.07839, (2016).
- (21) Morimoto, T. & Nagaosa, N. Topological nature of nonlinear optical effects in solids. Science Advances, 2, 1501524 (2016).
- (22) Boyd, R. W. Nonlinear optics. Academic press, (2003).
- (23) Shoji, I., Kondo, T., Kitamoto, A., Shirane, M. & Ito, R. Absolute scale of second-order nonlinear-optical coefficients. JOSA B, 14, 2268, (1997).
- (24) Miller, R. C. Optical harmonic generation in single crystal BaTiO3. Physical Review, 134, A1313, (1964).
- (25) Bloembergen, N. & Pershan, P. Light waves at the boundary of nonlinear media. Physical Review, 128, 606, (1962).
- (26) Haislmaier, R. C. et al. Large nonlinear optical coefficients in pseudo-tetragonal BiFeO3 thin films. Applied Physics Letters, 103, 031906, (2013).
- (27) Ju, S., Cai, T.-Y. & Guo, G.-Y. Electronic structure, linear, and nonlinear optical responses in magnetoelectric multiferroic material BiFeO3. The Journal of Chemical Physics, 130, 214708, (2009).
- (28) Young, S. M. & Rappe, A. M. First principles calculation of the shift current photovoltaic effect in ferroelectrics. Physical Review Letters, 109, 116601, (2012).
- (29) Hosur, P., Parameswaran, S. & Vishwanath, A. Charge transport in Weyl semimetals. Physical Review Letters, 108, 046602, (2012).
- (30) Xu, B. et. al. I. Optical spectroscopy of the Weyl semimetal TaAs Phys. Rev. B., 93, 121110, (2016).
I Methods
Crystal growth and structure characterization
Single crystals of TaAs, TaP and NbAs were grown by vapor transport with iodine as the transport agent. First, polycrystalline TaAs/TaP/NbAs was produced by mixing stoichiometric amounts of Ta/Nb and As/P and heating the mixture to 1100/800/700 ∘C in an evacuated quartz ampule for 2 days. 500 mg of the resulting powder was then resealed in a quartz ampoule with 100 mg of iodine and loaded into a horizontal two-zone furnace. The temperature of the hot and cold ends were held at 1000 ∘C and 850 ∘C, respectively, for TaAs and 950 ∘C and 850 ∘C for TaP and NbAs. After 4 days well-faceted crystals up to several millimeters in size were obtained. Crystal structure was confirmed using single-crystal x-ray mico-Laue diffraction at room temperature at beamline 12.3.2 at the Advanced Light Source.
Optics setup for second harmonic generation The optical set up for measuring SHG is illustrated in Fig. 1a. Generator pulses of 100 fs duration and center wavelength 800 nm pass through a mechanical chopper that provides amplitude modulation at 1 kHz and are focused at near normal incidence onto the sample. Polarizers and waveplates in the beam path are used to vary the direction of linear polarization and to generate circularly polarization. Both the specularly reflected fundamental and the second harmonic beam are collected by a pickoff mirror and directed to a short-pass, band-pass filter combination that allows only the second harmonic light to reach photomultiplier tube (PMT) photodetector. Another wire-grid polarizer placed before the PMT allows for analysis of the polarization of the second harmonic beam. Temperature dependence measurement was performed by mounting TaAs sample in a cold-finger cryostat on a xyz-micrometer stage. Benchmark measurements on TaAs, TaP, NbAs, ZnTe and GaAs were performed at room temperature in atmosphere with the samples mounted on a xyz-micrometer stage to maximize the signal.
Calculation and fitting procedure for SHG We first fit data obtained with fixed analyzer at 90∘, which is the [1,-1,0] crystal axis, because there is only one free parameter () in this configuration. With this value for , we then fit data in the three other types of scans discussed in the text with and set in and out-of phase with . This procedure yields upper and lower bounds on the anisotropy ratios and that are shown with error bars in Fig. 2(d). In the case of GaAs and ZnTe all scans are fit accurately by the only symmetry allowed free parameter, which is . See Supplementary Information for more details.
Bloembergen-Pershan correction When measuring in the reflection geometry, one need to consider the boundary condition to calculate from that was directly measured, where ‘R’ stands for reflection geometry. The correction was worked out by Bloembergen-Pershan (BP) (See supplementary information):
| (3) |
where is the relative dielectric constant and is the Fresnel coefficient of the fundamental light. In the current experiment performed at 800 nm, the BP correction is quite small (less than 20 %). See Supplementary Information for more details.
II addendum
We thank B. M. Fregoso, T. R. Gordillo, J. Neaton and Y. R. Shen for helpful discussions and B. Xu for sharing refractive index data of TaAs. Measurements and modeling were performed at the Lawrence Berkeley National Laboratory in the Quantum Materials program supported by the Director, Office of Science, Office of Basic Energy Sciences, Materials Sciences and Engineering Division, of the U.S. Department of Energy under Contract No. DE-AC02-05CH11231. J.O., L.W., and A.L. received support for performing and analyzing optical measurements from the Gordon and Betty Moore Foundation’s EPiQS Initiative through Grant GBMF4537 to J.O. at UC Berkeley. Sample growth was supported by the Gordon and Betty Moore Foundation’s EPiQS Initiative Grant GBMF4374 to J.A. at UC Berkeley. T.M. is supported by the Gordon and Betty Moore Foundation’s EPiQS Initiative Theory Center Grant GBMF4307 to UC Berkeley. J.E.M. received support for travel from the Simons Foundation. The authors would like to thank Nobumichi Tamura for his help in performing crystal diffraction and orientation on beamline 12.3.2 at the Advanced Light Source. N. Tamura and the ALS are supported by the Director, Office of Science, Office of Basic Energy Sciences, of the U.S. Department of Energy under Contract No. DE-AC02-05CH11231. J. A. and N. N. acknowledge support by the Office of Naval Research under the Electrical Sensors and Network Research Division, Award No. N00014-15-1-2674.
Competing Interests: The authors declare that they have no competing financial interests.
Correspondence: Correspondence and requests for materials should be addressed to L.W. (email:liangwu@berkeley.edu) and J.O. (email:jworenstein@lbl.gov).
III Author Contribution
L.W. and J.O. conceived the project. L.W. and S.P. performed and contributed equally to the SHG measurements with assistance from E. T. and A. L.. L.W. and J.O. analyzed the data. T.M. and J.M. performed the model calculation. L.W., T.M. and J.O. performed the frequency scaling analysis. N.N. and J.A. grew the crystals and characterized the crystal structure. L.W., T.M. and J.O. wrote the manuscript. All authors commented on the manuscript.
IV Supplementary Information for “Giant anisotropic nonlinear optical response in transition metal monopnictide Weyl semimetals”
IV.1 Dependence of SHG amplitude on polarization for different crystal and surfaces used in this study
In general, the polarization, P, in materials has contributions from higher orders of the electric field, E, in addition to the linear response, such that,
| (1) |
In noncentrosymmetric materials the second order term, , that gives rise to frequency mixing, SHG, and optical rectification, is allowedBoyd2 ; shen1984principles . The latter two phenomena arise from excitation with a single frequency, such that there is an automatic symmetry with respect to permutation of the second and third indices. This motivates the use of a second rank tenor instead of Boyd2 . The relation between and is as follows: the first index in corresponds to respectively in and the second index in corresponds to in Boyd2 . In terms of the tensor, the relation between second order polarization and electric field has the formBoyd2 :
| (2) |
For a crystal with effective point group symmetry , the nonzero elements are , and . Note that transition metal monopnictides (TMMPs) such as TaAs belong to the non-symmorphic space group which has screw rotation instead of C4 rotation. However, screw and C4 rotation symmetries lead to the same constraints on in optics and therefore SHG is described by the point group in TMMPs. Predictions based on Eq. 2 for the angular dependence of the SHG intensity for four scans that involve linear polarized light normally incident on the TaAs or TaP or NbAs (112) surface are given below. Eqs. 3 and 4 refer to scans where two polarizers are synchronously rotated to simulate rotation of the sample. Note that we omitted the constant of 2 in the following calculations. and correspond to generator and analyzer polarization set parallel and perpendicular, respectively,
| (3) |
| (4) |
Eqs. 5 and 6 refer to scans where the analyzer is fixed at (parallel to [1,1-1] crystal axis) and (parallel to [1,-1,0] crystal axis), respectively, and the direction of linear polarization of the generator is scanned,
| (5) |
| (6) |
The remaining scan that provides independent information constraining the elements of the tensor is a measurement of SHG circular dichroism, which is the difference in SHG intensity with incident light of left and right circular polarization. To lowest order in ,
| (7) |
The circular dichroism in SHG is proportional to and therefore measures the component of that is out-of-phase with . From comparison of the circular dichroism and linear polarization measurements we find a relative phase of 30 ∘ ( 10 ∘) between and at 300 K.
The benchmark materials, GaAs and ZnTe, have the same point group 3m, and the only nonzero components of the tensor are . For light normally incident on the ZnTe (110) surface, the SHG angular dependencies are:
| (8) |
| (9) |
For GaAs (111) they are:
| (10) |
| (11) |
IV.2 Obtaining nonlinear response coefficients from benchmark materials
From Eq. 3, the peak SHG intensity from TaAs (112) is proportional to , where . Peak SHG intensities from ZnTe (110) and GaAs (111) are proportional to and , respectively. When measured in reflection, in addition to the nonlinear response coefficients, the SHG intensity depends on the index of refraction at the fundamental and the second harmonic frequencies. To compare SHG intensities from different compounds we use a formula derived by Bloembergen and Pershan bloembergen1962light ,
| (12) |
where is the relative dielectric constant, ‘R’ stands for reflection geometry and is the Fresnel coefficient of the fundamental light. Values for index of refraction were taken from the literature: ZnTeli1984refractive , GaAsforouhi1988optical and complex index of TaAs was measured by the method that can be found in Ref. xu2016optical, . The correction factor turns out to be small, less than 20%, because the indices of refraction for the three compounds are similar in magnitude (within 30 difference) at the relevant frequencies. Without taking account of this correction, we obtain pV/m for TaAs by referring to the value of ZnTewagner1998dispersion2 .
After establishing the relative size of the coefficients by the procedure described above, we used measurements of the absolute amplitude of in ZnTe et al.wagner1998dispersion2 to obtain absolute amplitudes for GaAs and TaAs. As reported in the main text, we obtain 3600 pV/m in TaAs. Using the same procedure of referencing to ZnTe, we obtain pV/m for GaAs, which agrees with the literature valuebergfeld2003second2 .
References
- (1) Boyd, R. W. Nonlinear optics. Academic Press, (2003).
- (2) Shen, Y.-R. Principles of nonlinear optics. Wiley-Interscience. (1984).
- (3) Bloembergen, N. & Pershan, P. Light waves at the boundary of nonlinear media. Physical Review, 128, 606, (1962).
- (4) Li, H.H. Refractive index of ZnS, ZnSe, and ZnTe and its wavelength and temperature derivatives. Journal of physical and chemical reference data, 13, 103, (1984).
- (5) Forouhi, A. & Bloomer, I. Optical properties of crystalline semiconductors and dielectrics. Phys. Rev. B., 38, 1865, (1988).
- (6) Xu, B. et. al. I. Optical spectroscopy of the Weyl semimetal TaAs Phys. Rev. B., 93, 121110, (2016).
- (7) Wagner, H. P., Kuhnelt, M., Langbein, W. & Hvam, W. Dispersion of the second-order nonlinear susceptibility in ZnTe, ZnSe, and ZnS. Physical Review B, 58, 10494, (1998).
- (8) Bergfeld, S. & Daum, W. Second-harmonic generation in GaAs: Experiment versus theoretical predictions of Physical Review Letters, 90, 036801, (2003).