Structures and finite-temperature abundances of defects in In2O3-II from first-principles calculations: supplementary information
.1 Structure searching
All density-functional theory (DFT) calculations were performed using version 8 of the castep Clark et al. (2005) plane-wave code. In the initial structure search we used Vanderbilt ultrasoft pseudopotentials Vanderbilt (1990) generated by castep. In these pseudopotentials the , and electrons in indium were treated as valence electrons and the others as core electrons, while for oxygen the and electrons were treated as valence electrons111The castep pseudopotential generation strings used to generate the pseudopotentials were 3|2.3|6|8|8|50:51:42 for indium, and 2|1.1|14|16|19|20:21(qc=7) for oxygen..
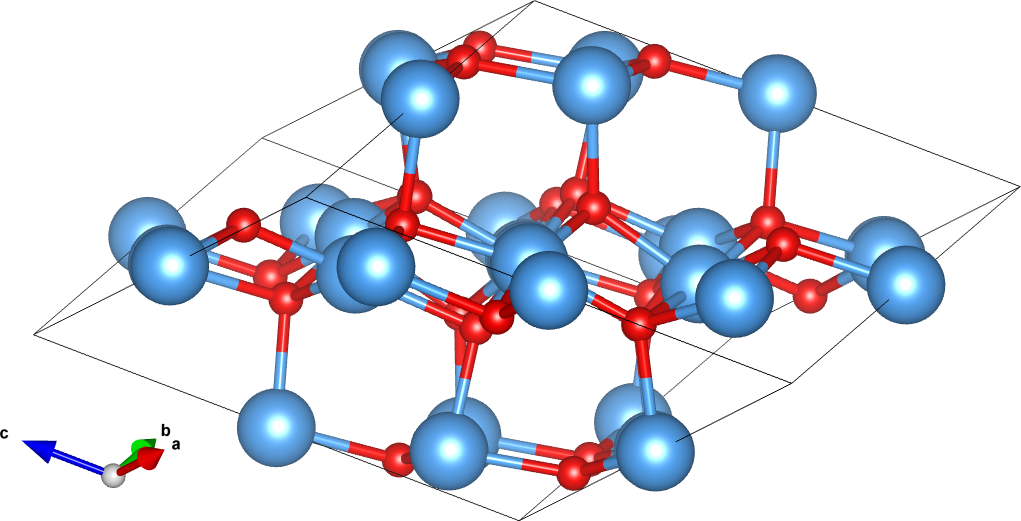
By performing a series of total energy calculations, we found that a cutoff of is sufficient to obtain formation energies to within which is accurate enough for the purposes of the initial AIRSS searches. We performed the searches in the 40-atom primitive unit cell shown in Fig. 1. The Brillouin zone (BZ) was sampled using only the Baldereschi mean-value point Baldereschi (1973), which we find is associated with a sampling error of less than per atom. We used the lattice constant obtained from the PBE functional of which is in agreement with the PBE results presented in Ref. Varley and Schleife, 2015 and is 0.8% larger than the experimental value Marezio (1966).
.2 Supercell calculations
After the initial structure searching phase, the structures of the defects lying closest to the convex hull were refined by re-optimising them in a larger cell with more accurate computational settings. We used a 160-atom supercell with the shape chosen to maximise the distance from each defect to its nearest periodic image. This supercell is the primitive cell of a face-centred cubic lattice, with lattice parameters and angles , and .
The geometry optimisation in the 160-atom supercell was performed with a higher basis set cutoff of and BZ sampling on a Monkhorst-Pack grid. We use the same ultrasoft pseudopotentials as for the initial search.
We calculate (via calculations performed at still higher basis cutoffs) that truncating the plane wave basis beyond results in an error in the formation energies of under per atom. Some calculations performed with a MP grid indicate that the corresponding error in the total energy due to the BZ sampling is under per atom.
To calculate the vibrational free energy of a defect, we first relax the 160-atom supercell containing that defect so that the forces on the atoms are no larger than . We then perform harmonic phonon calculations using the finite-difference method, solving the Kohn-Sham equations at only (due to the significant cost of phonon calculations on such large cells and the fact that the phonon free energy is generally a small correction). The elements of the dynamical matrix were evaluated using the finite displacement method, and only phonons with wavevector were considered.
.3 Metastable defects
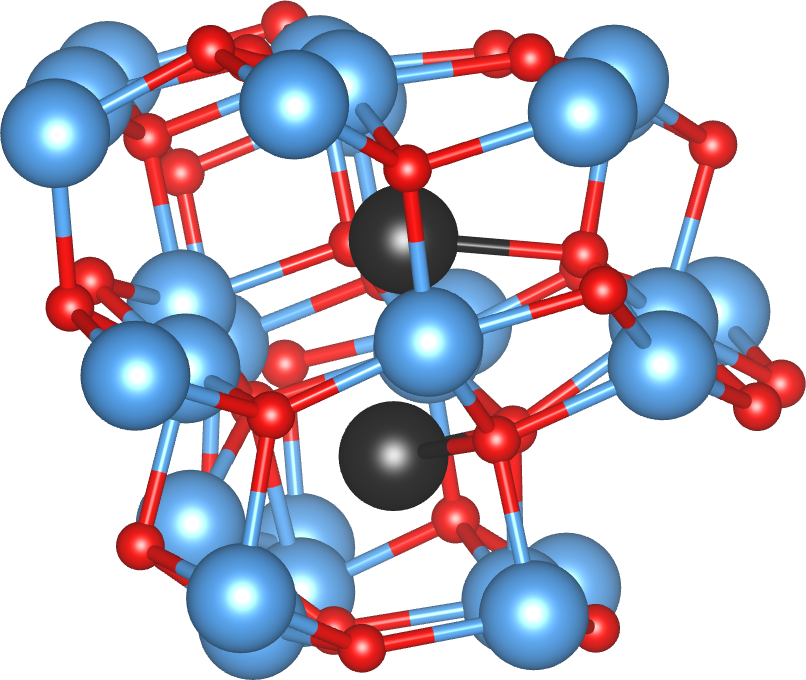
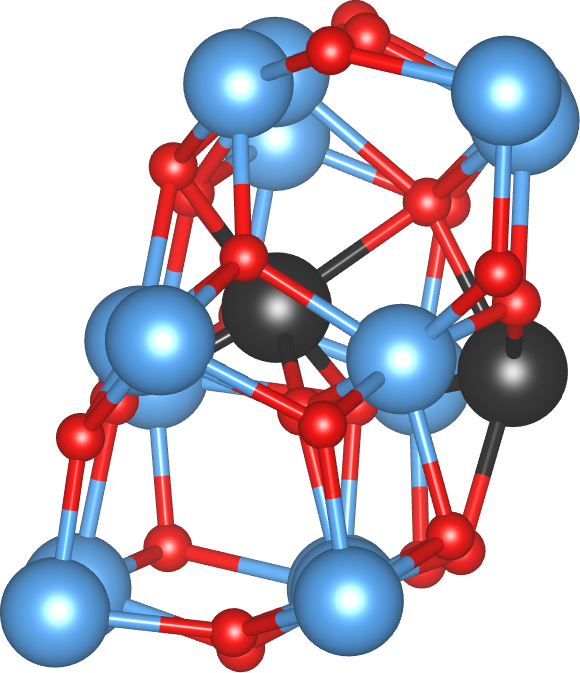
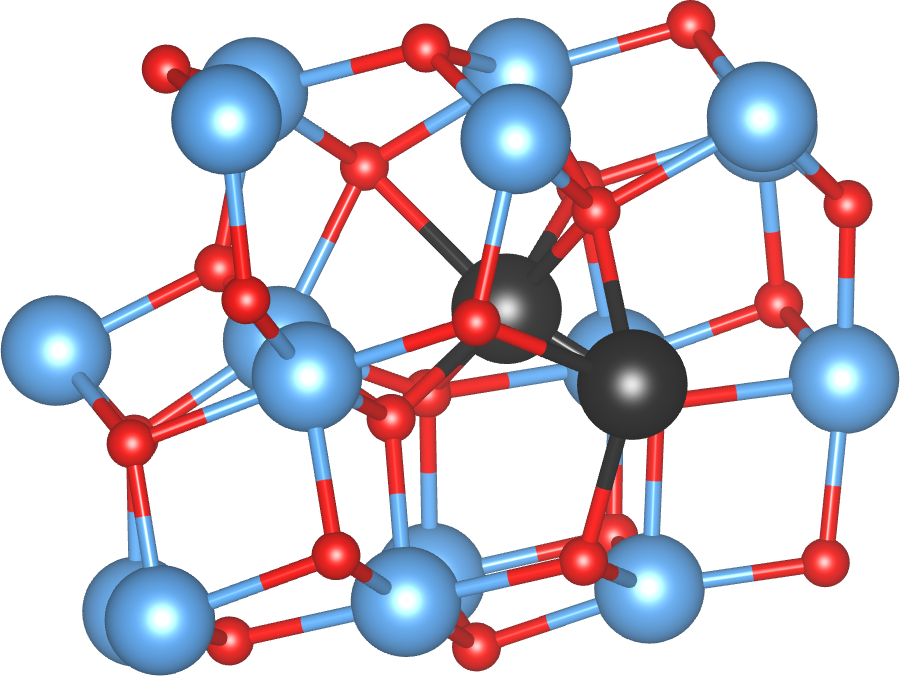
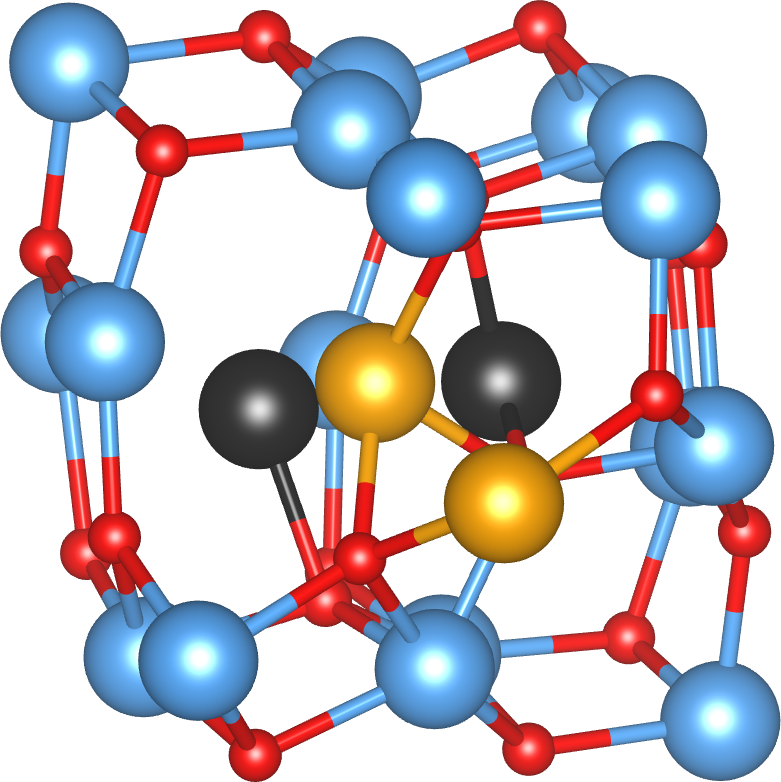
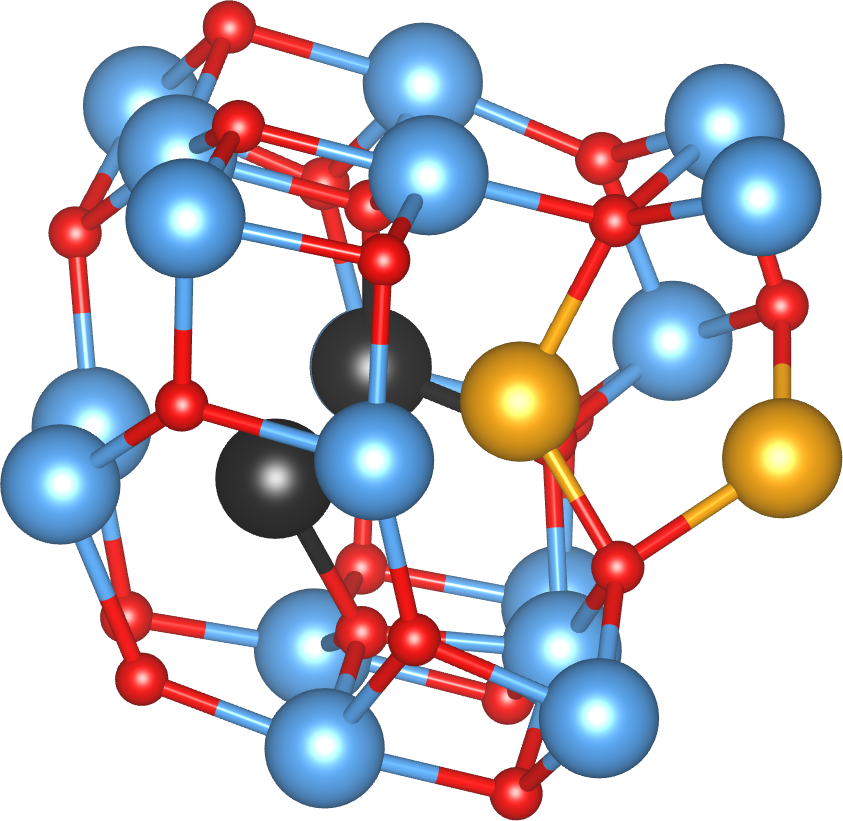
Because their relative energetic unfavourability renders them of lesser physical importance, three metastable defect structures were not shown in the Letter. Nevertheless, they are novel structures and are predicted to be stable relative to dissociation into isolated indium interstitials and oxygen vacancies, so we show them here. In the {2In,2VO} (pictured in Fig. 2), two In interstitials (black) sit above and below a layer of In atoms, and each binds to two nearby O atoms (similarly to {In,2VO}). The {In,VO}* defect is a split indium interstitial shown on Fig. 3, whilst the larger {2In,3VO}* complex consists of two split In interstitials in close proximity, and is shown on Fig. 4.
.4 Finite-temperature abundances
To illustrate the effects of both the novel defects we have discovered, and of our inclusion of the configurational entropy term, we have recalculated the phase diagram without each of these factors. The resulting phase diagrams (Fig. 5) show markedly different behaviour: the simple {In,VO} indium substitutional is not as energetically favourable as the new {2In,3VO} and {In,2VO} defects, and as a result it has largely dissociated at room temperature. The significance of the configurational entropy term is also clear on Fig. 5, with a marked decrease in the stability of the composite {2In,3VO} and {In,2VO} defects when the effects of configurational entropy are taken into account.


.5 HSE06 calculations
In our HSE06 density of states calculations we use the conventional cubic 80-atom unit cell with the Kohn-Sham equations solved self-consistently at the point of the BZ only (because of the extreme cost of computing the screened exchange term), before solving the Kohn-Sham equations non-self-consistently on a Monkhorst-Pack grid. (We choose an odd for the MP grid because -II has a direct band gap at ; this would be a suboptimal choice for the calculation of total energies, but for densities of states it gives more accurate energies for the valence band maximum and conduction band minimum.) Norm-conserving pseudopotentials were used which treated as valence the indium , and orbitals and the oxygen and orbitals. We increased the plane wave basis set cutoff to for these calculations. The resulting density of states is shown alongside that resulting from the PBE functional is shown on Fig. 6; both densities of states are calculated using version 1.2 of the OptaDOS Yates et al. (2007); Morris et al. (2014) code.

References
- Clark et al. (2005) S. J. Clark, M. D. Segall, C. J. Pickard, P. J. Hasnip, M. I. J. Probert, K. Refson, and M. C. Payne, Zeitschrift fur Kristallographie 220, 567 (2005).
- Vanderbilt (1990) D. Vanderbilt, Physical Review B 41, 7892 (1990).
- Baldereschi (1973) A. Baldereschi, Physical Review B 7, 5212 (1973).
- Varley and Schleife (2015) J. B. Varley and A. Schleife, Semicond. Sci. Technol. 30, 24010 (2015).
- Marezio (1966) M. Marezio, Acta Cryst 20, 723 (1966).
- Yates et al. (2007) J. R. Yates, X. Wang, D. Vanderbilt, and I. Souza, Physical Review B 75, 195121 (2007).
- Morris et al. (2014) A. J. Morris, R. J. Nicholls, C. J. Pickard, and J. R. Yates, Computer Physics Communications 185, 1477 (2014).