Optical spectroscopy of single beryllium acceptors in GaAs/AlGaAs quantum well
Abstract
We carry out micro-photoluminescence measurements of an acceptor-bound exciton () recombination in the applied magnetic field with a single impurity resolution. In order to describe the obtained spectra we develop a theoretical model taking into account a quantum well (QW) confinement, an electron-hole and hole-hole exchange interaction. By means of fitting the measured data with the model we are able to study the fine structure of individual acceptors inside the QW. The good agreement between our experiments and the model indicates that we observe single acceptors in a pure 2D environment which states are unstrained in the QW plain.
I Introduction
Studies of single impurities in solids is one of the most rapidly developing fields of experimental physics in recent years Koenraad and Flatté (2011); Besombes et al. (2004); Kudelski et al. (2007). Such experiments are attractive since it makes possible to verify the fundamental theoretical approaches that were based on macroscopic measurements. In the field of applied science a device based on single impurities is the ultimate limit of electronics miniaturization. At present, two main techniques are exploited in order to reach a single impurity resolution: scanning tunneling microscopy Yakunin et al. (2004) and micro-photoluminescence. On the one hand the optical methods have advantage over tunneling measurements due to absence of the surface influence. On the other hand the resolution of optical measurements is fundamentally restricted by the diffraction limit. The photon wavelength has to be smaller than the average distance between impurities. The band gap of typical semiconductors is about 1 eV, and therefore the corresponding doping concentration should not exceed cm-3 for 3D or cm-2 for 2D systems. At present, the spectroscopy of single semiconductor nanostructures such as quantum dots (QD) is well developed Grundmann et al. (1995). The obvious approach is to dope a single QD with an impurity atom. Experiments of this kind were realized for CdTe Besombes et al. (2004) and InAs Kudelski et al. (2007) QDs doped with Mn. However, an interpretation of experimental results in QD systems is hampered by the fact that such parameters as a dot size, shape, chemical composition as well as an impurity position inside the QD are randomly distributed across QD ensemble. It makes necessary to use a lot of additional parameters in the theoretical description of experimental results Léger et al. (2007); Krebs et al. (2009).
In the present article, we study a narrow GaAs/AlGaAs QW doped with beryllium in order to optically explore single impurities. Usually, the single emitters in such systems are studied via sub-micron apertures or mesa structures formed on a sample surface Gammon et al. (1996); Strauf et al. (2002). To reach the single impurity resolution here, we do not use any preprocessing of the samples but optimize the doping process instead. The smallest controllable sheet impurity density in our experiments is about cm-2. This number does not meet the diffraction limit condition, but nonetheless can serve a purpose in the same way as was first realized in the spectroscopy of single organic molecules Moerner and Kador (1989). The point is to put emitters in a media that randomly changes the emitters energy and to employ a spectral resolution in addition to spatial one. It is well known that fluctuations in a QW width lead to an inhomogeneous spectral broadening of the exciton photoluminescence due to significant variations of the effective bandgap Weisbuch et al. (1981). Assuming that the energy broadening corresponds to a Gaussian shape of photoluminescence line, let us consider the low-energy tail of spectrum. For the Gaussian distribution a probability that the transition energy is in the range between 2 and 3 standard deviations from the distribution maximum is about 1%. Therefore we can reach the necessary small sheet density cm-2 of impurity related single optical emitters, if we examine a lower-energy tail in the photoluminescence of an inhomogeneously broadened ensemble of the impurities.
The interface roughness leads to lateral asymmetry and affects the energy structure of excitons Gammon et al. (1996); Goupalov et al. (1998). But if a radius of an impurity-bound exciton is smaller than a scale of the roughness, we can neclect the lateral asymmetry and consider such an exciton in a pure 2D environment. This allows us to significantly reduce the number of fitting parameters in comparison with the case of doped QDs Léger et al. (2007); Krebs et al. (2009).
This article is organized as follows: we describe the sample growth, the characterization procedure and micro-photoluminescence data in Sec. II. In Sec. III we present a theoretical model of the acceptor-bound exciton which includes the QW confinement. A comparison of theoretical calculation with obtained and previously published experimental data is discussed in Sec. IV.
II Experiment
We grew by molecular beam epitaxy three GaAs/AlxGaAs QW structures with the QW width of 3.7 nm and the Al content in the barriers x=0.25. The samples were doped with Be acceptors inside the QW. They have similar design and differ only in the Be doping mode and sheet impurity density, as shown in Table 1. In two samples the QW is -doped in the middle, while in the third we use uniform doping of the QW with 1-ML-thick undoped spacers at both interfaces. We adjusted the barrier height in order to ensure an effective band-to-band absorption of a pumping light inside the barriers.
| Sample No. | Substrate C | GaAs buffer | AlxGaAs x=0.25 | GaAs | GaAs:Be | GaAs | AlxGaAs x=0.25 | GaAs |
|---|---|---|---|---|---|---|---|---|
| S1 | undoped GaAs | 0.25m | 100 nm | 7 ML | 3”, C, cm-2 | 6 ML | 100 nm | 20 nm |
| S2 | p-type GaAs | 0.25m | 100 nm | 7 ML | 3”, C, cm-2 | 6 ML | 100 nm | 20 nm |
| S3 | undoped GaAs | 0.25m | 100 nm | 1 ML | 11 ML, C, cm-2 | 1 ML | 100 nm | 20 nm |
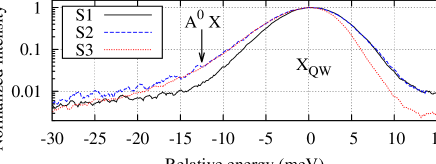
We use macro-photoluminescence measurements at K in order to characterize the grown samples and to establish the presence of beryllium inside the QW. The samples were pumped with a 660 nm diode laser via an optical fiber with the cross section of 0.1 mm2, macro-luminescence spectra were collected through the same fiber. We expect that the beryllium dopants reveal itself as an additional low-energy broadening of the QW related photoluminescence line due to an appearance of the acceptor-bound excitons Holtz et al. (1989) Samples S2 and S3 with more intensive doping indeed demonstrate the expected low-energy broadening as it shown in Fig. 1. The micro-photoluminescence measurements show that these tails consist of numerous narrow lines. In order to distinguish the micro-photoluminescence lines due to the acceptor-bound excitons from the lines of different origin, we use the rich energy structure of complex Holtz et al. (1993) as a spectral fingerprint.

We carry out micro-photoluminescence measurements at 5 K on the setup with about 1m spatial and eV energy resolution using HeNe laser as a pump source. Figure 2 shows three characteristic spectra which were measured at different spots on the surface of our samples. The strong photoluminescence line at 1.65–1.66 eV corresponds to recombination of excitons inside the QW () and it looks the same for all the samples, while the low-energy side of the spectrum presents a wide variety of results. We observe mostly spectra of type a) on the sample S1 with the lowest doping concentration. There are no evidences of impurities at the low-energy tail in panel a). The sample S3 shows a strong non-uniformity across the surface: most of the sample surface corresponds to the type a) while less than 10% of the surface gives the spectra of type c). The spectrum in panel c) contains an impurity related luminescence at the low-energy side, but the luminescence lines are quite broad and overlap each other. The sample S2 is the one most suitable for micro-photoluminescence measurements. We observe the spectra of type b) with strong narrow lines at the low-energy tail of the sample S2 photoluminescence. Below in the text we discuss results which were obtained on this sample.
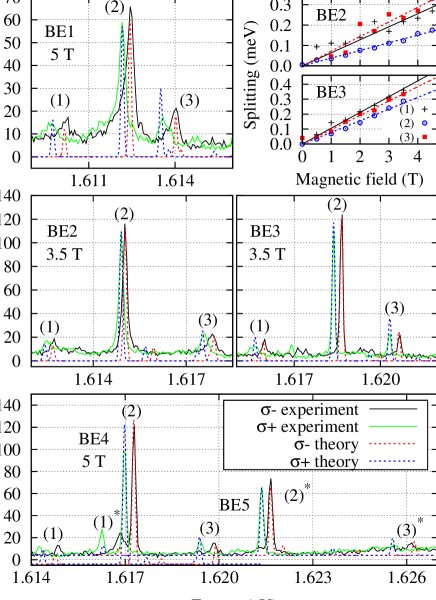
In trying to find out if there are any distinctive peculiarities in the micro-photoluminescence spectra, we carry out measurements in the applied magnetic field in Faraday geometry. Amongst manifold combinations of luminescence lines we observe a kind of repeating pattern in polarized photoluminescence spectra. It consists of one strong single luminescence line and two weak adjacent satellites which are split by magnetic field in doublets denoted as (1), (2) and (3) in Fig. 3. It is noteworthy that a Zeeman splitting of the satellites is 1.5–2 times stronger than a splitting of the main line. In order to give a reliable interpretation of the results we develop a theoretical model of an acceptor-bound exciton in which we take into account an interparticle exchange Schmidt et al. (1975); Pikus and Averkiev (1981), the QW confinement Holtz et al. (1993) and the magnetic field.
III Theory
In order to obtain an energy structure of acceptor-bound exciton inside a QW, we use a model Hamiltonian:
| (1) |
where and are the hole-hole and the electron-hole exchange energies, respectively, and is a splitting of the localized hole state due to a QW confinement. Here () and stand for an angular momentum of the holes and the electron, respectively. We use a spherical model of the localized hole states Baldereschi and Lipari (1973) and consider only the ground state with momentum . The wavefunction of two indistinguishable holes must be antisymmetric, therefore only states with total angular momentum are present. In diamond-like semiconductors the hole-hole exchange is a ferromagnetic interaction (), therefore a state with the largest total angular momentum is the ground one Averkiev and Rodina (1993). The electron-hole exchange interaction between these two holes and the electron with leads to the emergence of a three-particle complex with total angular momentum . This interaction is also ferromagnetic () in GaAs/AlGaAs QWs Gammon et al. (2001); it means that the “dark” state of the free exciton is the ground state. An energy splitting due to the QW confinement is negative () which corresponds to as a ground hole state. The order of levels in the bulk complex () depends on the ratio between and . We obtain all the three-particle wave functions , , , , and analitically using the usual procedure of angular momentum coupling Landau and Lifshits (1965). Here the upper index is a full angular momentum of the state while the lower one is its projection. The energy levels of complex are given by solution of Schrödinger equation with Hamiltonian (1) at .
| (2) |
The QW potential leads to the mixing of levels with angular momentum projection keeping other levels constant. Using , , functions as a basis we can write the Hamiltonian for three states with :
| (3) |
We obtain the energy levels () and the corresponding wave functions as a solution of the Hamiltonian (3) eigenvalue problem. Figure 4 depicts the obtained energy scheme of complex.

Assuming that Zeeman energy is much smaller than all the energy parameters of the system, we find the Zeeman splitting of levels in the first order of perturbation theory. For simplicity sake we take the electron g-factor , which is true for narrow GaAs/AlGaAs QWs Yugova et al. (2007). Zeeman splitting is described by the Hamiltonian:
| (4) |
where is a hole g-factor of the initial state. Let us obtain all the g-factors of the acceptor-bound exciton states normalized to the angular momentum 1/2:
The g-factors of mixed states depend on the eigenvector coefficients (, ):
| (5) |
The final state after the recombination is a neutral acceptor . The final state is also split by the QW potential Zhao et al. (2001) with the same :
| (6) |
The four nondegenerate states of produced by a magnetic field are:
| (7) | |||
| (8) |
where is a g-factor of the final state.
Knowing the energy of the initial and final states we can establish all transition energies as
| (9) |
where is an effective band gap including all the confinement shifts and the exciton binding energy. In order to obtain oscillator strengths and polarizations of the transitions we use the usual selection rules combined with Clebsch-Gordan coefficients that couple spins of complex.
IV Discussion
Figure 3 shows a set of the circularly polarized micro-photoluminescence spectra which were measured at different spots on the sample in applied magnetic field. As mentioned above, all the spectra match a repetitive pattern: a strong line with two accompanying satellites. According to our model the strongest photoluminescence lines which are denoted as (1), (2) and (3) correspond to transitions , and , respectively. The most intense line (2) originated from the ground state of complex while satellites are due to the subsequent degenerate state. The energy spacing between (1) and (3) lines is equal to parameter of our model. Sets of the fitting parameters of all spectra presented in Fig. 3 are compiled in the table II under the labels BE1–BE5.
| No. | (meV) | (meV) | (meV) | (K) | ||
|---|---|---|---|---|---|---|
| BE1 | 20 | |||||
| BE2 | 30 | |||||
| BE3 | 20 | |||||
| BE4 | 20 | |||||
| BE5 | 50 | |||||
| BE6 | 60 |
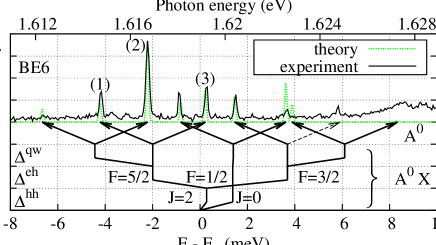
Another characteristic feature of our model comes from a fact that a radiative recombination of acceptor-bound exciton occurs via transitions between a multiplet of initials states and only two available final states. It means that a few pairs of the spectral line with an equal spacing of can be present in the spectrum of the acceptor-bound exciton recombination. Figure 5 depicts an experimental spectrum which contains three pairs with the similar energy splitting of meV. Assuming that the most intensive line in the spectrum is a transition we successfully describe all other optical transitions using our 3-parameter fit at zero magnetic field. In order to fit the transition intensities we also take into account an equilibrium probability to find the complex in a certain initial state using an effective bath temperature as a fourth parameter. The corresponding fit parameters are listed in the table II denoted by BE6.
Let us compare the values of parameters with published results of other experiments. Using equations (2) we extract the values meV and meV from photoluminescence data obtained on the bulk GaAs material Schmidt et al. (1975). It is well known that a quantum confinement significantly enhances the electron-hole exchange in nanostructures Goupalov and Ivchenko (1998); Takagahara (1993), therefore our fitted values of exchange parameters and seem reasonable. The typical effective temperature of recombining excitons is about K in narrow GaAs/AlGaAs QWs Colvard et al. (1989) in accordance with our results. We obtain relatively high effective temperature K for a couple of measured spectra which means that the local exciton lifetime can be comparable to the time of energy relaxation. The QW splitting and g-factor of neutral acceptors were directly measured via spin-flip Raman scattering Sapega et al. (1994). Our g-factor values are comparable with those from Sapega et al. (1994); the discrepancy is due to using the model fit instead of direct measurement. We have a good agreement of values with the data from Sapega et al. (1994) if we take into account the strong fluctuation of depending on the acceptor position with respect to the barrier.
Such a strong dependance of on coordinate of an individual acceptor makes possible to establish a position of impurity in the growth direction. Lateral coordinates of an impurity in the quantum well could be established within one-nanometer accuracy using super-resolution optical technique which is well developed for the single molecule spectroscopy Thompson et al. (2002). An application of these methods could provide unprecedented possibilities to establish exact atomic coordinates of impurities inside the crystal lattice and to explore its spin and energy structure, combining advantages of optical spectroscopy with the ultimate spatial accuracy of the scanning tunneling microscopy.
In conclusion, we report photoluminescence measurements of excitons bound to single beryllium acceptors in GaAs/AlGaAs QWs. In order to describe our results we use a simple theoretical model of an acceptor-bound exciton confined in the QW. The model includes the interparticle exchange. The obtained parameter values of our model are in a good agreement with previously published data and accurately describe a complex spectral signature of the single impurity in radiative recombination.
Acknowledgements.
We acknowledge funding from Russian Science Foundation. P.V.P., N.S.A., P.M.K. and A.Yu.S. were supported by project 14-42-00015 (experiments and general discussion). I.A.K., G.V.K. and Yu.L.I. were supported by project 14-12-00255 (theory, sample growth and characterization).References
- Koenraad and Flatté (2011) P. M. Koenraad and M. E. Flatté, Nat. Mater. 10, 91 (2011).
- Besombes et al. (2004) L. Besombes, Y. Léger, L. Maingault, D. Ferrand, H. Mariette, and J. Cibert, Phys. Rev. Lett. 93, 207403 (2004).
- Kudelski et al. (2007) A. Kudelski, A. Lemaître, A. Miard, P. Voisin, T. C. M. Graham, R. J. Warburton, and O. Krebs, Phys. Rev. Lett. 99, 247209 (2007).
- Yakunin et al. (2004) A. M. Yakunin, A. Y. Silov, P. M. Koenraad, J. H. Wolter, W. Van Roy, J. De Boeck, J.-M. Tang, and M. E. Flatté, Phys. Rev. Lett. 92, 216806 (2004).
- Grundmann et al. (1995) M. Grundmann, J. Christen, N. N. Ledentsov, J. Böhrer, D. Bimberg, S. S. Ruvimov, P. Werner, U. Richter, U. Gösele, J. Heydenreich, V. M. Ustinov, A. Y. Egorov, A. E. Zhukov, P. S. Kop’ev, and Z. I. Alferov, Phys. Rev. Lett. 74, 4043 (1995).
- Léger et al. (2007) Y. Léger, L. Besombes, L. Maingault, and H. Mariette, Phys. Rev. B 76, 045331 (2007).
- Krebs et al. (2009) O. Krebs, E. Benjamin, and A. Lemaitre, Phys. Rev. B 80, 165315 (2009).
- Gammon et al. (1996) D. Gammon, E. S. Snow, B. V. Shanabrook, D. S. Katzer, and D. Park, Phys. Rev. Lett. 76, 3005 (1996).
- Strauf et al. (2002) S. Strauf, P. Michler, M. Klude, D. Hommel, G. Bacher, and A. Forchel, Phys. Rev. Lett. 89, 177403 (2002).
- Moerner and Kador (1989) W. E. Moerner and L. Kador, Phys. Rev. Lett. 62, 2535 (1989).
- Weisbuch et al. (1981) C. Weisbuch, R. Dingle, A. Gossard, and W. Wiegmann, Solid State Comm. 38, 709 (1981).
- Goupalov et al. (1998) S. Goupalov, E. Ivchenko, and A. Kavokin, Superlattices and Microstructures 23, 1205 (1998).
- Holtz et al. (1989) P. O. Holtz, M. Sundaram, J. L. Merz, and A. C. Gossard, Phys. Rev. B 40, 10021 (1989).
- Holtz et al. (1993) P. O. Holtz, Q. X. Zhao, B. Monemar, M. Sundaram, J. L. Merz, and A. C. Gossard, Phys. Rev. B 47, 15675 (1993).
- Schmidt et al. (1975) M. Schmidt, T. N. Morgan, and W. Schairer, Phys. Rev. B 11, 5002 (1975).
- Pikus and Averkiev (1981) G. Pikus and N. Averkiev, Pis’ma Z. Eksp. Teor. Fiz. 34, 28 (1981), [Sov. Phys. JETP Lett. 34, 26 (1981)].
- Baldereschi and Lipari (1973) A. Baldereschi and N. O. Lipari, Phys. Rev. B 8, 2697 (1973).
- Averkiev and Rodina (1993) N. Averkiev and A. Rodina, Fiz. Tverd. Tela 35, 1051 (1993), [Phys. Solid State, 35, 538–545, (1993)].
- Gammon et al. (2001) D. Gammon, A. L. Efros, T. A. Kennedy, M. Rosen, D. S. Katzer, D. Park, S. W. Brown, V. L. Korenev, and I. A. Merkulov, Phys. Rev. Lett. 86, 5176 (2001).
- Landau and Lifshits (1965) L. D. Landau and E. M. Lifshits, Quantum mechanics (nonrelativistic theory) Vol. 3, 2nd edn. (Pergamon press, Oxford, 1965).
- Yugova et al. (2007) I. A. Yugova, A. Greilich, D. R. Yakovlev, A. A. Kiselev, M. Bayer, V. V. Petrov, Y. K. Dolgikh, D. Reuter, and A. D. Wieck, Phys. Rev. B 75, 245302 (2007).
- Zhao et al. (2001) Q. X. Zhao, S. Wongmanerod, M. Willander, P. O. Holtz, S. M. Wang, and M. Sadeghi, Phys. Rev. B 63, 195317 (2001).
- Goupalov and Ivchenko (1998) S. Goupalov and E. Ivchenko, J. Cryst. Growth 184-185, 393 (1998).
- Takagahara (1993) T. Takagahara, Phys. Rev. B 47, 4569 (1993).
- Colvard et al. (1989) C. Colvard, D. Bimberg, K. Alavi, C. Maierhofer, and N. Nouri, Phys. Rev. B 39, 3419 (1989).
- Sapega et al. (1994) V. F. Sapega, T. Ruf, M. Cardona, K. Ploog, E. L. Ivchenko, and D. N. Mirlin, Phys. Rev. B 50, 2510 (1994).
- Thompson et al. (2002) R. E. Thompson, D. R. Larson, and W. W. Webb, Biophys. J. 82, 2775 (2002).