The Most Massive Galaxies and Black Holes Allowed by CDM
Abstract
Given a galaxy’s stellar mass, its host halo mass has a lower limit from the cosmic baryon fraction and known baryonic physics. At , galaxy stellar mass functions place lower limits on halo number densities that approach expected CDM halo mass functions. High-redshift galaxy stellar mass functions can thus place interesting limits on number densities of massive haloes, which are otherwise very difficult to measure. Although halo mass functions at are consistent with observed galaxy stellar masses if galaxy baryonic conversion efficiencies increase with redshift, JWST and WFIRST will more than double the redshift range over which useful constraints are available. We calculate maximum galaxy stellar masses as a function of redshift given expected halo number densities from CDM. We apply similar arguments to black holes. If their virial mass estimates are accurate, number density constraints alone suggest that the quasars SDSS J10440125 and SDSS J010013.02280225.8 likely have black hole mass — stellar mass ratios higher than the median relation, confirming the expectation from Lauer bias. Finally, we present a public code to evaluate the probability of an apparently CDM-inconsistent high-mass halo being detected given the combined effects of multiple surveys and observational errors.
keywords:
early Universe; galaxies: haloes; quasars: supermassive black holes1 Introduction
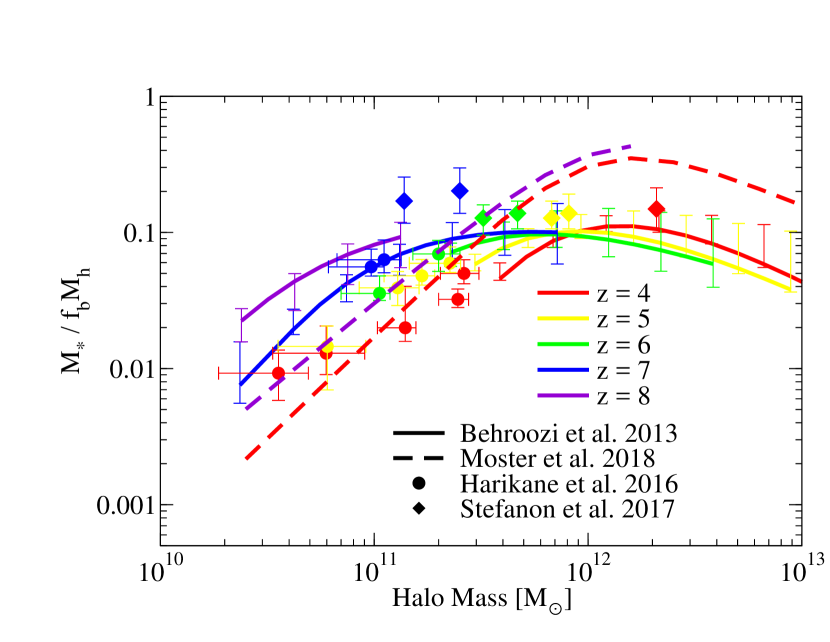
In the framework of Lambda Cold Dark Matter (CDM), galaxies form at the centres of dark matter haloes (see Silk & Mamon, 2012; Somerville & Davé, 2015, for reviews). The ratio of galaxy stellar mass to halo mass has an absolute maximum at the cosmic baryon fraction (; Planck Collaboration et al. 2016a). In practice, stellar feedback processes limit the maximum fraction of baryons converted to (Moster et al., 2010; Moster et al., 2013, 2018; Behroozi et al., 2010, 2013) even when adopting a Salpeter (1955) initial mass function (IMF). At , this maximum fraction is never achieved for massive haloes (), due to inefficient cooling (Lu et al., 2011) and feedback from supermassive black holes (Silk & Rees, 1998). At , however, comparisons of galaxy and halo number densities suggest that massive haloes can reach from 10–40% typical integrated efficiencies in converting baryons into stars, again depending on assumptions for the IMF and luminosity—stellar mass conversions (Behroozi et al., 2013; Behroozi & Silk, 2015; Finkelstein et al., 2015; Sun & Furlanetto, 2016; Moster et al., 2018).
Conversely, an observed galaxy mass () places a lower limit on its host halo mass (). CDM alone implies that , and known baryonic physics would give more stringent limits depending on the assumed maximum conversion efficiency. This fact has been used in Steinhardt et al. (2016) to argue that galaxy number densities at are already inconsistent with CDM. Although we disagree with their assumptions (especially that the ratio cannot increase at ) and therefore also their conclusions, the basic principle that galaxy number densities constrain halo number densities is well-established.
As galaxy number densities are consistent with halo number densities for redshifts (Behroozi et al., 2013), we compute galaxy mass limits corresponding to expectations from typical CDM baryon fraction limits over , observable with future infrared space-based telescopes (e.g., JWST, the James Webb Space Telescope, and WFIRST, the Wide-Field InfraRed Survey Telescope).
Similarly, useful physical thresholds can be calculated for supermassive black holes (SMBHs). The number density of a given quasar sample places a lower limit on the number density of their host haloes, which in turn limits the maximum average host halo mass in CDM (see also Haiman & Loeb, 2001). This then limits the maximum average host galaxy mass (via ). Hence, given the number density of black holes above a certain mass, we can derive a lower limit for their ratios without requiring observations of the host galaxy. The current claimed maximum ratio is 15% (van den Bosch et al., 2012; Seth et al., 2014). In comparison, the highest median relations for the ratio at (Kormendy & Ho, 2013; Savorgnan & Graham, 2016) give % for (after conversion to a Salpeter 1955 IMF).
Throughout, we assume a flat, CDM cosmology with , , , , , corresponding to the best-fit Planck cosmology (Planck Collaboration et al., 2016a), as well as a Salpeter (1955) IMF. For halo masses, we use the virial overdensity definition of Bryan & Norman (1998).
2 Methodology
We adopt cumulative halo mass functions () from Behroozi et al. (2013) and define a redshift-dependent maximum cumulative galaxy mass function:
| (1) |
is the CDM upper limit on the true stellar mass function—equivalently, it is the expected collapsed gas mass function for CDM. In practice, a given survey volume may contain a higher number density due to sample variance or observational errors, especially when multiple surveys are conducted. Appendix A offers a simple method and code to test whether a given outlier is significantly discrepant from the CDM prediction.
Given that median stellar mass fractions already reach up to at (Fig. 1) with the assumption of a Salpeter (1955) IMF, and that measurements of scatter in stellar mass at fixed halo mass are typically dex (e.g., Reddick et al., 2013), it is plausible that some galaxies could reach nearly conversion efficiencies modulo the effects of stellar mass loss (20-30%; Conroy et al. 2009).
We also define two cumulative supermassive black hole (SMBH) mass functions:
| (2) | |||||
| (3) |
If exceeds , the black holes must have observed ratios of 15%, regardless of galaxy formation physics. If exceeds , then some of the SMBHs must have observed ratios above the median relation, again regardless of galaxy formation physics. Specifically, one expects at least a fraction
| (4) |
of the SMBHs to have higher-than-median ratios. This is not necessarily a surprising finding; indeed, any -selected sample will have at least half of the sample higher than the median relation. However, a high could suggest evolution in the relation or in the scatter in that relation (including observational errors) to high redshifts.
3 Results
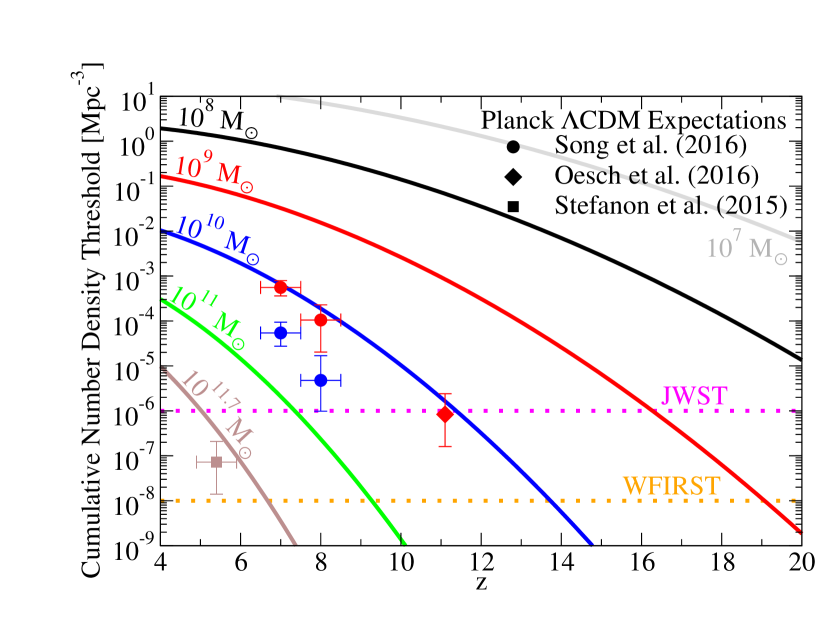
For arbitrary future surveys, Fig. 2 also shows cumulative number density thresholds as a function of galaxy stellar mass from to , including a comparison to the massive galaxies in Stefanon et al. (2015) and Oesch et al. (2016) and to the stellar mass functions in Song et al. (2016). For Oesch et al. (2016), we use their estimated search volume of Mpc. As in Fig. 1, more massive galaxies tend to reach higher ratios, so their number densities more closely approach the expected collapsed gas mass function from CDM.
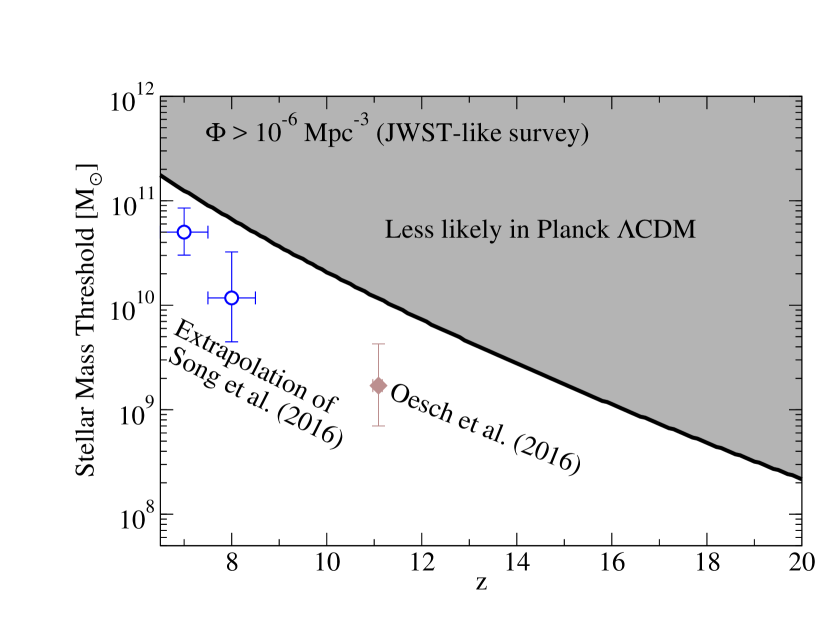
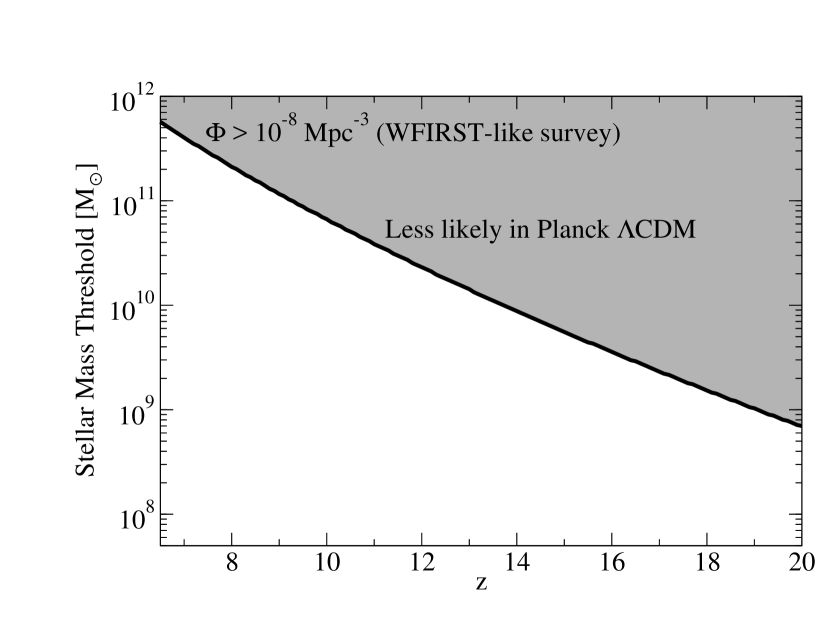
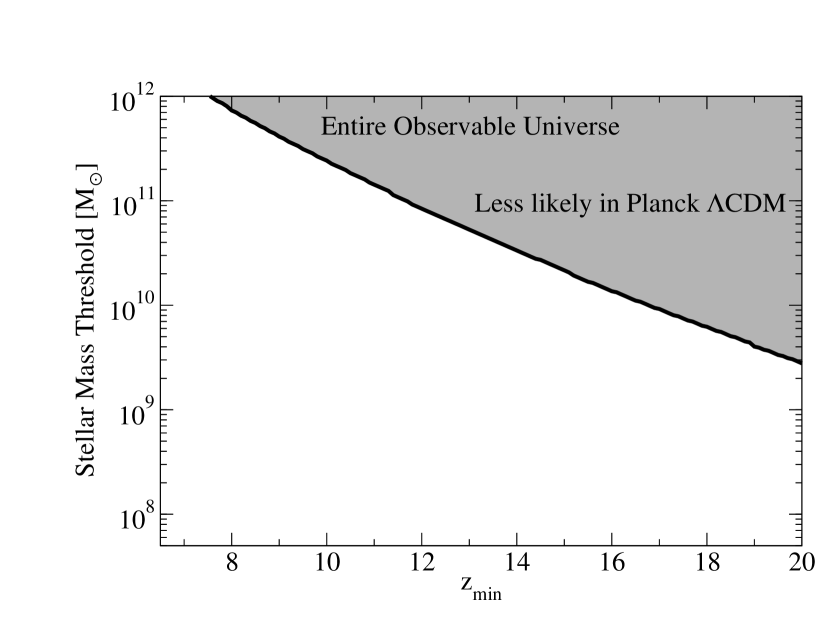
Similar to CANDELS (Koekemoer et al., 2011; Grogin et al., 2011) with Hubble, a future JWST survey may probe galaxy cumulative number densities down to Mpc-3. WFIRST has a larger field of view, so it may reach cumulative number densities of Mpc-3. For these two threshold densities, we plot (i.e., the stellar mass at which ) in Fig. 2. For comparison, we also plot threshold stellar masses for galaxies at from extrapolations of Song et al. (2016)111Extrapolations for Song et al. (2016) were derived from the posterior distribution of their Schechter function parameters, kindly provided by M. Song. and the galaxy from Oesch et al. (2016). Finally, we calculate the expected largest galaxy in the Universe—i.e., using a cumulative number density such that only one object should exist in the volume of the observable Universe at all redshifts . These volumes are potentially accessible with all-sky surveys like SPHEREx (Doré et al., 2014). We note that finding a larger galaxy is possible as a result of both sample variance and observational errors (see Appendix A).
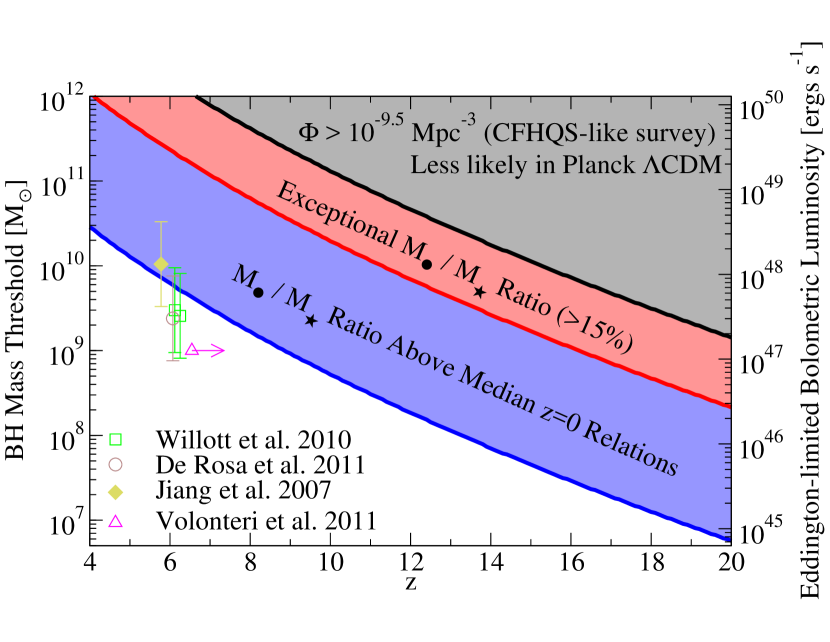
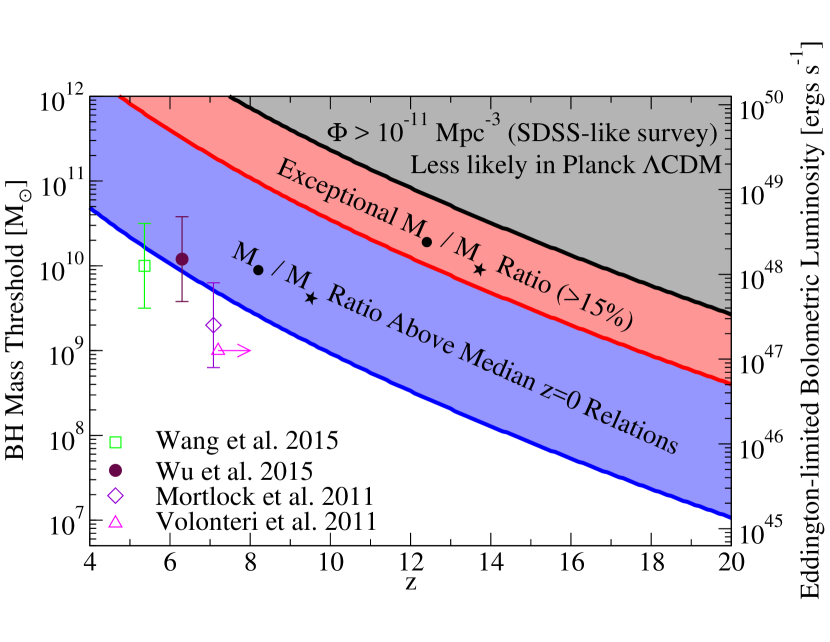
Threshold masses for black holes are shown in Fig. 3 and compared to the most massive known quasars and blazars at (Jiang et al., 2007; Willott et al., 2010; Volonteri et al., 2011; De Rosa et al., 2011; Mortlock et al., 2011; Wu et al., 2015; Wang et al., 2015). As bright quasars are detectable in large-area photometric surveys (e.g., the SDSS, Pâris et al. 2014, and the CFHQS, Willott et al. 2007), we calculate mass thresholds at cumulative number densities of Mpc-3 and Mpc-3. If their virial mass estimates are correct, two quasars, SDSS J10440125 (Jiang et al., 2007) and SDSS J010013.02280225.8 (Wu et al., 2015) likely have ratios larger than the relation even if their host galaxies have 100% ratios. Because blazars have uncertain beaming corrections, we show lower limits assuming from Fig. 5 in Volonteri et al. (2011).
4 Discussion and Conclusions
Several factors limit attempts to rule out CDM with galaxy or black hole masses, including observational errors and multiple comparisons (see Appendix A). For galaxies, there are significant uncertainties in converting luminosity to stellar mass (Conroy et al., 2009; Behroozi et al., 2010); besides systematic offsets, these also induce Eddington/Malmquist bias (Eddington, 1913; Malmquist, 1922) that artificially inflates the number densities of massive galaxies (Behroozi et al., 2010; Caputi et al., 2011; Grazian et al., 2015). Also present are uncertainties in photo- codes and priors; improperly chosen, the latter can similarly inflate massive galaxy counts (Stefanon et al., 2015). Just as problematic are multiple peaks in the posterior distribution of , as for the massive galaxy in Stefanon et al. (2015). We note also the relatively high lensing optical depth at , which further boosts the apparent number of massive galaxies (Mason et al., 2015). For a full discussion of other sources of systematic error affecting the stellar mass – halo mass relation, we refer readers to Behroozi et al. (2010).
Black hole masses are also subject to many uncertainties (see Peterson, 2014, for a review), and virial masses in particular may be overestimates (Shankar et al., 2016). Selecting the largest black holes from a sample with uncertain masses also imposes Eddington bias. Nonetheless, our limits agree with other approaches that infer large black hole mass — stellar mass ratios (Targett et al., 2012; Venemans et al., 2016), which are expected due to selecting for luminous, massive black holes (Lauer et al., 2007; Volonteri & Stark, 2011). We note in passing that blazars are also subject to the same number density constraints; however, estimates of their number densities are made more complicated due to uncertain beaming factors (Ghisellini et al., 2009).
Even so, it is exciting that the highest stellar masses observed in Fig. 2 are so close to the limits expected for CDM. This suggests that high-redshift galaxy surveys will give lower bounds on the evolution of the halo mass function at , which is otherwise very difficult to measure. Combined with constraints on primordial non-Gaussianities and dark matter from faint galaxies (Habouzit et al., 2014; Governato et al., 2015), JWST and WFIRST will place very interesting limits on early Universe cosmology. For SMBHs, Fig. 3 provides a simple estimate of whether a given requires an anomalously high ratio, potentially bolstering the case for follow-up observations.
Finally, we cite examples of “unusual” physics that could be invoked if future observations cross the thresholds outlined here. We refer to ideas beyond usual prescriptions for supernova feedback and AGN (active galactic nuclei) quenching that limit star formation in current cosmological and zoom-in simulations. Specifically, we mention positive feedback from AGN (as a precursor to the negative feedback observed via AGN-driven massive gas outflows; Gaibler et al. 2012; Ishibashi & Fabian 2012; Silk 2013; Wagner et al. 2016), examples of which are beginning to be found (Zinn et al., 2013; Cresci et al., 2015; Salomé et al., 2015), and a significant duty cycle of hyper-Eddington accretion, increasingly invoked to solve SMBH growth problems at high redshift (Jiang et al., 2014; Volonteri et al., 2015; Inayoshi et al., 2016). These processes may be able to increase the ratio of stellar mass or black hole mass to total baryonic mass up to the limit imposed by CDM (i.e., the cosmic baryon fraction). Unusual physics that allows accelerated halo growth in overdense regions (e.g., non-gaussianities as in Pillepich et al. 2010, although standard models are now strongly limited by Planck Collaboration et al. 2016b) could also result in overmassive galaxies and black holes that exceed standard CDM limits.
Acknowledgements
We thank Robert Antonucci, Andrea Cimatti, Alister Graham, Ryan Trainor, Marta Volonteri, and the anonymous referee for many extremely helpful comments that greatly improved this paper. PB was partially supported by program number HST-HF2-51353.001-A, provided by NASA through a Hubble Fellowship grant from the Space Telescope Science Institute, which is operated by the Association of Universities for Research in Astronomy, Incorporated, under NASA contract NAS5-26555. JS acknowledges support from ERC Project No. 267117 (DARK) hosted by Pierre et Marie Curie University (UPMC) - Paris 6, France.
Appendix A Estimating Outlier Probability
When a halo is found in a survey with mass , it is often labelled “too massive for CDM” if the expected number of haloes is less than some threshold :
| (5) |
where is the survey volume and is the survey volume-averaged halo number density (per unit mass) for the adopted CDM cosmology.
The true significance is always weaker than would imply; this is due to both observational errors and multiple comparisons. For extremely rare objects, sample variance from large-scale modes is extremely subdominant to variance from Poisson statistics (see, e.g., the cosmic variance calculator in Trenti & Stiavelli, 2008); hence, we exclude the former effect from our estimate here. For a single survey, the Poisson chance of observing a halo of mass or larger is
| (6) |
where is the true halo mass, is the observed halo mass estimate, and is the probability density of observing a halo mass for a true underlying halo mass .
With multiple surveys, the chance increases that one of the surveys will have an “outlier” even in a standard CDM universe. For the true probability of an -outlier (according to the definition in Eq. 5) occurring in at least one of the surveys, we can use the Dunn-Šidák assumption (i.e., multiple fully independent surveys; Šidák 1967) to estimate:
| (7) |
where is the equivalent of Eq. 6 for the th survey, is the th survey’s volume, and is the inverse halo cumulative number density for the th survey. In the regime where , this is nearly identical to the Bonferroni limit (; Dunn 1958).
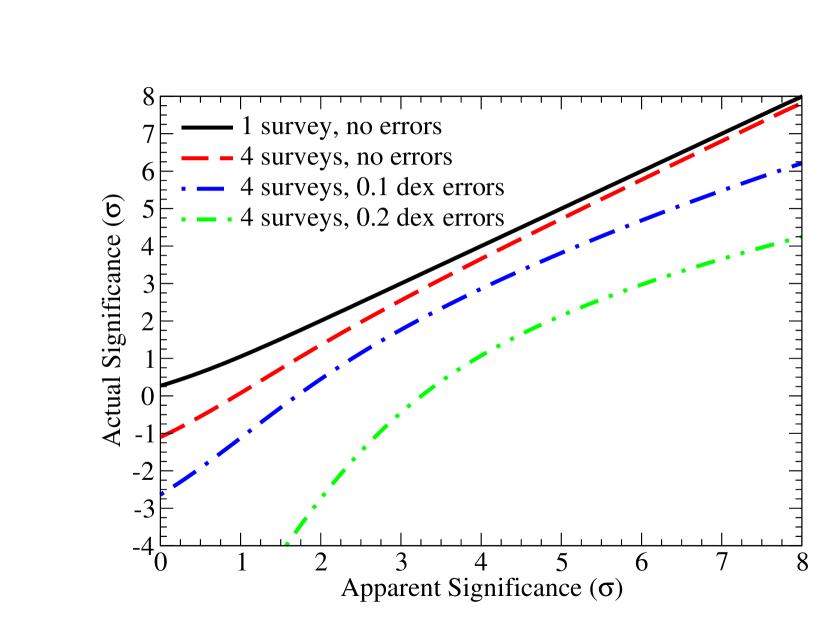
To encourage correcting for these effects, we developed a public code implementing Eqs. 6-7.222https://bitbucket.org/pbehroozi/lcdm-probability As an example, we compute the relationship between true outlier significance and apparent (Eq. 5) significance, assuming that an overmassive object were to be found in at least one of the following surveys:
| Description | Area (deg2) | Redshifts |
|---|---|---|
| SDSS-like | 14555 | |
| SPT-like | 2500 | |
| EUCLID-like | 15000 | |
| LSST-like | 20000 |
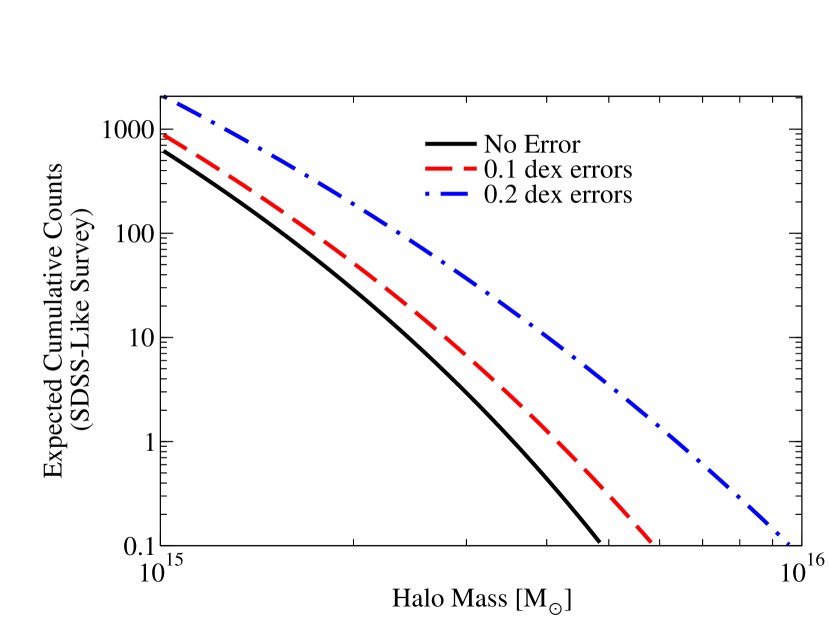
We show results for a range of log-normal observational errors in Fig. 5, presented in terms of more familiar -units.333Formally, . For a single survey with no errors, the apparent significance (Eq. 5) is close to the true significance (Eq. 6), with the difference arising from the skewness of the Poisson distribution (e.g., an object with average number density of per unit volume will be found in less than half of all such unit volumes, because some volumes will have multiple objects). Adding multiple surveys as in the table above increases the chance of detecting a massive object in one of the surveys, as expected. Observational errors result in a very strong effect that is more pronounced for larger surveys. The effect is analogous to a point-spread function blurring a sharp image; convolving the steep halo mass function with the observational error distribution results in a shallower falloff (e.g., Fig. 5) and therefore an inflated number density of observed massive haloes compared to the underlying true number density (see also Eddington bias; Eddington 1913).
References
- Behroozi & Silk (2015) Behroozi P. S., Silk J., 2015, ApJ , 799, 32
- Behroozi et al. (2010) Behroozi P. S., Conroy C., Wechsler R. H., 2010, ApJ , 717, 379
- Behroozi et al. (2013) Behroozi P. S., Wechsler R. H., Conroy C., 2013, ApJ , 770, 57
- Bryan & Norman (1998) Bryan G. L., Norman M. L., 1998, ApJ , 495, 80
- Caputi et al. (2011) Caputi K. I., Cirasuolo M., Dunlop J. S., McLure R. J., Farrah D., Almaini O., 2011, MNRAS, 413, 162
- Conroy et al. (2009) Conroy C., Gunn J. E., White M., 2009, ApJ , 699, 486
- Cresci et al. (2015) Cresci G., et al., 2015, ApJ , 799, 82
- De Rosa et al. (2011) De Rosa G., Decarli R., Walter F., Fan X., Jiang L., Kurk J., Pasquali A., Rix H. W., 2011, ApJ , 739, 56
- Doré et al. (2014) Doré O., et al., 2014, preprint, (arXiv:1412.4872)
- Dunn (1958) Dunn O. J., 1958, The Annals of Mathematical Statistics, 29, 1095
- Eddington (1913) Eddington A. S., 1913, MNRAS, 73, 359
- Finkelstein et al. (2015) Finkelstein S. L., et al., 2015, ApJ , 810, 71
- Gaibler et al. (2012) Gaibler V., Khochfar S., Krause M., Silk J., 2012, MNRAS, 425, 438
- Ghisellini et al. (2009) Ghisellini G., Foschini L., Volonteri M., Ghirlanda G., Haardt F., Burlon D., Tavecchio F., 2009, MNRAS, 399, L24
- Governato et al. (2015) Governato F., et al., 2015, MNRAS, 448, 792
- Grazian et al. (2015) Grazian A., et al., 2015, A&A , 575, A96
- Grogin et al. (2011) Grogin N. A., et al., 2011, ApJS , 197, 35
- Habouzit et al. (2014) Habouzit M., Nishimichi T., Peirani S., Mamon G. A., Silk J., Chevallard J., 2014, MNRAS, 445, L129
- Haiman & Loeb (2001) Haiman Z., Loeb A., 2001, ApJ , 552, 459
- Harikane et al. (2016) Harikane Y., et al., 2016, ApJ , 821, 123
- Inayoshi et al. (2016) Inayoshi K., Haiman Z., Ostriker J. P., 2016, MNRAS, 459, 3738
- Ishibashi & Fabian (2012) Ishibashi W., Fabian A. C., 2012, MNRAS, 427, 2998
- Jiang et al. (2007) Jiang L., Fan X., Vestergaard M., Kurk J. D., Walter F., Kelly B. C., Strauss M. A., 2007, AJ , 134, 1150
- Jiang et al. (2014) Jiang Y.-F., Stone J. M., Davis S. W., 2014, ApJ , 796, 106
- Koekemoer et al. (2011) Koekemoer A. M., et al., 2011, ApJS , 197, 36
- Kormendy & Ho (2013) Kormendy J., Ho L. C., 2013, ARAA , 51, 511
- Lauer et al. (2007) Lauer T. R., Tremaine S., Richstone D., Faber S. M., 2007, ApJ , 670, 249
- Lu et al. (2011) Lu Y., Kereš D., Katz N., Mo H. J., Fardal M., Weinberg M. D., 2011, MNRAS, 416, 660
- Malmquist (1922) Malmquist K. G., 1922, Meddelanden fran Lunds Astronomiska Observatorium Serie I, 100, 1
- Mason et al. (2015) Mason C. A., et al., 2015, ApJ , 805, 79
- Mortlock et al. (2011) Mortlock D. J., et al., 2011, Nature , 474, 616
- Moster et al. (2010) Moster B. P., Somerville R. S., Maulbetsch C., van den Bosch F. C., Macciò A. V., Naab T., Oser L., 2010, ApJ , 710, 903
- Moster et al. (2013) Moster B. P., Naab T., White S. D. M., 2013, MNRAS, 428, 3121
- Moster et al. (2018) Moster B. P., Naab T., White S. D. M., 2018, MNRAS,
- Oesch et al. (2016) Oesch P. A., et al., 2016, ApJ , 819, 129
- Pâris et al. (2014) Pâris I., et al., 2014, A&A , 563, A54
- Peterson (2014) Peterson B. M., 2014, Space Sci. Rev., 183, 253
- Pillepich et al. (2010) Pillepich A., Porciani C., Hahn O., 2010, MNRAS, 402, 191
- Planck Collaboration et al. (2016a) Planck Collaboration et al., 2016a, A&A , 594, A13
- Planck Collaboration et al. (2016b) Planck Collaboration et al., 2016b, A&A , 594, A17
- Reddick et al. (2013) Reddick R. M., Wechsler R. H., Tinker J. L., Behroozi P. S., 2013, ApJ , 771, 30
- Salomé et al. (2015) Salomé Q., Salomé P., Combes F., 2015, A&A , 574, A34
- Salpeter (1955) Salpeter E. E., 1955, ApJ , 121, 161
- Savorgnan & Graham (2016) Savorgnan G. A. D., Graham A. W., 2016, MNRAS, 457, 320
- Seth et al. (2014) Seth A. C., et al., 2014, Nature , 513, 398
- Shankar et al. (2016) Shankar F., et al., 2016, MNRAS, 460, 3119
- Silk (2013) Silk J., 2013, ApJ , 772, 112
- Silk & Mamon (2012) Silk J., Mamon G. A., 2012, Research in Astronomy and Astrophysics, 12, 917
- Silk & Rees (1998) Silk J., Rees M. J., 1998, A&A , 331, L1
- Somerville & Davé (2015) Somerville R. S., Davé R., 2015, ARAA , 53, 51
- Song et al. (2016) Song M., et al., 2016, ApJ , 825, 5
- Stefanon et al. (2015) Stefanon M., et al., 2015, ApJ , 803, 11
- Stefanon et al. (2017) Stefanon M., Bouwens R. J., Labbé I., Muzzin A., Marchesini D., Oesch P., Gonzalez V., 2017, ApJ , 843, 36
- Steinhardt et al. (2016) Steinhardt C. L., Capak P., Masters D., Speagle J. S., 2016, ApJ , 824, 21
- Sun & Furlanetto (2016) Sun G., Furlanetto S. R., 2016, MNRAS, 460, 417
- Targett et al. (2012) Targett T. A., Dunlop J. S., McLure R. J., 2012, MNRAS, 420, 3621
- Trenti & Stiavelli (2008) Trenti M., Stiavelli M., 2008, ApJ , 676, 767
- Venemans et al. (2016) Venemans B. P., Walter F., Zschaechner L., Decarli R., De Rosa G., Findlay J. R., McMahon R. G., Sutherland W. J., 2016, ApJ , 816, 37
- Volonteri & Stark (2011) Volonteri M., Stark D. P., 2011, MNRAS, 417, 2085
- Volonteri et al. (2011) Volonteri M., Haardt F., Ghisellini G., Della Ceca R., 2011, MNRAS, 416, 216
- Volonteri et al. (2015) Volonteri M., Silk J., Dubus G., 2015, ApJ , 804, 148
- Wagner et al. (2016) Wagner A. Y., Bicknell G. V., Umemura M., Sutherland R. S., Silk J., 2016, Astronomische Nachrichten, 337, 167
- Wang et al. (2015) Wang F., et al., 2015, ApJL , 807, L9
- Willott et al. (2007) Willott C. J., et al., 2007, AJ , 134, 2435
- Willott et al. (2010) Willott C. J., et al., 2010, AJ , 140, 546
- Wu et al. (2015) Wu X.-B., et al., 2015, Nature , 518, 512
- Zinn et al. (2013) Zinn P.-C., Middelberg E., Norris R. P., Dettmar R.-J., 2013, ApJ , 774, 66
- Šidák (1967) Šidák Z., 1967, Journal of the American Statistical Association, 62, 626
- van den Bosch et al. (2012) van den Bosch R. C. E., Gebhardt K., Gültekin K., van de Ven G., van der Wel A., Walsh J. L., 2012, Nature , 491, 729