Light scattering study of the “pseudo-layer” compression elastic constant in a twist-bend nematic liquid crystal
†
Z. Parsouzi1, Shokir A. Pardaev1, C. Welch2, Z. Ahmed2, G. H. Mehl2, A. R. Baldwin1, J. T. Gleeson1, O. D. Lavrentovich3, D. W. Allender1, J. V. Selinger3, A. Jakli3, and S. Sprunt1∗
Received Xth XXXXXXXXXX 20XX, Accepted Xth XXXXXXXXX 20XX
First published on the web Xth XXXXXXXXXX 200X
DOI: 10.1039/b000000x
The nematic twist-bend (TB) phase, exhibited by certain achiral thermotropic liquid crystalline (LC) dimers, features a nanometer-scale, heliconical rotation of the average molecular long axis (director) with equally probable left- and right-handed domains. On meso to macroscopic scales, the TB phase may be considered as a stack of equivalent slabs or “pseudo-layers”, each one helical pitch in thickness. The long wavelength fluctuation modes should then be analogous to those of a smectic-A phase, and in particular the hydrodynamic mode combining “layer” compression and bending ought to be characterized by an effective layer compression elastic constant and average director splay constant . The magnitude of is expected to be similar to the splay constant of an ordinary nematic LC, but due to the absence of a true mass density wave, could differ substantially from the typical value of Pa in a conventional smectic-A. Here we report the results of a dynamic light scattering study, which confirms the “pseudo-layer” structure of the TB phase with in the range Pa. We show additionally that the temperature dependence of at the TB to nematic transition is accurately described by a coarse-grained free energy density, which is based on a Landau-deGennes expansion in terms of a heli-polar order parameter that characterizes the TB state and is linearly coupled to bend distortion of the director.
††footnotetext: 2 Department of Chemistry, University of Hull, Hull HU6 7RX, UK
††footnotetext: 3 Chemical Physics Interdisciplinary Program and Liquid Crystal Institute, Kent State University, Kent, Ohio 44242, USA
1 Introduction
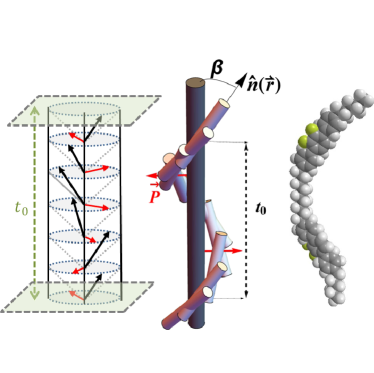
Thermotropic liquid crystals (LCs) exemplify partial ordering in condensed matter; the panoply of distinct phases grows ever richer, challenging both experiment and theory alike to uncover and explain subtleties in the basic ordering mechanisms and properties across various length and time scales. The recently discovered twist-bend (TB) nematic phase 1, 2, 3, 4, 5, 6 is especially remarkable in that it exhibits a molecular scale periodicity even in the absence of a periodic variation in mass density – that is, purely in the context of orientational (nematic) order. The basis for this is believed to be the bent conformation of odd-membered LC dimers (Fig. 1) that usually form the TB phase: The bent shape promotes a structural bend, which can be accommodated without defects provided the molecular orientation also twists. The resulting heliconical structure (Fig. 1) has a notably short pitch ( nm, or a few molecular lengths) and a fairly small cone angle 2, 5, 7. Typically, the dimers are achiral, and domains of left and right-handed helicity coexist.
Various theories have been put forth to explain the formation of the TB phase from a higher-temperature, uniform uniaxial nematic state. These include a theory in which the nematic bend elastic constant becomes negative below the transition temperature 7, 8, 9, inducing a spontaneous bend that is stabilized by twist and by a positive higher-order elastic term, and theories that introduce a vector order parameter 10, 11, e.g., a polarization field, that becomes non-zero in the TB phase, and winds helically with the same nanoscale pitch as the molecular orientation to which it is coupled (Fig. 1). The latter build upon an original suggestion by Meyer 12. These models account for the heliconical microscopic structure of the TB phase via appropriate Landau-deGennes expansions of the free energy in terms of the nematic director field (locally-averaged molecular long axis), , and a polarization (or similar) vector field, which we shall label and take to be dimensionless – e.g., by normalizing to a suitable low-temperature value.
Another way to view the TB phase, which would be valid on length scales long compared to the pitch, is as a phase whose optical, electrical, and mechanical properties are qualitatively similar to those of a smectic-A LC or, perhaps more appropriately given the handedness of the heliconical domains, a chiral smectic-A 13. In this picture, slabs of the TB phase with thickness equal to one pitch are treated as smectic “pseudo-layers” (meaning layers not delineated by a mass density wave). In addition to the Frank elastic constants of the nematic phase, two elastic moduli – one corresponding to pseudo-layer compression () and the other () penalizing angular deviation of the average director from the pseudo-layer normal (or pitch axis) – are needed to describe long wavelength distortions. The label distinguishes the case of “pseudo”-layering from a layering associated with the usual smectic mass density wave.
The two theoretical approaches can be connected by a coarse-graining analysis 13, 14 of the “microscopic” Landau-deGennes models. This analysis, which is similar to the coarse-graining of the helical structure of the cholesteric phase (where ) 15, 16, yields specific predictions for the relation between “macroscopic” elasticities , and the “microscopic” parameters (the pitch wavenumber) and , plus the “bare” values of the Frank elastic constants in the nematic phase. It thereby facilitates a vital test of theory, as most experiments are conducted on length scales much larger than the nanoscale pitch.
In this paper, we report a dynamic light scattering study of the hydrodynamic fluctuation mode that combines pseudo-layer bending and compression in the TB phase. We deduce values of the compression elastic constant, , in the range Pa, or times lower than in the case of a true smectic-A mass density wave. This range agrees with estimates made from high-field magnetic birefringence measurements 17 and rheometry 18 on different TB materials, but contrasts with a recent report, which utilizes a different technique applied to yet other TB-forming compounds 19, 20 and obtains in the range Pa of an ordinary smectic-A LC. Thus, we find in the TB phase to be comparable to values of Pa reported for a tilted smectic (smectic-C) phase below the transition to the smectic-A phase 21, where layer compression can be accommodated by molecular tilt.
Our experimental results for the dispersion and temperature dependence of the hydrodynamic fluctuation mode validate the “pseudo-layer” description and quantitatively support a Landau-deGennes theory of the nematic to TB transition, which invokes a polarization field as the primary order parameter. Additionally, they complement our recent study 14 of nonhydrodynamic modes (and elastic constant ) in the TB phase.
2 Theoretical Background
In the uniform nematic phase, above the transition to the TB phase (temperature ), light scattering probes the conventional, overdamped nematic director modes – namely, the “splay-bend” mode (mode 1) and the “twist-bend” mode (mode 2) – with scattered light intensities and relaxation rates given by 22,
| (1) |
| (2) |
Here () are the Frank elastic constants for splay, twist, and bend distortions of , is the absolute temperature, and are optical factors determined by polarization and geometry-dependent selection rules, and is the fluctuation wavevector (with being the direction of the equilibrium director). The parameters are phenomenological viscosities, which may be expressed in terms of more fundamental nematic viscosity coefficients and the ratio . As we will mainly be concerned with mode 1, we only give the expression for 23:
| (3) |
[See Ref. [23] for definitions of the various viscosity coefficients , (), and ().]
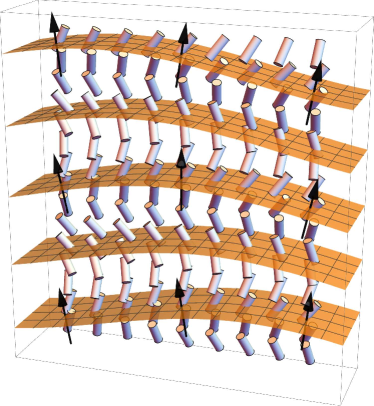
Turning to the TB phase, and based on the analogy to a smectic-A, we expect two fluctuation modes that directly couple to the optic axis: a “slow”, hydrodynamic layer compression-bending mode (or “undulation” mode), with scattering intensity and relaxation rate () given by,
| (4) |
and a “fast”, non-hydrodynamic layer tilting mode, with
| (5) |
Here corresponds to the direction of the average pseudo-layer normal, is the elastic constant for splay of the average director in the TB phase, and is a viscosity coefficient associated with pseudo-layer sliding. Fig. 2 illustrates the pseudo-layer undulation mode in the TB phase, for the case where both layer compression and bending contribute – i.e, both .
Eqs. (4) and (5) assume that and , where and are twist and bend elastic constants of the average director in the TB phase. These conditions are normally satisfied in an ordinary smectic-A LC, except very close to the transition to the nematic phase 24. As evidenced in the dispersion-less nature of the nonhydrodynamic tilt mode observed in the TB phase at optical wavenumbers 14, the second condition is validated. The first condition will be checked for self-consistency in the Results and Discussion section below. Eqs. (4) and (5) also assume , so that the hydrodynamic and nonhydrodynamic modes approximately decouple; we will confirm this in the same section.
Additionally, the expressions for the “undulation” mode (, ) apply in the limit of an incompressible smectic-A (uniform mass density ), with () and 25. The simple form for the viscosity (single parameter ) results from incompressibility and, more profoundly, from taking the hydrodynamic limit, where the “slow” degree of freedom (hydrodynamic variable) is the pseudo-layer displacement and not rotations of the average director. From the coarse-graining models of the TB phase 13, 14, for small cone angle . Then given that is the same order as for ordinary calamitic LCs, while is smaller (according to our findings on the TB material studied here) and the viscosities are typically higher in the TB phase, each of the above additional conditions is met.
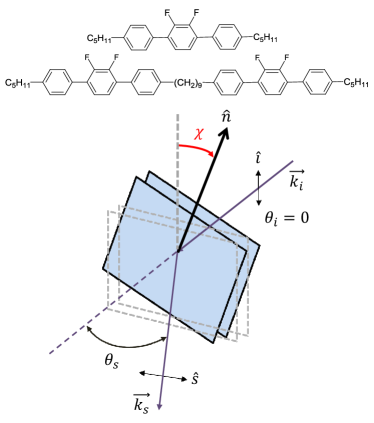
In order to isolate and check the wavevector dependence in Eq. (4), we require a light scattering geometry where , and also the capability to vary the ratio . Referring to the scattering geometry in Fig. 3, with average perpendicular to the scattering plane and fixed incident angle , it is possible to choose a value (the so-called “magic” angle) for the scattering angle , such that 26. For the present work, we used available optical birefringence data 2 to estimate in the middle of the TB range studied.
Rocking by an angle off the normal to the scattering plane (see Fig. 3) then allows one to vary away from zero ( when ), while introducing a minimal contribution from . In fact, since we know the magnitude of for the material studied from our previous work 14, we can verify that the contribution of is negligible by the absence of a decay associated with the layer tilt mode in the measured time correlation function of the scattered light intensity.
For the fixed incident and scattered polarizations used in our experiment, the scattered light collected is a mixture of ordinary and extraordinary waves when . In principle, this introduces a small spread in the scattering vector (and fluctuation wavevector) probed. We accounted for this in our analysis of the experimental data by allowing for a slight stretching of the single exponential decay used to fit the correlation function; however, the value of the stretching exponent always remained close to 1 (i.e., ).
On this basis, we may obtain an expression for that combines the dominant, geometrical dependence on with an approximation that takes the scattered field to lowest order to be pure ordinary (refractive index ) and the incident field to be pure extraordinary (index ) – conditions that are exact when . We then have,
| (6a) | |||
| (6b) |
where the angle is measured in the lab, and is the wavelength of light in air.
3 Experimental Details
The LC material studied is a 70/30 wt% mixture of the dimer and monomer compounds shown in Fig. 3, which we abbreviate DTCm 27. Its phase sequence (on cooling) is: isotropicNTBcrystal, with the transition to the TB phase occurring at approximately C. The mixture DTCm was chosen for the following reasons. First, the dielectric anisotropy , which generally decreases at the nematic to TB transition, does not decrease by much in DTCm 2, and thus its temperature dependence becomes a weak, secondary factor in the behavior of the measured light scattering intensity . This simplifies the connection between the temperature dependence of and that of for the hydrodynamic fluctuation mode. Second, DTCm has been thoroughly characterized by various techniques, ranging from freeze-fracture TEM 2, which directly reveals the nanoscale orientational modulation, to light scattering measurements of nonhydrodynamic modes in the TB phase 14.
Homogeneous planar-aligned nematic samples of DTCm were prepared using commercial cells (EHC, Japan) with m nominal spacing between flat optical substrates that have rubbed polyimide alignment layers. The sample cells were placed in a microscope hot stage, temperature-regulated to C precision and slightly modified for light scattering studies. The hot stage was mounted on a three circle goniometer. Two coplanar, horizontal circles provided adjustment of incident and scattering angles ( and ), and the third circle, mounted vertically, enabled the nematic director (or equilibrium pitch axis in the TB phase) to be continuously rotated (through angle ) between parallel and perpendicular orientations with respect to the scattering plane (Fig. 3). Separate micro-positioning stages allowed the rotation axis of the third circle to be positioned precisely in coincidence with the normally-incident, vertically-polarized laser beam ( nm wavelength, mW incident power), and to vary the position of the illuminated volume in the sample. A long distance polarizing microscope was situated in the scattering plane and used to monitor both the sample texture and the precise position of the beam on the sample during the light scattering measurements.
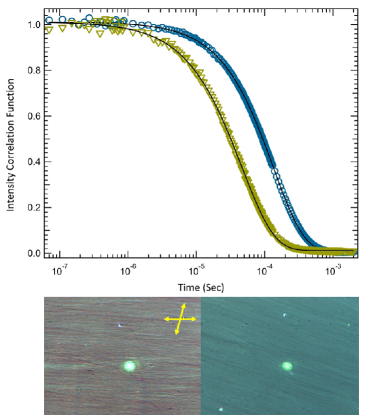
Horizontally polarized scattered light was collected at various and , and the intensity-intensity time correlation function was computed and recorded on a homemade digital electronic correlator. Fig. 4 displays representative, normalized light scattering correlation functions, taken at two values of angle ( and ) for fixed scattering angle , in the TB phase (C) of DTCm. The solid lines through the data represent fits to a slightly stretched, single exponential decay. Examples of the texture and position of the illuminated volume in the sample for two values of are also displayed. A weak stripe texture is evident in the image for ; this is most likely due to a slight pseudo-layer distortion or “buckling” near the cell surfaces. We carefully positioned the illuminated volume to minimize static light scattering from the stripes and to maintain the signal/background ratio of the correlation function above 90%. For measurements in the TB phase, the sample was very slowly cooled through . Again, the choice of material proved advantageous, as the cone angle for DTCm varies slowly below , minimizing pseudo-layer strains at the surface.
4 Results and Discussion
The main results obtained from analysis of the correlation data, or from measurements of the scattered intensity (normalized to incident laser power), are contained in Figs. 5-7.
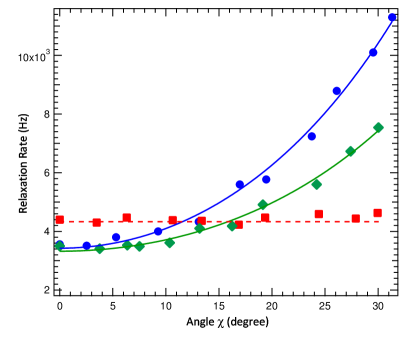
Fig. 5 presents the relaxation rate of the pseudo-layer undulation mode as a function of rocking angle for at two temperatures and C in the TB phase, and vs for the same at C in the nematic state. Below , clearly has the behavior expected from Eq. (4); it increases with , which depends on according to Eq. (6b). The solid curves are fits of the data to the combination of Eq. (4) for and Eqs. (6) for and . The index anisotropy is known for DTCm as a function of temperature 2. If we take (higher precision does not significantly affect the results of our analysis), the quantity in the expression for can be estimated as when . This leaves two adjustable parameters in our fit for , namely and , whose ratio gives .
The fit yields m-2 and m-2 for and C, respectively. Then we can obtain from an estimate of . In both a conventional smectic-A and in the ”pseudo”-layer model of a TB phase with small cone angle , is comparable to the nematic splay constant . In the mixture we study, the measured varies from pN (close to the nematic to isotropic transition) to pN (near ) 2. Taking pN, we find Pa and Pa at the two temperatures C and C. These values would increase by a factor of , if we used the value of just above .
We can compare our experimentally deduced values for with the predictions of the coarse-grained theories of the TB phase in Refs. 13,14, which both predict the order of magnitude . Then taking previously measured values N (characteristic of the nematic phase of DTCm), (for C) and with pitch nm for DTCm (in the TB phase) 2, we get Pa, which falls in the same range as our experimental values.
We may now check the assumption made in Eq. (4) (Theoretical background section). For small , the coarse-graining models give 13, 28. Then using N and max m-1, we get Pa, which is much smaller than extracted from our measurements.
While our experimental values for are in agreement with the coarse-graining theories of the TB state, they differ markedly from recently reported experimental results 19, 20 based on a different technique and on different TB materials. In particular, values of were reported in the range Pa for the pure dimer CB7CB. These values are typical of a true smectic-layered phase (i.e., a phase with a 1D mass density wave, as opposed to purely orientational modulation), and are much larger than the values we obtain for DTCm.
In fact, we would need – which would imply a scattering intensity several orders of magnitude lower than we observe for in the TB phase – to produce Pa. The discrepancy in reported for different TB materials clearly highlights the need for additional studies with different techniques applied to common samples. However, it is probably essential that all measurements be performed on well-aligned TB samples with minimal (or no) stripe texture – that condition is certainly important for light scattering. Since the stripes in planar-aligned cells of CB7CB are severe (presumably due to the rapid increase in cone angle with decreasing temperature below 7), and not easily mitigated by laboratory-scale applied fields, we have so far not been able to perform meaningful measurements on this material in the TB phase.
Fig. 5 also shows the dependence of in the nematic phase. According to the numerator of the expression for in Eq. (1), and recalling that in DTCm 2, the relaxation rate should decrease slightly with increasing ; this is due to the factor in the expression for in Eq. (6a). Our data show, however, that remains relatively flat. The reason for this could be an offsetting effect due to the dependent orientational viscosity , Eq. (3). As increases from zero at the “magic” scattering angle , and according to Eq. (3), begins to cross over from (when ) to (when ). Since in typical nematics 29, a decrease in the denominator of the expression for with could cancel the decrease in the numerator, resulting in an essentially constant value as we observe from the experimental data.
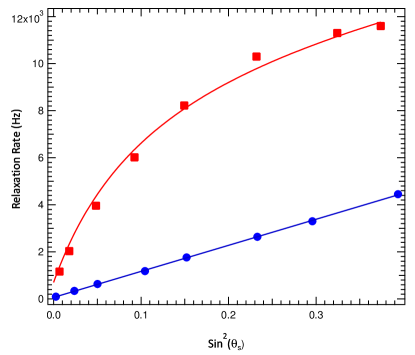
Let us next turn to the dependence of relaxation rate on the magnitude of the scattering vector for fixed . Typical data in the nematic and TB phases are displayed in Fig. 6. These data allow us to test, in particular, the dispersion relation for the pseudo-layer undulation mode in Eq. (4). According to Eqs. 6, the quantity (horizontal axis in Fig. 6) controls the magnitudes of and . In the nematic phase (), from Eqs. (1) and (6) and using . Since , we expect to be linear in with a very small intercept, and the fit in Fig. 6 confirms this.
On the other hand, in the TB phase, the dependence of on is expected to be nonlinear due to the term in Eq. (4). For small , Eq. (6) gives , while at large , the ratio saturates at a value of . The behavior of the data for in Fig, 6 are qualitatively consistent with this prediction. Quantitatively, we can fit the data to the expression for obtained from the combination of Eqs. (4) and (6), with the ratio fixed according to the calculation above (from the rocking angle scan) and with only a single variable parameter (an overall scale factor), provided we assume that the pseudo-layers are rigidly anchored at the substrate surfaces so that the minimum for the undulation mode is cut off by the finite sample thickness, ( sample thickness). Thus we replace the first term in brackets in Eq. (6a) with the long wavelength cut-off . The result of the fit, shown as the solid red line in Fig. 6, not only is consistent with the value of determined from the scan (at essentially the same temperature, Fig. 4), but also directly supports the “pseudo-layer” model of the TB phase, which leads directly to the dependence for in Eq. (4).
In the above analysis, one might be concerned about mode 2 contaminating the scattering from mode 1 when deviates significantly from or for significantly off of . However, in the TB phase, comparing the scattering intensities of the two modes measured in the present and our previous work 14, we estimate that for all , studied in Figs. 5 and 6. In the nematic phase, the mode 1 and 2 relaxation rates have similar dependence on , so the result in Fig. 6 that should not change even if mode 2 contributes slightly.
Finally, we consider the temperature dependence of . In a coarse-graining analysis, the theoretical model of the nematic to TB transition that emphasizes the role of a helical polar order parameter 10 makes the following predictions: Assuming that the cone angle () and polar order magnitude () do not relax under pseudo-layer compression or dilation (i.e., under variations in heliconical pitch), we find 14:
| (7) |
Here, is the coupling between bend distortion of the director and , is the “bare” nematic bend elastic constant, is assumed to be small, and the temperature dependence of is given by
| (8) |
where and are Landau coefficients.
On the other hand, if and are allowed to vary by small amounts in response to small variations in pseudo-layer spacing, the scaling of with to leading order changes to
| (9) |
This result is calculated by using Eqs. (1)-(3) of Ref. 14 to obtain the free energy density of the TB phase () as a function of , , and , and then treating all three variables as variational parameters: , , and . The variational change in , , is then approximated by the Taylor series expansion out to quadratic order in , , and . Minimizing with respect to and then gives and as proportional to . Substituting these values into yields , where the factor depends on all six second derivatives of with respect to , , and . After coarse graining, one arrives at . To lowest order in , 14, and one also finds . Eq. (9) then follows from these results.
Two different regimes of the temperature dependence of in Eq. (8) can be distinguished by defining a cross-over temperature . For , Eq. (8) simplifies to , and then Eqs. (7) and (9) give, respectively, and . However, for , the temperature dependence of crosses over to , and we have (from Eq. (7)) and (from Eq. (9)). The cubic scaling in the last expression agrees with a coarse-graining theory of the TB phase based on negative bend elasticity 13, 30, assuming that the cone angle is allowed to relax under pseudo-layer compression/dilation. For sufficiently close to , this theory gives,
where is an effective bend constant that becomes negative at , and is a higher order elastic constant that stabilizes the elastic free energy.
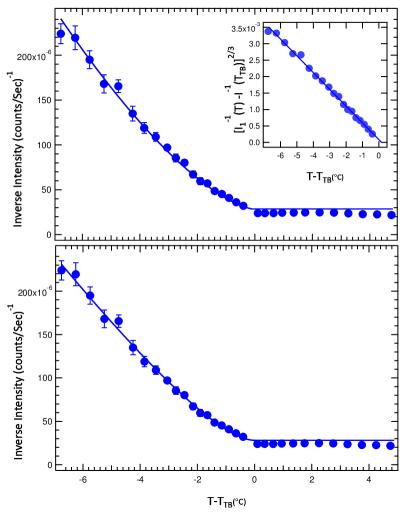
From Eq. (4), the inverse scattered intensity from the undulation mode in the TB phase is , where (the “bare” splay constant), and we neglect the weak temperature dependence of in the TB phase (which is valid for DTCm 2). Thus, data for inverse intensity versus temperature can be fitted to the theoretical expressions above for the temperature dependence of . The solid line in the bottom panel of Fig. 7 is a fit to Eqs. (7–8), with three variable parameters (which are proportional to , , and ). The fit parameters give an estimate of C, which is similar to the estimate of C obtained in our previous study of the non-hydrodynamic modes in DTCm 14.
The top panel of Fig. 7 shows the data for vs analyzed according to the alternative prediction in Eq. (9). In this case, for sufficiently below , we expect to scale as , so that . As shown in the inset, which plots vs , the data for are also consistent with the dependence predicted by Eqs. (9) and (8). The main plot in the top panel shows the result of fitting the TB phase data to this prediction. The best fit occurs for – i.e., for a much narrower cross-over region below the transition than indicated by the fit using Eqs. (7) and (8). From our definition of , such a narrow cross-over range would suggest that the product , though the ratio could still have a wide range of values.
The quality of the fits in Fig. 7 to the two different predictions for the scaling of with is fairly good, and quite comparable, over the TB range studied. Determining which scaling relation is the correct one for DTCm clearly requires a more accurate determination of the cross-over temperature and thus acquisition of considerably higher resolution data near .
On the nematic side, close to , the model predicts essentially constant (again ignoring small variations of with ). In both panels of Fig. 7, the model appears somewhat higher than the nematic data. This suggests an additional contribution to the experimentally measured intensity, which can be accounted for as a small contribution from mode 2 (i.e., from the hydrodynamic twist-bend mode, ), which is only expected to vanish when both and .
5 Conclusion
In this work, we have presented light scattering measurements of the “pseudo-layer” undulation mode in the twist-bend nematic phase of a material that shows minimal surface -induced distortion of the pseudo-layers (“stripe” texture) and thus allows high quality measurements. We obtained estimates of the pseudo-layer compression modulus in the range Pa, confirmed the smectic-A-like dispersion relation for hydrodynamic pseudo-layer compression/bending fluctuations, and demonstrated agreement between the measured temperature dependence of and predictions of the coarse-graining of a Landau-deGennes theory of the nematic to TB phase transition, which features a vector polarization field as the primary order parameter and invokes a linear coupling between this field and bend distortion of the director. Further experiments, conducted very close to , are necessary (at least in the material studied) to determine whether or not the pseudo-layers fluctuate “adiabatically” with respect to the microscopic degrees of freedom (helipolar order parameter and cone angle) of the heliconical TB structure. Additionally, it would be interesting to perform similar light scattering studies on other TB-forming materials, provided the stripe texture can be effectively suppressed.
Acknowledgements
This work was supported by the NSF under grants DMR-1307674 (ZP, SP, JG, AJ, and SS), DMR-1409658 (JVS), DMR-1410378 (ODL), and the EPSRC under grant EP/J004480/1 (GM and CW).
References
- 1 M. Cestari, S. Diez-Berart, D. A. Dunmur, A. Ferrarini, M. R. de la Fuente, D. J. B. Jackson, D. O. Lopez, G. R. Luckhurst, M. A. Perez-Jubindo, R. M. Richardson, J. Salud, B. A. Timimi, and H. Zimmermann, Phys. Rev. E, 2011, 84, 031704.
- 2 V. Borshch, Y.-K. Kim, J. Xiang, M. Gao, A. Jakli, V. P. Panov, J. K. Vij, C. T. Imrie, M. G. Tamba, G. H. Mehl, and O. D. Lavrentovich, Nat. Commun., 2013, 4, 2635.
- 3 D. Chen, J. H. Porada, J. B. Hooper, A. Klittnick, Y. Shen, M. R. Tuchband, E. Korblova, D. Bedrov, D. M. Walba, M. A. Glaser, J. E. Maclennan, and N. A. Clark, Proc. Natl. Acad. Sci. USA, 2013, 110, 15931.
- 4 D. Chen, M. Nakata, R. Shao, M. R. Tuchband, M. Shuai, U. Baumeister, W. Weissflog, D. M. Walba, M. A. Glaser, J. E. Maclennan, and N. A. Clark, Phys. Rev. E, 2014, 89, 022506.
- 5 C. Meyer, G. R. Luckhurst, and I. Dozov, Phys. Rev. Lett., 2013, 111, 067801.
- 6 E. Gorecka, M. Salamonczyk, A. Zep, D. Pociecha, C. Welch, Z. Ahmed, and G. H. Mehl, Liq. Cryst., 2015, 42, 1.
- 7 C. Meyer, G. R. Luckhurst, and I. Dozov. J. Mater. Chem. C, 2015, 3, 318.
- 8 I. Dozov, Europhys. Lett., 2001, 56, 247.
- 9 I. Lelidis and G. Barbero, Liq. Cryst., 2016, 43, 208.
- 10 S. M. Shamid, S. Dhakal, and J. V. Selinger, Phys. Rev. E, 2013, 87, 052503.
- 11 E. I. Kats and V. V. Lebedev, JETP Lett., 2014, 100, 110.
- 12 R. B. Meyer in Molecular Fluids, Les Houches Lectures, 1973, ed. R. Balian and G. Weill, Gordon and Breach, London, 1976, pp. 271-343.
- 13 C. Meyer and I. Dozov, Soft Matter, 2016, 12, 574.
- 14 Z. Parsouzi, S. M. Shamid, V. Borshch, P. K. Challa, A. R. Baldwin, M. G. Tamba, C. Welch, G. H. Mehl, J. T. Gleeson, A. Jakli, O. D. Lavrentovich, D. W. Allender, J. V. Selinger, and S. Sprunt, Phys. Rev. X, 2016, 6, 021041.
- 15 T. C. Lubensky, Phys. Rev. A, 1972, 6, 452.
- 16 L. Radzihovsky and T. C. Lubensky, Phys. Rev. E, 2011, 83, 051701.
- 17 P. K. Challa, V. Borshch, O. Parri, C. T. Imrie, S. N. Sprunt, J. T. Gleeson, O. D. Lavrentovich, and A. Jakli, Phys. Rev. E, 2014, 89, 060501(R).
- 18 S. M. Salili, C. Kim, S. Sprunt, J. T. Gleeson, O. Parri, and A. Jakli, RSC Adv., 2014, 4, 57419.
- 19 E. Gorecka, N. Vaupotic, A. Zep, D. Pociecha, J. Yoshioka, J. Yamamoto, and H. Takezoe, Angew. Chem. Int. Ed., 2015, 54, 10155.
- 20 N. Vaupotic, S. Curk, M. A. Osipov, M. Cepic, H. Takezoe, and E. Gorecka, Phys. Rev. E, 2016, 93, 022704.
- 21 D. Johnson and A. Saupe, Phys. Rev. A, 1977, 15, 2079.
- 22 P.-G. de Gennes and J. Prost, The Physics of Liquid Crystals, Clarendon Press, Oxford, 2nd edn, 1993, section 6.3.1.3.
- 23 W. H. Jeu, Physical Properties of Liquid Crystalline Materials, London, Gordon and Breach, 1980, p. 112.
- 24 H. Birecki, R. Schaetzing, F. Rondelez, and J. D. Litster, Phys. Rev. Lett., 1976, 36, 1376.
- 25 H.Y. Chen and David Jasnow, Phys. Rev. E, 2000, 61, 493.
- 26 R. Schaetzing, Ph.D. Dissertation, Massachusetts Institute of Technology, unpublished, 1980.
- 27 V. P. Panov, M. Nagaraj, J. K. Vij, Yu. P. Panarin, A. Kohlmeier, M. G. Tamba, R. A. Lewis, and G. H. Mehl, Phys. Rev. Lett., 2010, 105, 167801.
- 28 S. M. Shamid and J. V. Selinger, unpublished.
- 29 G. P. Chen, H. Takezoe, and A. Fukuda, Liq. Cryst., 1989, 5, 341.
- 30 I. Dozov, private communication, based on the Supplementary Information of Ref. 13.