Spatial distribution of FIR rotationally excited CH+ and OH emission lines in the Orion Bar PDR††thanks: Herschel is an ESA space observatory with science instruments provided by European-led Principal Investigator consortia and with important participation from NASA.
Abstract
Context. The methylidyne cation (CH+) and hydroxyl (OH) are key molecules in the warm interstellar chemistry, but their formation and excitation mechanisms are not well understood. Their abundance and excitation are predicted to be enhanced by the presence of vibrationally excited H2 or hot gas (5001000 K) in photodissociation regions with high incident FUV radiation field. The excitation may also originate in dense gas ( cm-3) followed by nonreactive collisions with H2, H, and electrons. Previous observations of the Orion Bar suggest that the rotationally excited CH+ and OH correlate with the excited CO, a tracer of dense and warm gas, and formation pumping contributes to CH+ excitation.
Aims. Our goal is to examine the spatial distribution of the rotationally excited CH+ and OH emission lines in the Orion Bar in order to establish their physical origin and main formation and excitation mechanisms.
Methods. We present spatially sampled maps of the CH+ J=3-2 transition at 119.8 m and the OH -doublet at 84 m in the Orion Bar over an area of 110110 with Herschel (PACS). We compare the spatial distribution of these molecules with those of their chemical precursors, C+, O and H2, and tracers of warm and dense gas (high-J CO). We assess the spatial variation of CH+ J=2-1 velocity-resolved line profile at 1669 GHz with Herschel HIFI spectrometer observations.
Results. The OH and especially CH+ lines correlate well with the high-J CO emission and delineate the warm and dense molecular region at the edge of the Bar. While notably similar, the differences in the CH+ and OH morphologies indicate that CH+ formation and excitation are strongly related to the observed vibrationally excited H2. This, together with the observed broad CH+ line widths, indicates that formation pumping contributes to the excitation of this reactive molecular ion. Interestingly, the peak of the rotationally excited OH 84 m emission coincides with a bright young object, proplyd 244-440, which shows that OH can be an excellent tracer of UV-irradiated dense gas.
Conclusions. The spatial distribution of CH+ and OH revealed in our maps is consistent with previous modeling studies. Both formation pumping and nonreactive collisions in a UV-irradiated dense gas are important CH+ J=3-2 excitation processes. The excitation of the OH -doublet at 84 m is mainly sensitive to the temperature and density.
Key Words.:
ISM: individual objects: Orion Bar, ISM: lines and bands, photon-dominated region (PDR)1 Introduction
The methylidyne cation (CH+) and hydroxyl (OH) have been observed in different environments from the local (e.g., Storey et al. 1981; Nagy et al. 2013; Dawson et al. 2014) to the extragalactic ISM (e.g., Schmelz et al. 1986; Baan et al. 1992; Darling & Giovanelli 2002; Spinoglio et al. 2012; Rangwala et al. 2014). They are key molecules in the warm interstellar chemistry, and because they require ultraviolet (UV) radiation and high temperatures to form, they trace specific physical processes in the ISM (e.g., Gerin et al. 2016). Thus, it is expected that in addition to the physical conditions of the regions they are observed in, the spatial distribution of the rotationally excited far infrared (FIR) emission of these species might give clues on their formation and excitation processes. Herschel allows, for the first time, to study the spatial distribution of these lines. In this paper, we present the first spatially resolved maps of these lines in the Orion Bar.
Atoms and hydrogen molecules and radicals are the first chemical building blocks of the ISM. In warm gas CH+ is believed to form mainly as a product of the reaction. This formation route has a very high endothermicity of 0.374 eV (4300 K), and it has been suggested that this barrier could be overcome by reactive collisions with the vibrationally excited H2 in strongly irradiated PDRs (e.g., White 1984; Lambert & Danks 1986; Jones et al. 1986; Agúndez et al. 2010; Naylor et al. 2010; Godard & Cernicharo 2013; Nagy et al. 2013; Zanchet et al. 2013). In diffuse interstellar clouds with low far-ultraviolet (FUV) radiation field and very low density, shocks and turbulence (e.g., Elitzur & Watson 1978; Pineau des Forets et al. 1986; Godard et al. 2009, 2012; Falgarone et al. 2010a, b) have been proposed to overcome the high endothermicity. In addition, Lim et al. (1999) found that the observed abundances of CH+ by Cernicharo et al. (1997) are explained through thermal reaction between C+ and H if the gas is hot enough (1000 K).
The reaction becomes exothermic when H2 is in vibrationally excited states (Godard & Cernicharo 2013; Zanchet et al. 2013). On the other hand, CH+ is highly reactive and easily destroyed by reactive collisions with H2, H, and electrons. Godard & Cernicharo (2013) and Zanchet et al. (2013) find that with the chemical destruction rates considered typical for PDR environments, all levels of CH+ () are very sensitive to the formation pumping since the time-scale for the chemical reaction becomes comparable or shorter than that of the nonreactive collision. Collisional excitation with H2, H, and electrons could, however, be important for the lowest rotational transitions. In contrast, radiative pumping is predicted to have only a marginal effect even in a strong FIR radiation field.
The OH radical is a key intermediary molecule in forming other important PDR tracers like H2O, CO+, O2, NO and SO+ in the ISM. On the surface of high FUV-flux PDRs the OH formation is expected to be dominated by the endothermic reaction with H2 and atomic oxygen O0 (Goicoechea et al. 2011; Hollenbach et al. 2012). The route is endothermic by 0.08 eV (900 K) and with an activation barrier of 0.4 eV (4800 K). Similarly to CH+, the possibility of the FUV-pumped vibrationally excited H2 enhancing the abundance and excitation of OH has been suggested.
Goicoechea et al. (2011) made the first detection of rotationally excited CH+ and OH emission lines with Herschel/PACS towards the CO+ peak (Störzer et al. 1995) at the edge of the Orion Bar PDR, one of the nearest, nearly edge-on luminous PDRs (with a FUV radiation field of a few 104 in Draine units). While their pointed observations cover a small area (47 47), they hint at a possible spatial correlation between these lines and suggest that the rotational OH emission originates in small irradiated dense structures (106-7 cm-3 and T160220 K). The Orion Bar is thought to contain different physical structures with an interclump medium at medium density ( cm-3) and high density clumps (106-7 cm-3) (e.g., Tielens et al. 1993; Tauber et al. 1994; Lis & Schilke 2003; Lee et al. 2013). A recent analysis of the high-J CO, H2, OH, and CH+ emission lines using the PDR Meudon code by Joblin et al. (in prep.) shows that these lines are very sensitive to the thermal pressure and suggests K cm-3 for the emitting structures. However, this study uses pointed observations and in order to understand the CH+ and OH formation and excitation in detail, we need to understand their spatial distribution and how they compare with other tracers.
Using high spectral resolution Herschel/HIFI observations, Nagy et al. (2013) find that the CH+ J=1-0 and J=2-1 lines have line widths of km s-1 towards the Orion Bar, larger than those of other molecular lines, which typically show line widths of 23 km s-1. This line broadening could result from formation pumping leading to a non-thermalized velocity distribution.
In this paper, we study the spatial distribution of the rotationally excited CH+ and OH emission lines using fully sampled PACS maps of CH+ transition J=3-2 at 119.8 m and OH 84 m -doublet towards the Orion Bar. These are the first fully sampled maps of these emission lines in a PDR. Observational constraints on the excited CH+ and OH spatial distribution and comparison with tracers of warm and dense gas and vibrational excited H2 are needed to establish their physical origin and their main excitation mechanisms (collisions versus pumping). Given the similar critical densities (1010 cm-3) and upper level energies (E/k250 K) of the targeted lines, our observations allow us to study how the chemical reaction with H affects the formation and excitation of CH+ and OH.
We first describe the Herschel observations and data reduction of the CH+ and OH lines, as well as the lines observed for comparison, in Sect. 2. We discuss the line detection, spatial morphology and origin of the CH+ J=3-2 and OH 84 m lines in Sect. 3. In Sect. 4 we investigate the CH+ and OH formation and chemical pumping excitation mechanism via reaction with vibrationally excited H2. In this section we also compare OH with H2O, since OH can also be the product of H2O photodissociation in the gas unshielded against FUV radiation. In Sect. 5, we discuss the CH+ velocity dispersion. The detection of a proplyd in the OH map is described in Sect. 6. We conclude and summarize the findings of the paper in Sect. 7.
2 Observations and data reduction
2.1 CH+ J=3-2 and OH lines observed with PACS
We observed the Orion Bar over an area of 110110 with the Photoconductor Array Camera and Spectrometer (PACS, Poglitsch et al. 2010) onboard Herschel Space Observatory. In particular, we mapped the following lines: CH+ J=3-2 (120 m), OH 84 m -doublet (84.4 and 84.6 m, transitions J=7/2+-5/2- and J=7/2--5/2+, respectively), and OH 119 m -doublet (119.2 and 119.4 m, transitions J=5/2--3/2+ and J=5/2+-3/2-, respectively). Table 1 lists the observed transitions, their wavelengths, critical densities, upper level energy temperatures, and Einstein coefficients.
| [m] | transition | ncrit [cm-3] | Eu/k [K] | Aij [s-1] | |
|---|---|---|---|---|---|
| OH | 84.6 | J=7/2--5/2+ | 1 (10)a | 291 | 5.20 (-01) |
| OH | 119.4 | J=5/2+-3/2- | 1 (09)a | 120 | 1.38 (-01) |
| CH+ | 119.8 | J=3-2 | 4 (09)b | 240 | 2.20 (-01) |
| CH+ | 179.6 | J=2-1 | 6 (08)b | 120 | 6.10 (-02) |
| CH+ | 359.0 | J=1-0 | 7 (07)b | 40 | 6.36 (-03) |
| CO | 137.3 | J=19-18 | 5 (06)c | 1050 | 6.65 (-04) |
| 13CO | 227.1 | J=12-11 | 2 (06)c | 412 | 1.52 (-04) |
| C18O | 341.5 | J=8-7 | 6 (05)c | 190 | 4.47 (-05) |
| CII] | 157.7 | 2P3/2-2P1/2 | 3 (03)d | 91 | 2.29 (-06) |
| OI] | 145.5 | 3P0-3P1 | 2 (05)d | 327 | 1.66 (-05) |
| H2O | 269.3 | 111-000 | 1 (09)e | 53 | 1.84 (-02) |
| H2O | 398.7 | 211-200 | 3 (08)e | 137 | 7.05 (-03) |
The lines were observed using the unchopped mode and due to the instantaneous wavelength window covered, the CH+ J=3-2 observations at 119.8 m also contain the OH 119 m doublet. The observations were carried out on September 14 and 15, 2012 and the total observation time was 21 009s and 13 795s for OH and CH+, respectively. The observations consist of a fully Nyquist-sampled raster map of 44 footprints of the CH+ J=3-2 line, and a fully Nyquist-sampled 55 raster map of the OH 84 m line. These footprints are composed of 55 spatial pixels (spaxels). For each spaxel the line is observed in 16 different spectral scans, each with an up and down scan. The configuration is shown in Fig. 1, where the raster map is overlaid on top of the 8 m IRAC image of the Orion Bar.
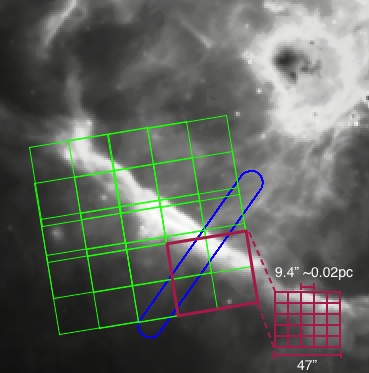
Due to the overlapping footprints, the middle of the map is better sampled and has (slightly) higher S/N than the edges of the map where we only have the data from one footprint. For CH+ J=3-2 and OH 84 m the typical line detection level outside the Bar is 1015 and in the Bar 1530. For OH 119 m the typical detection level outside the Bar is 50 and in the Bar 100.
The data were processed using the version 10.0.2843 of the reduction and analysis package HIPE. Since the PACS instrument has a spectral resolution of 135 km s-1 at 85 m and 300 km s-1 at 120 m, the line widths and the hyperfine structures of the OH -doublets are not resolved in our observations. The spatial resolution is 9 for the CH+ 120 m line and the OH 119 m -doublets, and 6 for the OH 84 m -doublets.
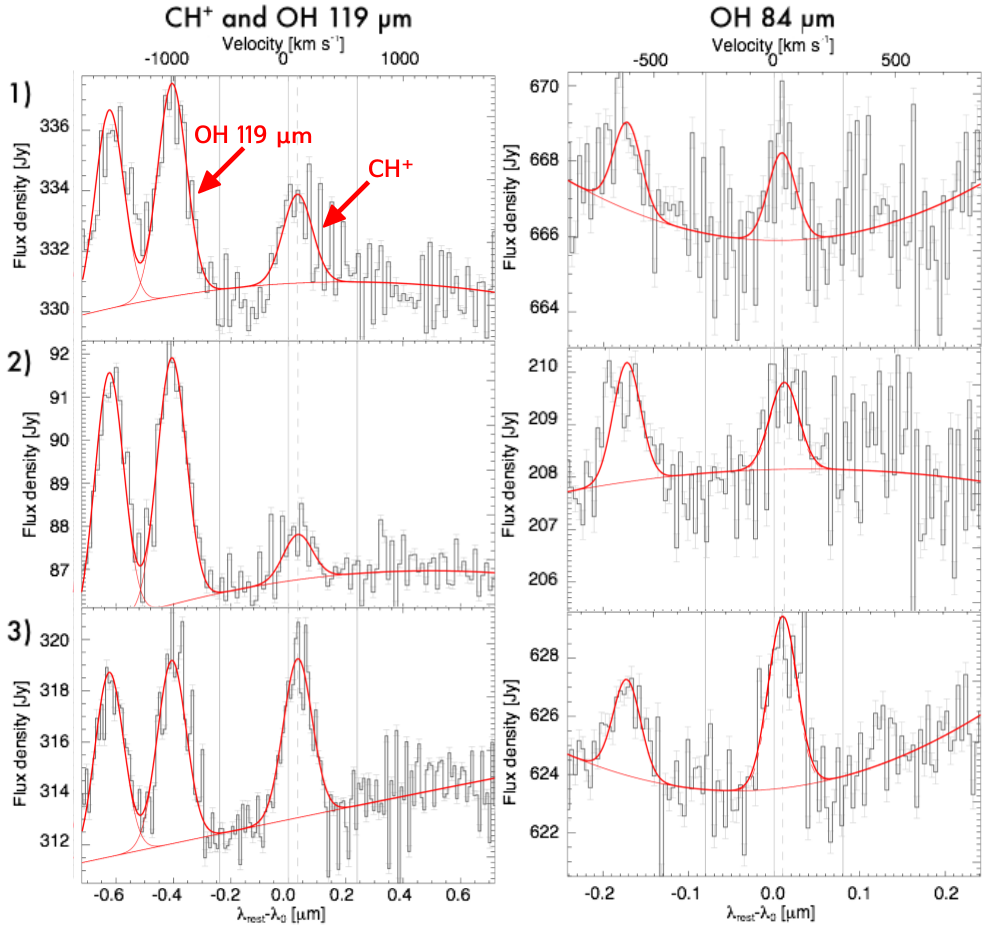
The line fitting was performed using IDL-based software PACSman version 3.55 (Lebouteiller et al. 2012). Fig. 2 gives an example of the observations and line fitting routine.
Using a polynomial baseline, the lines were fitted with a Gaussian profile and the corresponding line flux integrated. PACSman measures the line fluxes for each spatial pixel independently. To produce the final map, it creates an oversampled pixelated grid of the observations with a 3 pixel resolution and calculates the average fractional contribution of the given spatial pixels to the relevant position. PACSman also calculates the statistical uncertainties, including the dispersion in the reduction process and the rms of the fit. In our observations, these uncertainties are small and usually amount to at most 520 % for the CH+ and OH lines. The relative accuracy between spatial pixels given in the manual is 10 %111From the PACS spectroscopy performance and calibration manual. This can be found at http://herschel.esac.esa.int/twiki/bin/view/Public/PacsCalibrationWeb. We assume a conservative total uncertainty of 22 % for the integrated line intensities in the fainter regions, that is the upper limit of a combination of the calibration (10 %) and line fitting uncertainties (520 %). For the Bar, the uncertainty is less than 11 %.
We also observed the CO J=19-18 line at 137.3 m with PACS (Parikka et al., in prep.). The observations consist of a fully Nyquist-sampled raster map of 44 footprints. For CO J=19-18, the typical line detection level outside the Bar is 10 and in the Bar 100. The uncertainty for the integrated line intensities is less than 22 % with less than 11 % in the Bar. The spatial resolution is 10.
2.2 HIFI and SPIRE observations
In order to obtain information about the velocity structure of the CH+ lines, we used the Heterodyne Instrument for the Far Infrared (HIFI, de Graauw et al. 2010) to observe the CH+ J=2-1 line at 180 m along a cut perpendicular to the Orion Bar (see Fig. 1). The cut is centered at the position = 05h35min20.61s, = -052514 and extends across 2 with an inclination of PA=52. The data were obtained with the High Resolution Spectrometer (HRS). We used the on-the-fly observing mode using half-beam sampling and the nominal HIFI beam size at this frequency (12.3). After porting the FITS data into GILDAS format222Institut de Radioastronomie Millimétrique (IRAM): http://iram.fr/IRAMFR/GILDAS/, the data processing consisted of a scan-by-scan linear baseline subtraction and resampling to a common frequency grid with a resolution of 0.3 km s-1. The intensity scale is antenna temperature (), and the typical rms is 0.12 K calculated at a velocity resolution of 0.3 km s-1. The offset (from the central position of = 05h35min20.61s, = -052514) of the spectra, the calculated area, the velocity (), FWHM line width () and the peak temperature [K] are listed in Table 2.
| Offset | Area [K km s-1] | [km s-1] | [km s-1] | [K] |
|---|---|---|---|---|
| -26, 40] | 2.5 (0.2) | 8.7 (0.1) | 3.4 (0.3) | 0.69 |
| -13, 20] | 3.2 (0.2) | 9.6 (0.1) | 3.4 (0.2) | 0.88 |
| 0, 0] | 6.8 (0.2) | 10.6 (0.1) | 4.0 (0.2) | 1.57 |
| 13, -20] | 2.0 (0.2) | 10.9 (0.1) | 3.4 (0.3) | 0.55 |
| 26, -40] | 0.9 (0.2) | 11.1 (0.3) | 3.1 (0.7) | 0.28 |

We have also observed CH+ J=1-0 at 359 m and water lines 111-000 at 269 m and 211-202 at 399 m with the Spectral and Photometric Imaging Receiver (SPIRE, Griffin et al. 2010). The observations were taken on September 20, 2010 in the high-resolution SPIRE FTS full-sampling mode. We include the water lines in our observations as OH can also form via the photodissociation of H2O. Within the SPIRE range of these observations, a wealth of rotational lines of CO and its isotopologues were detected (Habart et al. 2010, Parikka et al., in prep.). The 13CO J=12-11 line at 227 m and C18O J=8-7 line at 342 m maps are presented.
The SPIRE data were processed using HIPE 11.0.1. To achieve a better angular resolution, the super-resolution method SUPREME was applied to the FTS data as in Köhler et al. (2014). In Figs. 3 and 8 we give a FWHM using a Gaussian fit with the same bandwidth of the equivalent beam. It should, however, be noted that the Point Spread Function (PSF) is non-Gaussian and a FWHM does not account for the shape of the beam. The gain in resolution with the SUPREME method depends on the wavelength. The resolution improves, e.g., from 32.6 to 19.0 at 400 m or from 40.1 to 25.8 at 650 m. After SUPREME processing, the spatial resolution for the CH+ J=1-0, H2O 399 m and C18O J=8-7 lines is between 17 and 19, and for the H2O 269 m and 13CO J=12-11 line between 13 and 14. For a detailed description of the reduction procedure method, fitting routines, and PSF see the SUPREME web site333http://www.ias.u-psud.fr/supreme/hipeplugin.php, see also a draft available at: http://hal.archives-ouvertes.fr/hal-00765929. The lines were fitted with the HIPE Spectrometer Cube fitting procedure. We assume a total uncertainty of 36 % for the integrated line intensities, which includes the calibration and line fitting uncertainties.
3 Line emission detection and spatial morphology
3.1 Origin of the CH+ emission
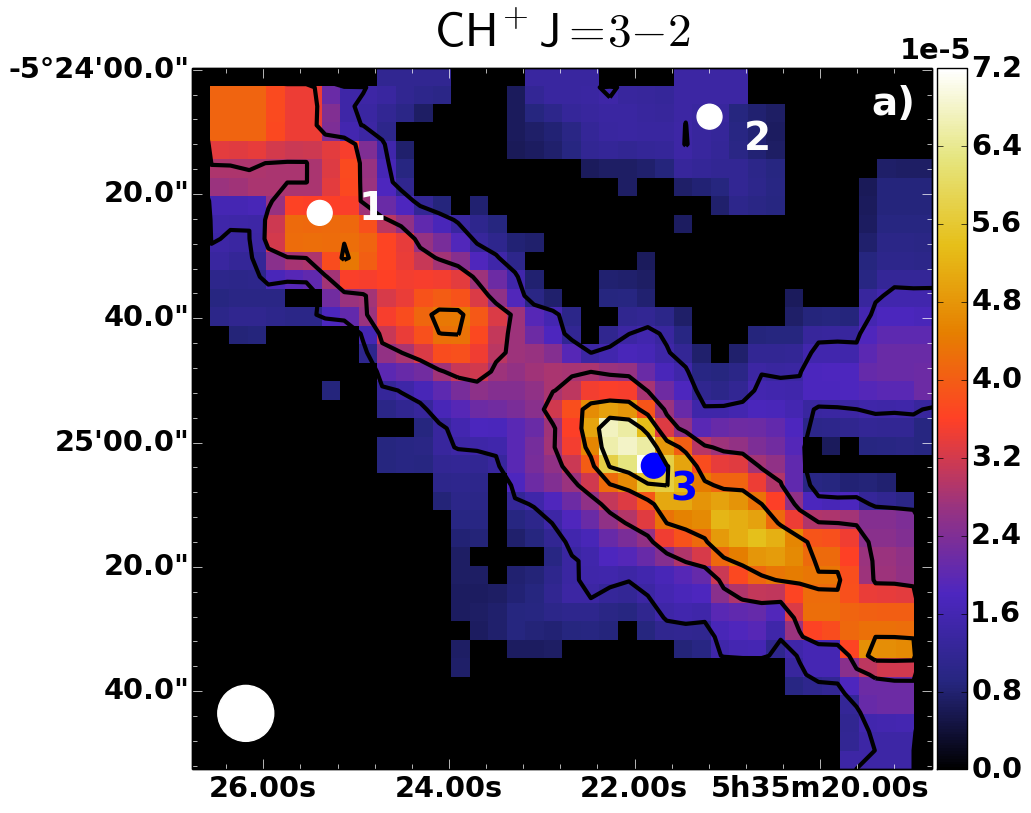
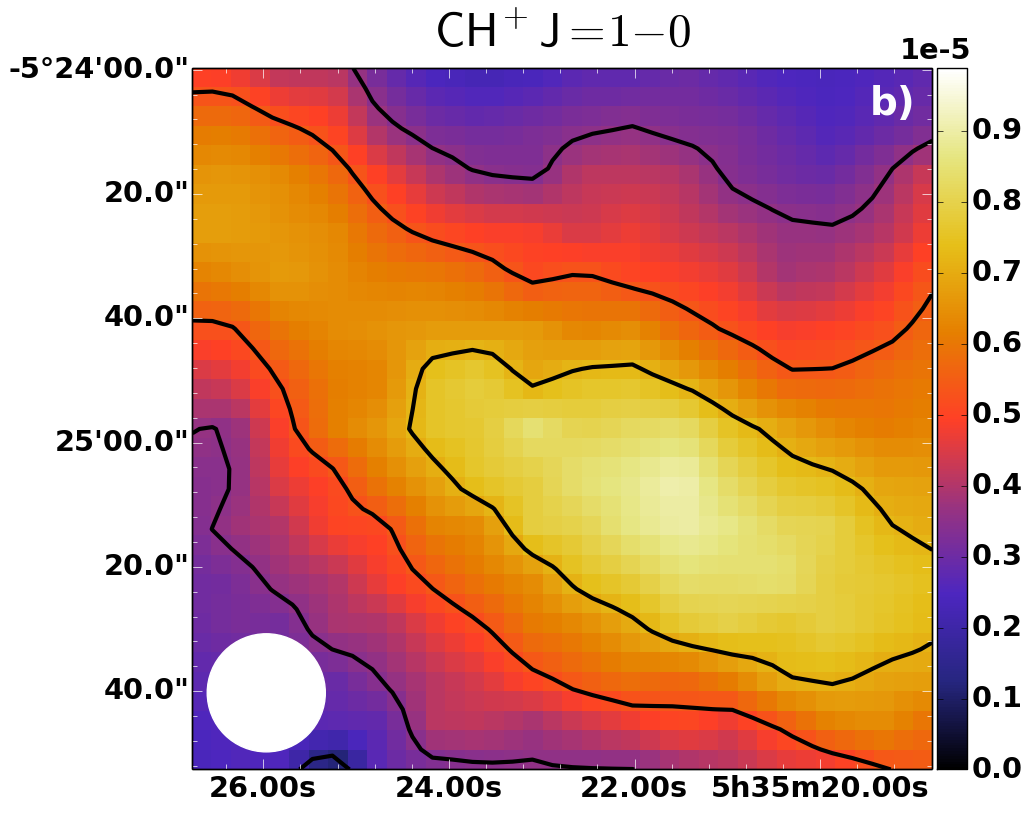
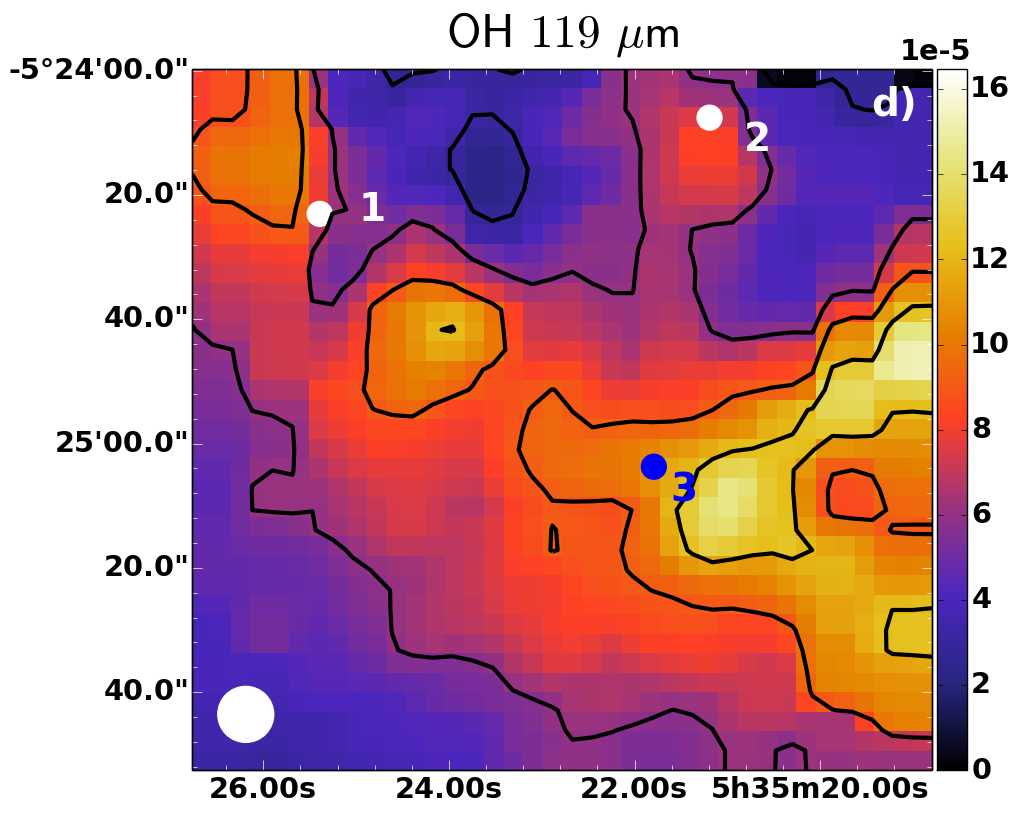
In this section we present the observations of CH+ J=3-2 transition at 120 m and J=1-0 transition at 359 m. Maps of the integrated line intensities are shown in Fig. 3. We show line spectra for CH+ J=3-2 at three positions specified in the maps (2 in the Bar, 1 in front, Fig. 2).
Fig. 3 shows that the CH+ J=3-2 line emission is well detected in the Bar, but we do not detect it behind the Bar. The emission delineates the edge of the Bar, which indicates that it is a good tracer of the warm molecular zone and very sensitive to the physical conditions prevailing in the Bar. The CH+ J=1-0 emission is much broader and originates both from the Bar and from the face-on Orion Molecular cloud surface in the background. The J=1-0 transition is also more easily excited which could affect the breadth of the emission. Emission from the UV-illuminated surface of Orion molecular cloud complex behind the Bar has been seen in several tracers, such as C+ (Bernard-Salas et al. 2012; Goicoechea et al. 2015). The CH+ J=3-2 is less extended than the J=1-0 line, and may originate from higher density structures in the Bar. In our maps, the CH+ J=3-2 line emission not associated with the Bar comes from the molecular cloud complex in the Northern part of the map and in the Western region of the map (Orion Ridge). Emission in these regions have also been observed in [CII] and [OI] (Bernard-Salas et al. 2012).
Fig. 4 shows that the warmest PDR molecular lies between the [NII] 122 m emission tracing the hot ionization front444[NII] 122 m peaks in the same place where other ionization front tracers peak, e.g. OI 1.32 m (Lis & Schilke 2003). (Bernard-Salas et al. 2012), and the C18O J=8-7 line which traces colder gas.

Most of the molecules are photodissociated in the ionized layer in front of the Bar. Behind the Bar and further away, the conditions (low FUV flux, low temperature) are not favorable to form and/or excite CH+.
Fig. 5 shows the comparison of CO J=19-18 map with 13CO J=12-11, a tracer of the warm and dense phase.
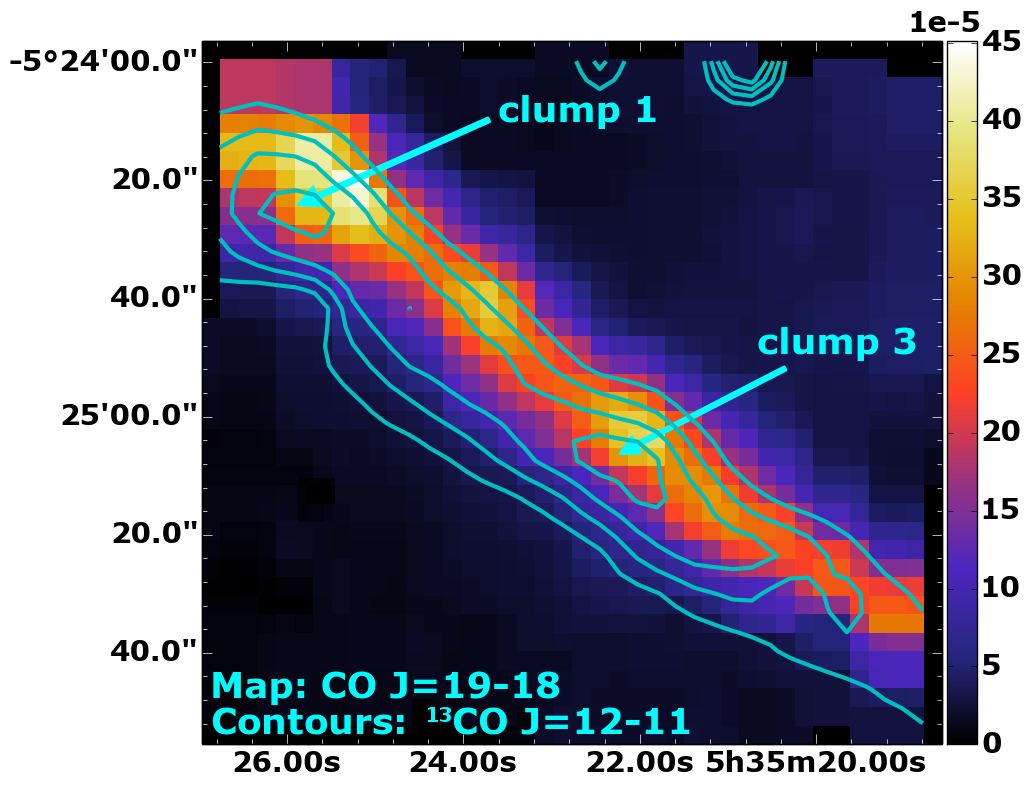
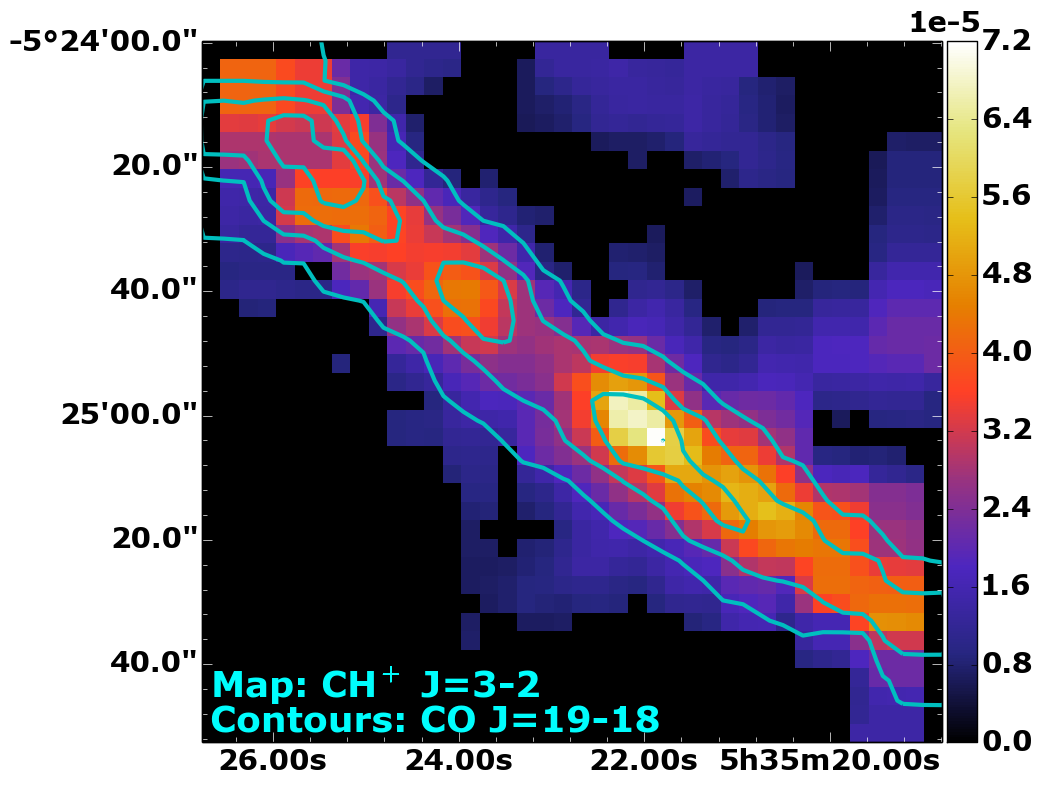
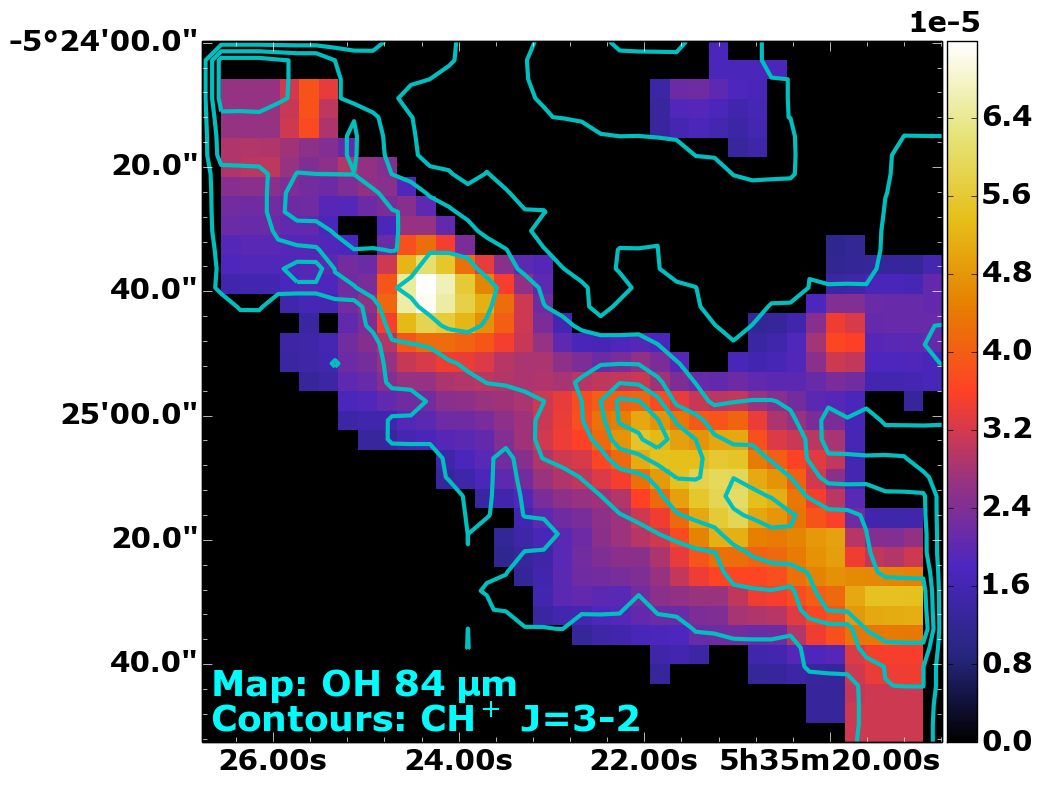
Both of these lines show clumps which correspond to the ones detected from the ground in H13CN (Lis & Schilke 2003) and in CS J=2-1 (Lee et al. 2013). We can clearly see the clumps555We have adopted the numbering of Lis & Schilke (2003). 1 and 3, respectively at the North and South part of the Bar. The clumps have diameters of about 9 or 0.02 pc and are marginally resolved by Herschel. The clumps seen in 13CO J=12-11 correspond exactly to the ones seen in H13CN and CS J=2-1. The CO J=19-18 map shows the same clumps, but shifted by 5 toward the PDR front. The CO peaks could, thus, be associated to the surface of the high density zones in the Bar. Fig. 5 also compares CH+ J=3-2 with CO J=19-18 and OH 84 m with CH+ J=3-2. The clumps can be seen in CH+, while in OH we see only clump 3. The intensity peak of CH+ J=3-2 (and J=1-0) coincides with the clump 3, while CO J=19-18 (and C18O J=8-7) peaks at clump 1. Clump 1 has a larger column density, suggesting that the optically thin high-J CO lines are more sensitive to the total column density of warm gas than CH+. Like CH+, most of the surface tracers, such as H2 v=1-0 S(1) or optically thick lines (e.g., CO J=6-5), peak at the Southern part of the Bar.
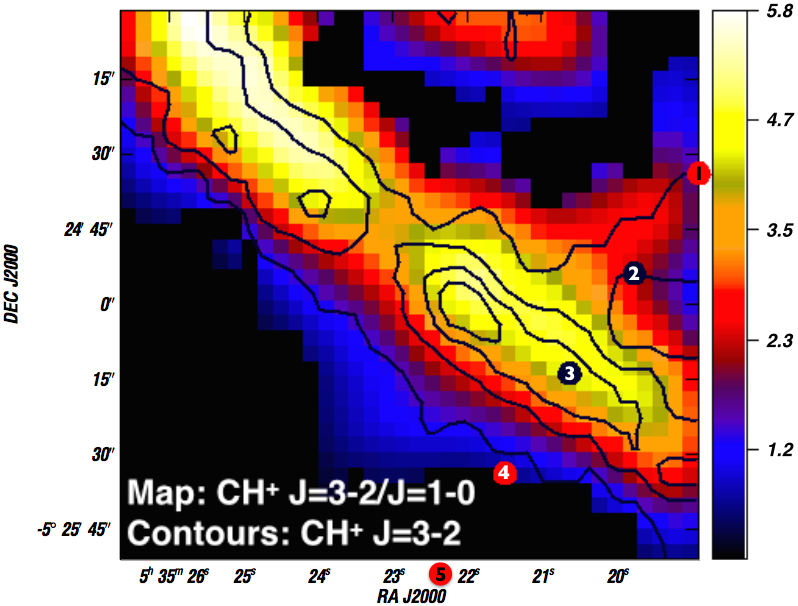
Fig. 6 presents the profile of the emission of various lines along a cut intersecting the Bar at three different positions.
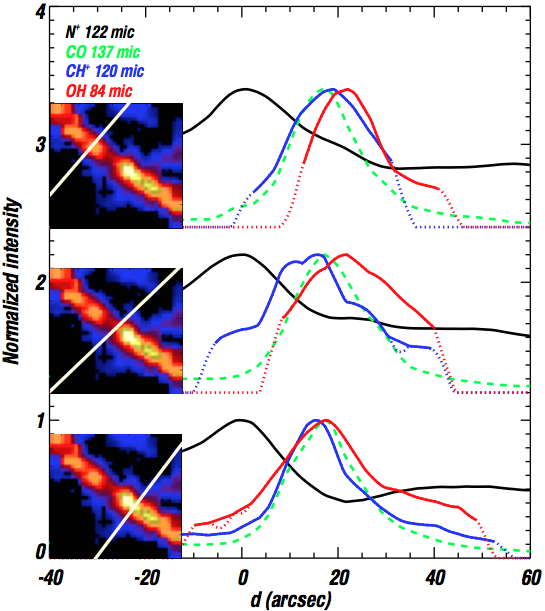
The profile of the CH+ J=3-2 line emission is resolved with an average FWHM of 20, which is wider than the PSF (9). This FWHM is similar to that of the CO J=19-18 line. The observed width is most likely the result of the Bar being tilted to the observer, an effect already inferred in other studies (e.g., Hogerheijde et al. 1995; Allers et al. 2005; Pellegrini et al. 2009). Using an inclination angle of =7∘ (Hogerheijde et al. 1995; Pellegrini et al. 2009), and a length of the PDR along the line of sight of 0.35 pc (Bernard-Salas et al. 2012) needed to reproduce the [CII] and [OI] emission, we find that a width of 0.04 pc (or 20) is in agreement with the observed one. The CH+ and high-J CO emission come from the inclined thin surface of the Bar. We stress that higher angular resolution (1) observations of rotationally and vibrationally excited H2 originating from the thin PDR surface show a smaller width of 10 (see Fig. 6) than those observed for CH+ and high-J CO. Thus, while our data shows a connection with the clumps seen in H13CO and CS, the CH+ and high-J CO emission may also originate from unresolved structures close to the cloud surface. Indeed, small-scale, high-density HCO+ J=4-3 emission structures have been recently resolved by ALMA (Goicoechea et al. 2016).
3.2 Origin of the OH emission
In this section we present the observations of OH 84 m and 119 m -doublets observed with PACS. The two lines of the -doublets have the same distribution and almost the same intensities, and therefore one line map is presented for each wavelength, namely 84.6 m ( J=7/2--5/2+) and 119.4 m ( J=5/2+-3/2-). The intensities vary only slightly (by 30 %, see Fig. 2) between the two -doublets for each wavelength. Asymmetries are predicted to be small when collisions with ortho-H2 dominate (i.e., in the warm gas) and when FIR radiative pumping plays a role (Offer & van Dishoeck 1992; Offer et al. 1994; Goicoechea et al. 2011).
The first rotationally excited OH lines at 84 m are well detected in the Bar and also in the Orion Ridge and Northern region in front of the Bar (see Fig. 3). Like CH+ J=3-2 in Fig. 5, the OH 84 m -doublet traces the warm molecular layer, but the OH emitting zone is more extended behind the Bar (see also Fig. 6). This could result from the fact that the formation of OH does not depend on H2 v¿0 like CH+ (see Sect. 4) and that the excitation of OH is mainly sensitive to the high density as suggested by previous studies. Goicoechea et al. (2011) suggest that the OH 84 m emission is coming from unresolved structures with n(H)106-7 cm-3 and T160220 K whereas CH+ emission can be explained by a density of n(H)105 cm-3 and T5001000 K (Nagy et al. 2013, Joblin et al., in prep). In the OH 84 m map, there are two main density enhancements in the Bar, one of which may be associated with a dense structure (referred to as clump 3), and another that coincides with an externally illuminated protoplanetary disk, which will be discussed in Sect. 6.
The OH ground-state rotational lines at 119 m are clearly detected everywhere in the mapped area (panel d in Fig. 3). Since the OH 119 m -doublets are more easily excited than the 84 m -doublets, they show a more extended spatial distribution (including the Orion Ridge and the molecular cloud complex in the North). Goicoechea et al. (2011) used nonlocal, non-LTE radiative transfer model including FIR pumping, to fit several FIR OH rotational lines (at 119 m, 84 m, 163 m, 79 m, and 65 m) detected with Herschel/PACS towards a small region666One PACS footprint, 4747. in the Orion Bar. The best fit was found for unresolved structures with T200 K, n(H)106 cm-3 and a source-averaged OH column density of N(OH)=1015 cm-2. For these conditions, the OH 119 m -doublets are optically thick (10), but the OH 84 m -doublets are optically thin (or effectively optically thin, 5 and ). Therefore, OH 84 m line intensities are expected to be proportional to N(OH) in the Orion Bar.
In conclusion, the OH 84 m and CH+ J=3-2 line emissions correlate well, albeit with some dispersion reflecting the difference in emission discussed above. The observed general correlation was expected given the similar critical densities and upper level energies and a main formation route with H2 for both lines. However, owing to our higher angular resolution and much larger map, we also observe differences in the morphology.
4 Formation and excitation of CH+ and OH via vibrationally excited H2
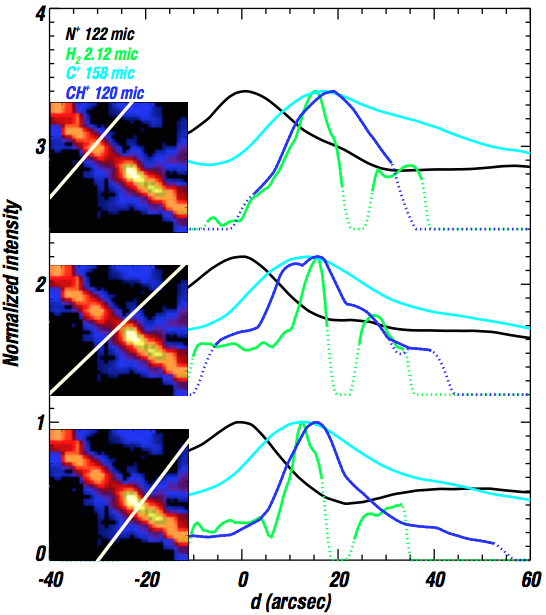
In this section, we compare the spatial distribution of the CH+ J=3-2 line with those of H2 v=1-0 S(1) and [CII] 158 m, tracing the reactants of . We also compare the spatial distribution of the OH 84 m emission to those of H2 v=1-0 S(1) and [OI] 145 m, the components of reaction .
4.1 Spatial comparison of CH+ with H and C+
Fig. 7 shows a map of H2 v=1-0 S(1) at 2.12 m and the CH+ J=3-2 line. The H2 v=1-0 S(1) was observed from the ground with a resolution of 1 (Walmsley et al. 2000). The maps are not convolved, so that we do not blur the detailed structures. At the edge of the Bar, the contours of the CH+ emission trace in detail the structures seen in H2. In the same figure, we also include a smaller H2 map (van der Werf et al. 1996) which is convolved to the same spatial scale. Again, we find a good correlation between the spatial distribution of the CH+ J=3-2 emission and the vibrationally excited H2 emission, except for clump 3 and in the lower bright structure seen in H2. The correlation supports that CH+ is formed by and/or that the excitation of CH+ is affected by formation pumping (Agúndez et al. 2010; Godard & Cernicharo 2013; Nagy et al. 2013; Zanchet et al. 2013).
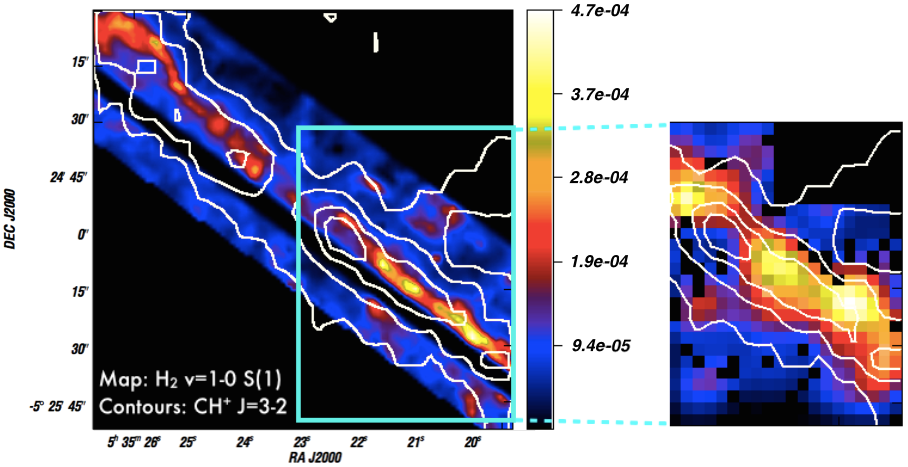
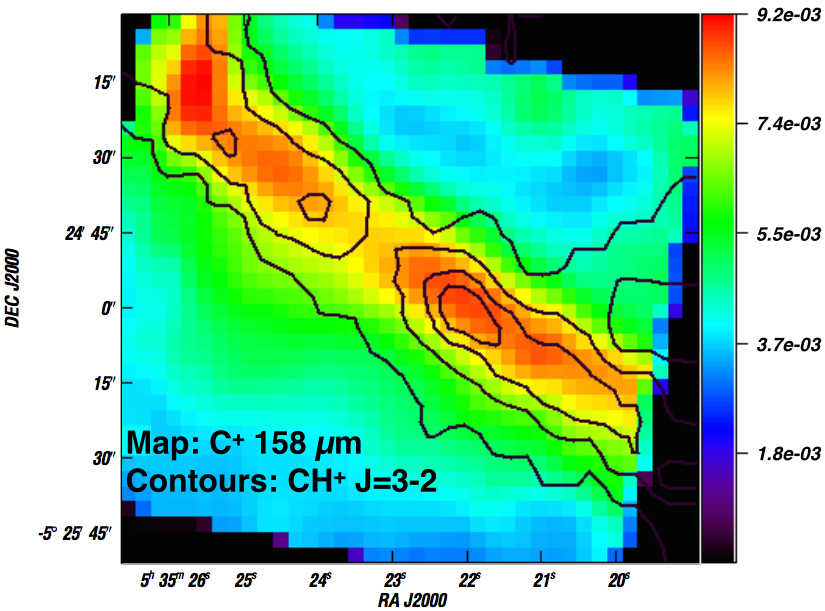
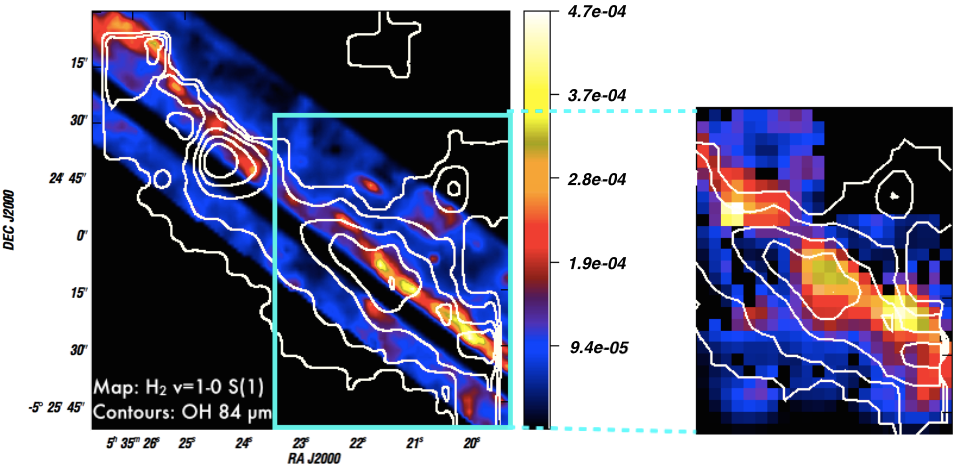
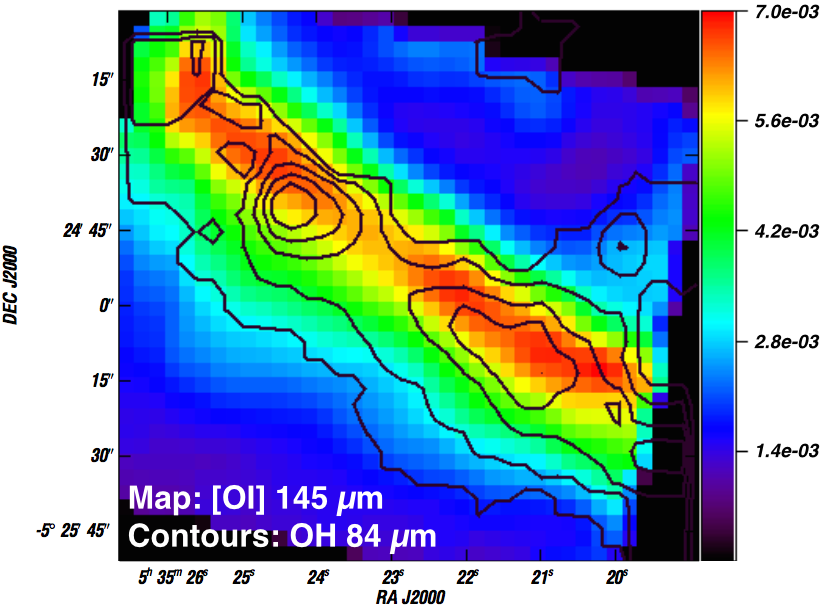
Fig. 7 also shows that CH+ J=3-2 correlates well with [CII] 158 m (Bernard-Salas et al. 2012). Nevertheless, [CII] 158 m is more extended in front and behind the Bar than CH+ J=3-2 (see Figs. 6 and 7). As expected, C+ exists in the outermost layers of the PDR, where most of the hydrogen is in atomic form and, thus, little CH+ has formed. In the envelope surrounding the Bar, the physical conditions are still favorable for [CII] emission, but not for excited CH+. The [CII] 158 m line is easily excited because of its low excitation energy of 91 K. The background PDR contributes to 30% of the [CII] emission (Bernard-Salas et al. 2012). The CH+ J=3-2 emission is too faint to be detected from the background PDR.
Since the C+ is more extended, it appears that the CH+ emission is not limited by the C+ abundance but by the abundance of vibrationally excited H2. For PDRs with lower FUV radiation field, such as moderately excited PDRs (e.g., Horsehead or NGC 7023 East with radiation fields 100 times lower than in the Orion Bar) the CH+ emission, and particularly the excited rotational transitions (J2), is expected to decrease significantly. Towards the sample of PDRs observed by PACS and SPIRE as a part of the Evolution of Interstellar Dust key program (Abergel et al. 2010, data available on the Herschel Idoc Database HESIOD webpage777http://idoc-herschel.ias.u-psud.fr/sitools/client-user/), [CII] 158 m line is detected in all the PDRs while CH+ J=1-0 line is only detected in PDRs associated to a large amount of vibrationally excited H2. The line intensity upper limit for the non-detection of CH+ (J=1-0) in the moderate excited PDRs, such as the Horsehead and NGC 7023 East, is 210-7 erg s-1 cm-2 sr-1 with SPIRE (e.g., Köhler et al. 2014). In the Horshead PDRs, the CH+ (J=1-0) has not even been detected with HIFI within the rms limit of 4 mK. Low FUV radiation field and thermal pressure are clearly not favorable for the CH+ line emission.
In conclusion, from our comparison of CH+ with vibrationally excited H2 and high-J CO, CH+ J=3-2 emission is due to both formation pumping and collisions. This agrees with Godard & Cernicharo (2013) and Zanchet et al. (2013), who found that formation pumping dominates the excitation of the levels in the physical conditions of the Orion Bar.
4.2 Spatial comparison of OH with H and O0
In general, the OH 84 m line map follows the H2 emission (see Fig. 7), but the OH emission is more extended and less correlated with H than CH+. An energy activation barrier exists in the reaction even for H (Sultanov & Balakrishnan 2005; Agúndez et al. 2010), thus, the OH formation is expected to be less sensitive to the presence of H2 (1).
In Fig. 7, we also compare OH 84 m with [OI] 145 m line, the other component of the proposed formation route. Similarly to [CII], the [OI] emission is more extended and shifted by 5 to the edge of the PDR compared to the OH emission, although the general features are similar. The differences can be explained by [OI] being present in the atomic PDR layers with low molecular gas fractions where H2 is photodissociated and cannot participate in forming OH. The background PDR contributes to 15% of the [OI] emission (Bernard-Salas et al. 2012). Like CH+ J=3-2, we do not detect OH 84 m line from the background PDR.
In conclusion, the spatial comparison of OH with [OI] and H2 1-0 S(1) indicates that the reaction is the likely OH formation route at the physical conditions of the Orion Bar as predicted by Agúndez et al. (2010). Thus, OH excitation is more sensitive to the temperature and density variations than to the presence of H2 (v0).
4.3 OH and H2O distribution comparison
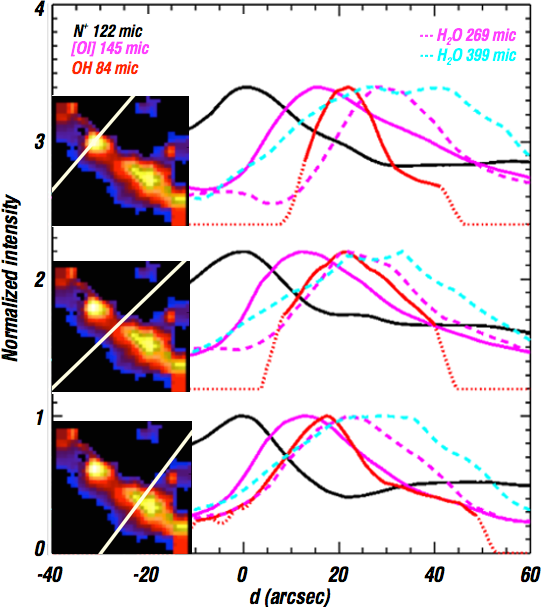
In the warm gas unshielded against FUV radiation, there is an alternative formation route for OH via the photodissociation of H2O (Hollenbach et al. 2009, 2012). Photodissociation is the main destruction route of H2O and OH. The photodissociation is predicted to limit the H2O abundance in the warm zone and the peak of H2O emission is expected to be deeper in the PDR (Hollenbach et al. 2009). Here, we compare the OH 84 m line with two water lines at 269 m (111-000, Eu/k=53 K) and 399 m (211-202, Eu/k=137 K) in Fig. 8.


Both H2O lines, more easily excited than OH 84 m, peak behind the OH by 15 and are more extended (see the cut in Fig. 6). This could be explained by the lower gas temperature in the regions where the bulk of the H2O arises compared to OH. The photodissociation is likely to limit the water abundance in the warm zone. Thus, the bulk of the OH and water emission arise from different depths. It also implies that this formation route is less important than the reaction.
5 CH+ kinematics
To investigate gas kinematics and CH+ line width variations, we examine the CH+ J=2-1 (180 m) line. We have velocity-resolved line profiles of a strip across the Southwestern part of the Bar observed with HIFI (see Fig. 1 for configuration). A selection of the spectra obtained along the cut are shown in Fig. 9.
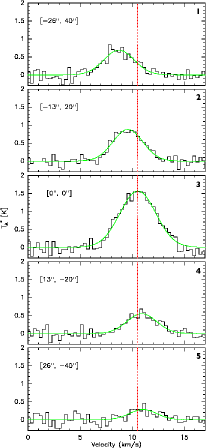
The selected positions are 23 apart from each other. The spectra have been obtained averaging all the scans that fall within 4 of the selected position.
The line centroid velocity varies from 9 km s-1 in front of the Bar to 11 km s-1 in the Bar and behind the Bar (see Table 2). These centroid velocities are similar to what Peng et al. (2012) found for CO transitions from J=6-5 to J=8-7. We find a broad line width ranging from (in front and behind the Bar) to 4 km s-1 (in the Bar). This is consistent with the observations of Nagy et al. (2013) on the CO+ peak who found line widths of 0.04 km s-1 and 0.11 km s-1 for CH+ J=1-0 and J=2-1, respectively. The CH+ J=2-1 line appears narrower that the J=1-0 line which could be due to opacity broadening and to the larger beam size at the lower frequency. CH+ has a broader line width than any other molecular tracer of dense gas in the Orion Bar (typically showing line widths of 2-3 km s-1, Joblin et al, in prep.). The CH+ J=2-1 line appears to be broad all over the region, even though the ratio of the CH+ J=3-2 to J=1-0 shown in Fig. 9 points to different physical conditions.
The broad width of CH+ line could originate in a low density interclump component (n104 cm-3), where low density tracers such as [CII] have been observed to have similar line widths of 4 km s-1 (Nagy et al. 2013). However, our maps show that the excited CH+ and high-J CO both originate both in the dense and warm region of the Bar, while their line widths are different (3 km s-1 for the high-J CO, Joblin et al., in prep). Alternatively, based on reactivity of the molecule, Nagy et al. (2013) suggest that the broadening could be explained by formation pumping. If this is the case, there is no time for the CH+ to thermalize, and the line width will remain unchanged. In conclusion, our results agree with Nagy et al. (2013) that the broad line width of CH+ is most likely a signature of formation pumping.
6 Proplyd in the Orion Bar
The OH 84 m map reveals a clear emission peak not detected in the other lines. In Fig. 10, we compare the OH 84 m emission to an optical image from the Hubble Space Telescope (HST).
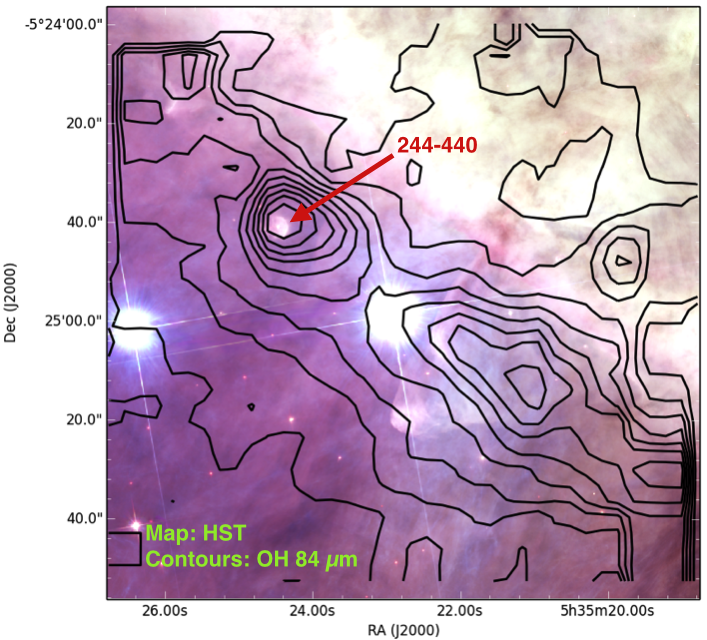
The HST image reveals an optical source at the OH peak position. This source has been identified as the proplyd 244-440 (e.g., Bally et al. 2000). Proplyds, or externally illuminated dense protoplanetary disks, are a special class of low-mass young stellar objects modulated by a strong, external UV field. They are found embedded within or near a HII region and are identified by their typical cometary photoionized envelopes.
This is, to our knowledge, the first time that OH emission has been tentatively associated to a proplyd, although OH has been observed in a protoplanetary disk in the DIGIT survey (Sturm et al. 2010). In Fig. 10, the highest OH contour level at the proplyd position is 8 (our resolution being 6) which corresponds to 3000 AU at a distance of 415 pc. While disks in proplyds are small (100500 AU), their photoevaporating envelopes can extend up to a couple of 1000 AU. The OH 84 m line emission at this position could come from UV-radiation heating or shocks. HST optical image of the proplyd 244-440 reveals the presence of microjets. Alternatively, in proplyds, the surface of the disk is illuminated and is, thus, similar to a very dense and warm PDR, and is also expected to produce FIR OH emission. If the OH origin is UV heating, the proplyd detection would confirm that the OH does originate in hot irradiated structures.
Like OH, CH+ J=3-2 has been detected towards protoplanetary flared disks such as HD 100546 and HD 97048 (Thi et al. 2011; Fedele et al. 2013). In the upper layers of the disks, which are directly exposed to the stellar radiation field, the reaction is expected to be dominant. We do not see any excess of CH+ J=3-2 in the Orion Bar, nor any excess of high-J CO emission. As opposed to OH, CH+ and high-J CO lines are fainter in disks (e.g., Fedele et al. 2013; Meeus et al. 2013) and their emission is likely overshadowed by the strong nebular emission in the region.
7 Summary and conclusions
We have presented Herschel fully sampled maps of the FIR rotationally excited emission lines of CH+ and OH towards the Orion Bar over a large area (110 110). The CH+ and OH lines delineate the edge of the Bar indicating that they are good tracers of the warm molecular zone and very sensitive to the physical conditions. Our main results are summarized as follows.
-
1.
We confirm the correlation of OH and CH+ with high-J CO emission (a tracer of dense gas). We find that the spatial thickness of the observed line emission layers results from the Bar being tilted towards the observer, an effect already inferred in other studies. OH, CH+, and high-J CO originate in the inclined thin irradiated surface of the Bar with embedded dense structures. The emission peaks of these lines are associated with the surface of the largest clumps (density enhancements) seen with high density tracers, such as HCN or CS.
-
2.
Although excited CH+ and OH display similar overall spatial distribution, there are also relevant differences in their morphology. The good correlation of CH+ with vibrationally excited H2 supports that CH+ is formed via the reaction . We provide observational evidence to the fact that the excitation of the CH+ rotational levels is affected by formation pumping which dominates the excitation for J2 levels, as suggested by previous models. The CH+ emission is limited by the abundance of vibrationally excited H2 and not by the C+ abundance. We find the C+ emission to be more extended than the CH+ emission.
-
3.
OH is less well correlated with the vibrationally excited H2, a fact pointed out by theoretical studies predicting the reaction to dominate the OH formation. The other formation route for OH via the photodissociation of H2O appears not to be as important since the bulk of the OH and water emission seem to arise from different cloud depths.
-
4.
We find a broad line width of 34 km s-1 for CH+ J=2-1, which is broader than other molecular line tracing dense gas in the Orion Bar. The line width most likely reflects the excess energy transferred to translational energy during the formation pumping of CH+.
-
5.
Interestingly, the peak of the OH 84 m emission corresponds to the position of the proplyd 244-440. FIR OH emission could be a good diagnostic of hot gas in the externally illuminated protoplanetary disks.
Acknowledgements.
J. Bernard-Salas wishes to acknowledge the support of a Career Integration Grant within the 7th European Community Framework Program, FP7-PEOPLE-2013-CIG-630861-SYNISM. J. R. Goicoechea thanks Spanish MINECO for funding support under grants CSD2009-00038 and AYA2012-32032. He also thanks the ERC for support under grant ERC-2013-Syg-610256-NANOCOSMOS. M. Gerin and B. Godard thank the French PCMI program for funding.References
- Abergel et al. (2010) Abergel, A., Arab, H., Compiègne, M., et al. 2010, A&A, 518, L96
- Agúndez et al. (2010) Agúndez, M., Goicoechea, J. R., Cernicharo, J., Faure, A., & Roueff, E. 2010, ApJ, 713, 662
- Allers et al. (2005) Allers, K. N., Jaffe, D. T., Lacy, J. H., Draine, B. T., & Richter, M. J. 2005, ApJ, 630, 368
- Baan et al. (1992) Baan, W. A., Rhoads, J., & Haschick, A. D. 1992, ApJ, 401, 508
- Bally et al. (2000) Bally, J., O’Dell, C. R., & McCaughrean, M. J. 2000, AJ, 119, 2919
- Bernard-Salas et al. (2012) Bernard-Salas, J., Habart, E., Arab, H., et al. 2012, A&A, 538, A37
- Cernicharo et al. (1997) Cernicharo, J., Liu, X.-W., González-Alfonso, E., et al. 1997, ApJ, 483, L65
- Darling & Giovanelli (2002) Darling, J. & Giovanelli, R. 2002, AJ, 124, 100
- Dawson et al. (2014) Dawson, J. R., Walsh, A. J., Jones, P. A., et al. 2014, MNRAS, 439, 1596
- de Graauw et al. (2010) de Graauw, T., Helmich, F. P., Phillips, T. G., et al. 2010, A&A, 518, L6
- Dubernet & Grosjean (2002) Dubernet, M.-L. & Grosjean, A. 2002, A&A, 390, 793
- Elitzur & Watson (1978) Elitzur, M. & Watson, W. D. 1978, ApJ, 222, L141
- Falgarone et al. (2010a) Falgarone, E., Godard, B., Cernicharo, J., et al. 2010a, A&A, 521, L15
- Falgarone et al. (2010b) Falgarone, E., Ossenkopf, V., Gerin, M., et al. 2010b, A&A, 518, L118
- Fedele et al. (2013) Fedele, D., Bruderer, S., van Dishoeck, E. F., et al. 2013, A&A, 559, A77
- Gerin et al. (2016) Gerin, M., Neufeld, D. A., & Goicoechea, J. R. 2016, ARA&A, 54 [arXiv:1601.02985]
- Godard & Cernicharo (2013) Godard, B. & Cernicharo, J. 2013, A&A, 550, A8
- Godard et al. (2012) Godard, B., Falgarone, E., Gerin, M., et al. 2012, A&A, 540, A87
- Godard et al. (2009) Godard, B., Falgarone, E., & Pineau Des Forêts, G. 2009, A&A, 495, 847
- Goicoechea et al. (2011) Goicoechea, J. R., Joblin, C., Contursi, A., et al. 2011, A&A, 530, L16
- Goicoechea et al. (2016) Goicoechea, J. R., Pety, J., Cuadrado, S., et al. 2016, Nature, 537, 207
- Goicoechea et al. (2015) Goicoechea, J. R., Teyssier, D., Etxaluze, M., et al. 2015, ApJ, 812, 75
- Griffin et al. (2010) Griffin, M. J., Abergel, A., Abreu, A., et al. 2010, A&A, 518, L3
- Habart et al. (2010) Habart, E., Dartois, E., Abergel, A., et al. 2010, A&A, 518, L116
- Hammami et al. (2008) Hammami, K., Owono, L. O., Jaidane, N., & Lakhdar, Z. B. 2008, Journal of Molecular Structure: {THEOCHEM}, 860, 45
- Hammami et al. (2009) Hammami, K., Owono Owono, L. C., & Stäuber, P. 2009, A&A, 507, 1083
- Hogerheijde et al. (1995) Hogerheijde, M. R., Jansen, D. J., & van Dishoeck, E. F. 1995, A&A, 294, 792
- Hollenbach et al. (2009) Hollenbach, D., Kaufman, M. J., Bergin, E. A., & Melnick, G. J. 2009, ApJ, 690, 1497
- Hollenbach et al. (2012) Hollenbach, D., Kaufman, M. J., Neufeld, D., Wolfire, M., & Goicoechea, J. R. 2012, ApJ, 754, 105
- Jones et al. (1986) Jones, M. E., Barlow, S. E., Ellison, G. B., & Ferguson, E. E. 1986, Chemical Physics Letters, 130, 218
- Köhler et al. (2014) Köhler, M., Habart, E., Arab, H., et al. 2014, A&A, 569, A109
- Lambert & Danks (1986) Lambert, D. L. & Danks, A. C. 1986, ApJ, 303, 401
- Launay & Roueff (1977) Launay, J. M. & Roueff, E. 1977, A&A, 56, 289
- Lebouteiller et al. (2012) Lebouteiller, V., Cormier, D., Madden, S. C., et al. 2012, A&A, 548, A91
- Lee et al. (2013) Lee, K., Looney, L. W., Schnee, S., & Li, Z.-Y. 2013, ApJ, 772, 100
- Lim et al. (1999) Lim, A. J., Rabadán, I., & Tennyson, J. 1999, MNRAS, 306, 473
- Lis & Schilke (2003) Lis, D. C. & Schilke, P. 2003, ApJ, 597, L145
- Meeus et al. (2013) Meeus, G., Salyk, C., Bruderer, S., et al. 2013, A&A, 559, A84
- Nagy et al. (2013) Nagy, Z., Van der Tak, F. F. S., Ossenkopf, V., et al. 2013, A&A, 550, A96
- Naylor et al. (2010) Naylor, D. A., Dartois, E., Habart, E., et al. 2010, A&A, 518, L117
- Offer & van Dishoeck (1992) Offer, A. R. & van Dishoeck, E. F. 1992, MNRAS, 257, 377
- Offer et al. (1994) Offer, A. R., van Hemert, M. C., & van Dishoeck, E. F. 1994, J. Chem. Phys., 100, 362
- Pellegrini et al. (2009) Pellegrini, E. W., Baldwin, J. A., Ferland, G. J., Shaw, G., & Heathcote, S. 2009, ApJ, 693, 285
- Peng et al. (2012) Peng, T.-C., Wyrowski, F., Zapata, L. A., Güsten, R., & Menten, K. M. 2012, A&A, 538, A12
- Phillips et al. (1996) Phillips, T. R., Maluendes, S., & Green, S. 1996, ApJS, 107, 467
- Pineau des Forets et al. (1986) Pineau des Forets, G., Flower, D. R., Hartquist, T. W., & Dalgarno, A. 1986, MNRAS, 220, 801
- Poglitsch et al. (2010) Poglitsch, A., Waelkens, C., Geis, N., et al. 2010, A&A, 518, L2
- Rangwala et al. (2014) Rangwala, N., Maloney, P. R., Glenn, J., et al. 2014, ApJ, 788, 147
- Robberto et al. (2013) Robberto, M., Soderblom, D. R., Bergeron, E., et al. 2013, ApJS, 207, 10
- Schmelz et al. (1986) Schmelz, J. T., Baan, W. A., Haschick, A. D., & Eder, J. 1986, AJ, 92, 1291
- Spinoglio et al. (2012) Spinoglio, L., Pereira-Santaella, M., Busquet, G., et al. 2012, ApJ, 758, 108
- Storey et al. (1981) Storey, J. W. V., Watson, D. M., & Townes, C. H. 1981, ApJ, 244, L27
- Sturm et al. (2010) Sturm, B., Bouwman, J., Henning, T., et al. 2010, A&A, 518, L129
- Störzer et al. (1995) Störzer, H., Stutzki, J., & Sternberg, A. 1995, A&A, 296, L9
- Sultanov & Balakrishnan (2005) Sultanov, R. A. & Balakrishnan, N. 2005, ApJ, 629, 305
- Tauber et al. (1994) Tauber, J. A., Tielens, A. G. G. M., Meixner, M., & Goldsmith, P. F. 1994, ApJ, 422, 136
- Thi et al. (2011) Thi, W.-F., Ménard, F., Meeus, G., et al. 2011, A&A, 530, L2
- Tielens et al. (1993) Tielens, A. G. G. M., Meixner, M. M., van der Werf, P. P., et al. 1993, Science, 262, 86
- van der Werf et al. (1996) van der Werf, P. P., Stutzki, J., Sternberg, A., & Krabbe, A. 1996, A&A, 313, 633
- Walmsley et al. (2000) Walmsley, C. M., Natta, A., Oliva, E., & Testi, L. 2000, A&A, 364, 301
- White (1984) White, R. E. 1984, ApJ, 284, 695
- Yang et al. (2010) Yang, B., Stancil, P. C., Balakrishnan, N., & Forrey, R. C. 2010, ApJ, 718, 1062
- Zanchet et al. (2013) Zanchet, A., Godard, B., Bulut, N., et al. 2013, ApJ, 766, 80