Optical spectroscopy study of charge density wave order in Sr3Rh4Sn13 and (Sr0.5Ca0.5)3Rh4Sn13
Abstract
We perform optical spectroscopy measurement on single-crystal samples of Sr3Rh4Sn13 and (Sr0.5Ca0.5)3Rh4Sn13. Formation of CDW energy gap was clearly observed for both single-crystal samples when they undergo the phase transitions. The existence of residual Drude components in below TCDW indicates that the Fermi surface is only partially gapped in the CDW state. The obtained value of 2/KBTCDW is roughly 13 for both Sr3Rh4Sn13 and (Sr0.5Ca0.5)3Rh4Sn13 compounds, which is considerably larger than the mean-field value based on the weak-coupling BCS theory. The measurements provide optical evidence for the strong coupling characteristics of the CDW phase transition.
I introduction
Collective quantum phenomena, such as charge density waves (CDW s) and spin density waves, are among the most fascinating phenomena in solids and have been a subject of considerable interest in condensed matter physics. The CDWs are mediated by the electron-phonon coupling and are predominantly driven by the nesting of Fermi surfaces (FSs), that is, the presence of two patches of almost parallel FSs that are separated by a wave vector . A single particle energy gap would form in the nested region of the FSs in the CDW ordered state. CDW instability usually appears in low dimensional materials, for example, in quasi one-dimensional (1D) compounds, e.g. K0.3MoO3 Travaglini and Wachter (1984), and 2D transition metal dichalcogenidesWU and LIEBER (1989), on which the FSs could be easily nested. Upon increasing the dimensions of the samples, the FSs usually become more complex and the nesting conditions become less favored.
Although it is hard to form CDW in 3D materials, recent investigations on A3T4Sn13 (where A=La, Sr, Ca and T=Rh and Ir) with cubic Yb3Rh4Sn13-type structure revealed interesting coexistence of structural phase transition and superconductivity Wang et al. (2015); Mazzone et al. (2015); Biswas et al. (2015); Hou et al. (2016); Lue et al. (2016); Ślebarski et al. (2016); C.W.Luo et al. (2016); Yang et al. (2010); Kase et al. (2011); Hayamizu et al. (2011); Wang and Petrovic (2012); Zhou et al. (2012); Gerber et al. (2013); Liu et al. (2013); Ślebarski et al. (2014); Yu et al. (2015); Tompsett (2014); Biswas et al. (2014); Fang et al. (2014); Kuo et al. (2014); Goh et al. (2015); Klintberg et al. (2012); Lue et al. (2016). The structural phase transition leads to the formation of a superlattice modulation, which has a lattice parameter twice of that of the high temperature phase. It has been further argued that this superlattice transition is associated with a CDW transition of the conduction electron system. For Sr3Ir4Sn13 and Sr3Rh4Sn13, systematic variation of superconducting transition temperature Tc and CDW phase transition temperature TCDW have been observed when the unit cell volume of the crystal is varied via chemical substitution. When Sr is partially replaced by Ca, which simulates a positive chemical pressure on the crystals, TCDW is suppressed whereas Tc increases Goh et al. (2015); Klintberg et al. (2012); Yu et al. (2015); Tompsett (2014).
Optical spectroscopy is a powerful bulk-sensitive technique to detect the energy gaps in ordered state. It yields a great wealth of information about charge excitations and dynamical properties in CDW systems. The recent optical spectroscopy study on Sr3Ir4Sn13 with Tc = 5 K and TCDW =147 K revealed an energy gap-like suppression in optical conductivity below the structural phase transition temperature. The extracted value of 2/kBTCDW is significantly higher than the BCS mean-field value of 3.5 for a density-wave phase transition, pointing towards a strong coupling charge density wave orderFang et al. (2014). With the purpose to know whether the unconventional strong coupling CDW phase transition commonly exists in such intermetallic compounds, we performed optical spectroscopy measurements on Sr3Rh4Sn13 and (Sr0.5Ca0.5)3Rh4Sn13, the sister compound of Sr3Ir4Sn13. The two compounds have the superconducting transition temperatures Tc 4.2 K and 7K and CDW transition temperatures TCDW 138K and 55K, respectively Yu et al. (2015); Goh et al. (2015); Kuo et al. (2015). Our measurement revealed a depletion of low frequency spectral weight due to the formation of CDW energy gap with a significantly large ratio of 2/kBT, yielding optical evidence for a strong coupling CDW order.
II EXPERIMENTS
The Sr3Rh4Sn13 and (Sr0.5Ca0.5)3Rh4Sn13 single crystals were grown by Sn self-flux method. Detailed descriptions about crystal growth and characterizations were presented in Ref. Kuo et al. (2015). The optical reflectance measurements were performed on as-grown shinny surfaces of the single crystals with a combination of Bruker 113v, Vertex 80v and grating-type spectrometers in the frequency range from 40 to 40000 cm-1 . An in-situ gold and aluminum over-coating technique was used to get the reflectance Homes et al. (1993). The measured reflectance was then corrected by multiplying the available curves of gold and aluminum reflectivity at different temperatures. The real part of conductivity was obtained by the Kramers-Kronig transformation of R() employing an extrapolation method with X-ray atomic scattering functions Tanner (2015). This approach of Kramers-Kronig transformation was proved to be more accurate and effective in the analysis.
III RESULTS AND DISCUSSIONS
Figure 1 shows the reflectance spectra R() of Sr3Rh4Sn13 and (Sr0.5Ca0.5)3Rh4Sn13 over a broad energy scale at various temperatures. Because gold (or aluminum) depositions were performed only at room temperature, R() at room temperature, being obtained from the ratio of measurements just before and after the deposition, has the highest data quality and accuracy. For the low temperature measurement, the sample (and also the reference) have to be cooled down twice in order to obtain the reflectance spectra. As a consequence the data have relatively higher uncertainty and noise level, in particular at very low frequencies. Therefore we need to choose a suitable cutoff frequency for the low frequency extrapolation in Kramers-Kronig transformation. As seen from Fig. 1, the value of R() approach unity at zero frequency, both above and below the TCDW phase transition, indicating they are both metallic in nature. By lowering the temperature, we do not see any sharp change in the optical spectra, but the difference between them is evident. For Sr3Rh4Sn13, the low frequency R(), roughly below 800 cm-1 , shows an upturn below the TCDW phase transition, while the R() values between 1000 and 1300 cm-1 (marked by an arrow) are somewhat suppressed. Those features are resolved more clearly for the spectrum at 10 K. The spectral changes signal the opening of a partial energy gap below the TCDW phase transition, as we shall see more clearly in the optical conductivity spectra below. Similar spectral evolutions are also seen in (Sr0.5Ca0.5)3Rh4Sn13 sample although the suppression is weaker and locates at lower frequencies. The spectral features at higher energy scales, for example near 3000 cm-1 and 5000 cm-1 , should come from interband transitions.
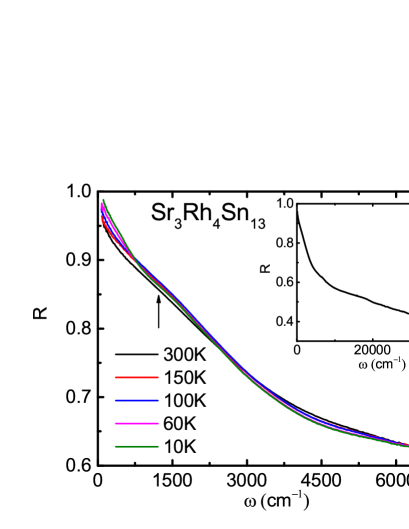
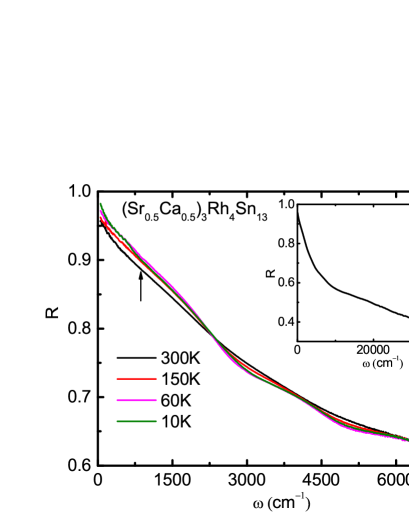
Figure 2 illustrates the real part of conductivity obtained by the Kramers-Kronig transformation of R() at selected temperatures. The evolution of the electronic states is more clearly reflected in the conductivity spectra. The Drude-type conductivity is observed at all temperatures at low frequency for both Sr3Rh4Sn13 and (Sr0.5Ca0.5)3Rh4Sn13, indicating their good metallic response. For Sr3Rh4Sn13, the optical conductivity between 1000 and 6000 cm-1 is gradually suppressed with temperature decreasing, and the Drude component becomes narrower. Upon cooling the sample across the TCDW phase transition, a significant spectral weight suppression also develops in the Drude components and a broad peak-like feature forms near 1300 cm-1 which becomes more and more obvious as the temperature decreases (marked by an arrow). The existence of a residual Drude component in below TCDW indicates that the Fermi surface is only partially gapped in the CDW state.
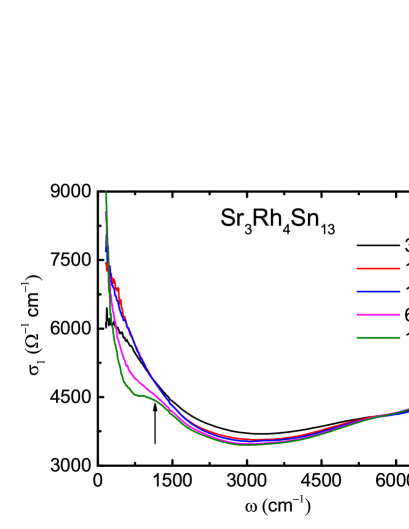
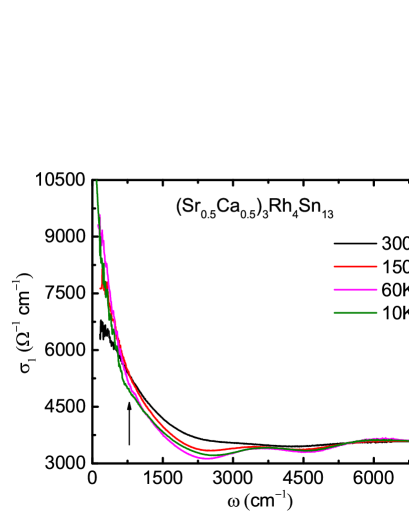
The hallmark of a symmetry-broken phase transition, such as superconductivity or density wave order, is the formation of an energy gap near the Fermi level EF, resulting in a lowering of the total energy of the system. However, due to different coherent factors (case I for density wave and case II for superconductivity), the characteristic energy gap features of superconductivity and density wave orders are different in optical conductivity Degiorgi et al. (1996). In an s-wave superconducting state at T = 0, the absorption smoothly rises at the gap frequency and gradually merges to the conductivity spectrum at temperatures higher than Tc, while for a density wave order, the opening of an energy gap leads to a nonsymmetric peak with clear edge-like feature near in the optical conductivity. The edge-like feature at could be significantly weakened for a multiple band system with presence of only a partial density wave energy gap. Nevertheless, the density wave-type energy gap value is usually estimated by using the peak position (conductivity maximum) Degiorgi et al. (1996); Hu et al. (2008). The observation of a characteristic peak-like structure above the gap yields optical evidence for a density wave type phase transition. In the (Sr0.5Ca0.5)3Rh4Sn13 case, a similar but weaker gaplike feature is present and shifts to lower energies. So we identified the formation of a CDW induced partial energy gap in Sr3Rh4Sn13 and its evolution with Ca substitution.
Since the Drude component represents the contribution from conduction electrons, the suppression of the spectral weight of Drude component observed in our optical experiment suggests the partial removal of the Fermi surfaces below the phase transition. At variance with other compounds possessing first-order structural phase transitions, e.g. IrTe2Fang et al. (2013) or BaNi2As2Chen et al. (2009), where the optical conductivity spectra develop sudden and dramatic changes over broad frequencies across the phase transitions owing to the reconstruction of the band structures, the present case is more similar to some CDW materials such as 2H-TaS2 Hu et al. (2007), whose spectral suppression features are rather weak and evolve continuously with temperature.
For Sr3Rh4Sn13, A notable point is that the gap size at the lowest measurement temperature (10 K), which could be approximately identified as the peak position at 1300 cm-1 , is surprisingly large. The ratio of the energy gap relative to the transition temperature 2/kBTCDW is about 13, And this value is almost similar for (Sr0.5Ca0.5)3Rh4Sn13. Similar gap ratios were also observed in other low-dimensional density wave materials, e.g., the Na2Ti2Sb2OHuang et al. (2013), Na2Ti2As2OHuang et al. (2014) and H. P. Wang and Wang (2014) compound. This ratio is much larger than the BCS (Bardeen-Cooper-Schrieffer) mean-field value of 3.52 for a density wave phase transition. This means that the transition temperature is significantly lower than the mean-field transition temperature. In low dimension compounds, the reduced phase transition temperature could be ascribed to the enhanced CDW fluctuation effect, so that the global CDW order is stabilized at lower temperature. Considering the fact that the density wave fluctuation effect should be negligible in such 3D cubic systems, the vary big values of 2/kBTCDW must have an unusual origin.
It is known that the conventional theory for CDW condensate is based on the weak coupling limit of electron-phonon interactions. It assumes that the coherence length in the transition is very long. Then the number of phonon modes which participate in the CDW phase transition is limited by this physical cutoff . In the circumstances, the phonon frequencies are modified only over a small region of reciprocal space and the phonon entropy is unimportant as compared to the electron excitations across the gap. The weak-coupling approach predicts that the ratio of the CDW gap at T =0 to transition temperature is . However, it does not fit to experimental observations in many systems, including the present observation. McMillan reformulated the theory McMillan (1976), assuming that the coherence length in the transition could be very short. This means that phonons over a substantial part of the Brillouin zone are affected in the transition so that the dominant entropy is the lattice entropy. The lattice-entropy model is in good agreement with experiment, and the short correlation length is confirmed by several experiments.
With the need for explaining the short correlation length and the consequent large observed values of , Varma and Simons proposed a microscopic strong coupling theory. The essential ingredients of the theory are the strong wave-vector dependence of electronically induced anharmonicity and mode-mode coupling which are shown to strongly depress the transition. This is the origin of large value of Varma and Simons (1983). In our earlier study on Sr3Ir4Sn13Fang et al. (2014), the strong-coupling scenario was employed to explain the very big value of 2/kBTCDW and the very large specific heat jump at the phase transition. This strong coupling mechanism may also apply to the present study. It deserves to remark that in the earlier study on Sr3Ir4Sn13, an even larger value of 2/kBTCDW was obtained. Here we suggest two possibilities for the observation of relative smaller values of 2/kBTCDW for Sr3Rh4Sn13. The first one is that the Sr3Ir4Sn13 has even shorter coherence length which therefore leads to higher 2/kBTCDW . Indeed, a comparative study on the thermodynamic properties in Sr3Rh4Sn13 and Sr3Ir4Sn13 by some of present authors indicated an enhancement in the electronic specific-heat jump from its mean-field value, revealing the strong-coupling nature of the observed phase transitions. Specifically, a higher power of divergence in CP near TCDW was seen for Sr3Ir4Sn13 than for Sr3Rh4Sn13, reflecting the fact that Sr3Ir4Sn13 has a shorter coherence length Lue et al. (2016). Another possibility is that in the earlier study the optical measurement was performed on polished surfaces, while in the present study the optical measurement was performed on as-grown shinny surfaces. Since mechanical polishing may induce site disorders in the surface and, to some extent, damage the sample surface, some uncertainty or extrinsic effect may be caused in the reflectance measurement. Therefore, measurement on the as-grown surface is more reliable.
To quantitatively characterize the spectral change across the phase transition, particularly the evolution of the Drude part, we decompose the optical conductivity spectral into different components using a Drude-Lorentz analysisHu et al. (2008).
| (1) |
Here, is the dielectric constant at high energy; the middle term is the Drude component that characterizes the electrodynamics of itinerate carriers, and the last term is the Lorentz component that describes excitations across energy gaps or interband transitions. As indicated by the band structure calculations, for Sr3Ir4Sn13, several bands cross the Fermi level and the Fermi surfaces are rather complicated X.Chen ; Klintberg et al. (2012); Tompsett (2014). Due to the crystallographic similarity, the (Sr,Ca)3Rh4Sn13 may have similar band structures. In addition, a transport study on Sr3Rh4Sn13 reveals that, upon cooling, its Hall coefficient RH changes from negative sign to positive sign, suggests a multiband character of the Fermi surfaces Kuo et al. (2015). On this basis, we applied two Drude components in the analysis here. In order to reproduce the optical conductivity below 25 000 cm-1 at 300 K, we also add three Lorentz terms. Furthermore, an additional Lorentz component centered at 1300 cm-1 and 930 cm-1 , respectively (L4 in Fig. 3) is added at temperatures below the phase transition.
Figure 3 illustrates the conductivity spectra at 10 and 300 K together with the Drude-Lorentz fitting components for Sr3Rh4Sn13 and (Sr0.5Ca0.5)3Rh4Sn13. We are mainly concerned about the evolution of the low energy conductivity, therefore the fitting parameters for the two Drude components of the two compounds are shown in the Table 1 and Table 2 for different temperatures. We find that the two Drude components narrow with decreasing temperature due to the metallic response. The gapping of the Fermi surfaces reduces the spectral weight of the two Drude component. Compared with the spectral weight distribution at 300 K, the spectral weight of the two Drude components decreases and the suppressed part of the two Drude components is transferred to that of the added L4 at 10 K, the other Lorentz components have nearly no change.
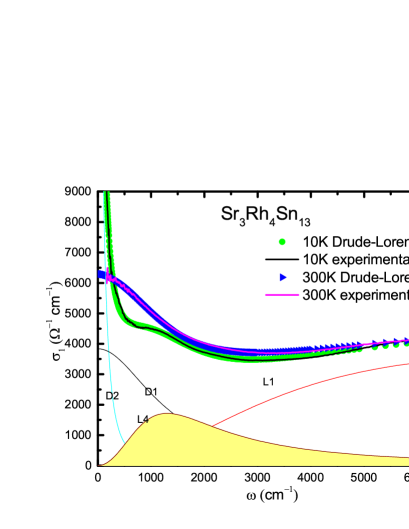
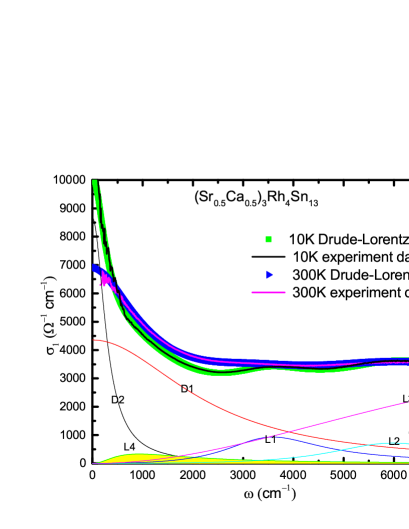
We use the formula P= to estimate the overall plasma frequency. For Sr3Rh4Sn13, we obtain P25950 cm-1 at 300 K and P19770 cm-1 at 10 K, respectively. For (Sr0.5Ca0.5)3Rh4Sn13, P27540 cm-1 at 300 K and P26450 cm-1 at 10 K. Therefore, for Sr3Rh4Sn13 and (Sr0.5Ca0.5)3Rh4Sn13, the ratio of the plasma frequency in the low temperature phase to that at 300 K is about 0.77, 0.96, respectively. It is well known that is proportional to , where is the density of free carriers and stands for the effective mass of quasiparticles. The reduction of the plasma frequency below the phase transition could apparently be ascribed to the partial gapping of the Fermi surfaces. It also deserves remark that, although the optical measurement revealed the formation of energy gap, the measurement could not determine where the FSs are gapped. A momentum-resolved experimental probe, such as angle-resolved photoemission, should be used to determine the gapped regions and corresponding wave vectors.
Finally, we would like to remark that, for (Sr0.5Ca0.5)3Rh4Sn13, apparent temperature induced spectral changes are also seen between 3000 and 5000 cm-1, comparatively relatively week features are seen at higher energy scales (roughly between 5000 and 6700 cm-1) for Sr3Rh4Sn13. We would like to emphasize that those features are not directly related to the CDW order, because they are present above and their energy scales are much larger than the CDW energy gaps. Therefore, they should be attributed to certain interband transitions. Usually, the interband transitions involving the bands crossing the Fermi level as the initial or final states would display certain temperature dependence since the Fermi distribution function would lead to some modification on the electron distributions in those bands at different temperatures. The partial substitution of Ca for Sr should have a positive chemical pressure effect on the material. To some extent it may change the band structure of the compound, which could be the reason for the energy difference between the two samples.
| T(K) | ||||||
|---|---|---|---|---|---|---|
| 300 | 19600(130) | 2250(110) | 17000(780) | 1380(40) | 0(0) | 25950 |
| 150 | 19200(360) | 2130(150) | 17000(230) | 1050(10) | 0(0) | 25640 |
| 100 | 17000(500) | 1600(40) | 13100(110) | 490(10) | 14400(640) | 21460 |
| 60 | 17000(120) | 1400(20) | 10700(40) | 210(10) | 15500(660) | 20090 |
| 10 | 17000(20) | 1200(20) | 10100(20) | 90(5) | 16300(700) | 19770 |
| T(K) | ||||||
|---|---|---|---|---|---|---|
| 300 | 25100(80) | 2450(8) | 11340(100) | 820(100) | 0(0) | 27540 |
| 150 | 25000(100) | 2380(10) | 11320(100) | 560(80) | 0(0) | 27440 |
| 60 | 24950(80) | 2300(10) | 11300(100) | 320(70) | 0(0) | 27390 |
| 10 | 24440(70) | 2300(5) | 10120(50) | 300(5) | 6510(500) | 26450 |
IV conclusion
To conclude, we perform optical spectroscopy measurements across the structural phase transition on single-crystal samples of Sr3Rh4Sn13 and (Sr0.5Ca0.5)3Rh4Sn13. Clear energy gap formations were observed for both single-crystal samples when they undergo the charge-density wave transitions. The phase transition leads to only partial removal of the itinerant carriers. The obtained 2/KBTCDW values are roughly 13 for Sr3Rh4Sn13 and (Sr0.5Ca0.5)3Rh4Sn13. The value is considerably larger than the mean-field value based on the weak-coupling BCS theory, suggesting possibly a strong coupling mechanism. The observed spectral feature in (SrxCa1-x)3Rh4Sn13 resembles those seen in many other CDW systems.
ACKNOWLEDGMENTS
This work was supported by the National Science Foundation of China (No. 11327806), the National Key Research and Development Program of China (No.2016YFA0300902), and the Ministry of Science and Technology of Taiwan with the grant number of MOST-103-2112-M-006-014-MY3 (CSL).
References
- Travaglini and Wachter (1984) G. Travaglini and P. Wachter, Phys. Rev. B 30, 1971 (1984).
- WU and LIEBER (1989) X. L. WU and C. M. LIEBER, SCIENCE 243, 1703 (1989).
- Wang et al. (2015) L. M. Wang, C.-Y. Wang, G.-M. Chen, C. N. Kuo, and C. S. Lue, New Journal of Physics 17, 033005 (2015).
- Mazzone et al. (2015) D. G. Mazzone, S. Gerber, J. L. Gavilano, R. Sibille, M. Medarde, B. Delley, M. Ramakrishnan, M. Neugebauer, L. P. Regnault, D. Chernyshov, A. Piovano, T. M. Fernandez-Diaz, L. Keller, A. Cervellino, E. Pomjakushina, K. Conder, and M. Kenzelmann, Phys. Rev. B 92, 024101 (2015).
- Biswas et al. (2015) P. K. Biswas, Z. Guguchia, R. Khasanov, M. Chinotti, L. Li, K. Wang, C. Petrovic, and E. Morenzoni, Phys. Rev. B 92, 195122 (2015).
- Hou et al. (2016) J. Hou, C. H. Wong, R. Lortz, R. Sibille, and M. Kenzelmann, Phys. Rev. B 93, 134505 (2016).
- Lue et al. (2016) C. S. Lue, C. N. Kuo, C. W. Tseng, K. K. Wu, Y.-H. Liang, C.-H. Du, and Y. K. Kuo, Phys. Rev. B 93, 245119 (2016).
- Ślebarski et al. (2016) A. Ślebarski, J. Goraus, M. M. Maśka, P. Witas, M. Fijałkowski, C. T. Wolowiec, Y. Fang, and M. B. Maple, Phys.rev.B 93, 245126 (2016).
- C.W.Luo et al. (2016) C.W.Luo, P.C.Cheng, C.M.Tu, C.N.Kuo, C.M.Wang, and C.S.Lue, New Journal of Physics 18, 073045 (2016).
- Yang et al. (2010) J. Yang, B. Chen, C. Michioka, and K. Yoshimura, Journal of the Physical Society of Japan 79, 113705 (2010).
- Kase et al. (2011) N. Kase, H. Hayamizu, and J. Akimitsu, Phys. Rev. B 83, 184509 (2011).
- Hayamizu et al. (2011) H. Hayamizu, N. Kase, and J. Akimitsu, Journal of the Physical Society of Japan 80, SA114 (2011).
- Wang and Petrovic (2012) K. Wang and C. Petrovic, Phys. Rev. B 86, 024522 (2012).
- Zhou et al. (2012) S. Y. Zhou, H. Zhang, X. C. Hong, B. Y. Pan, X. Qiu, W. N. Dong, X. L. Li, and S. Y. Li, Phys. Rev. B 86, 064504 (2012).
- Gerber et al. (2013) S. Gerber, J. L. Gavilano, M. Medarde, V. Pomjakushin, C. Baines, E. Pomjakushina, K. Conder, and M. Kenzelmann, Phys. Rev. B 88, 104505 (2013).
- Liu et al. (2013) H. F. Liu, C. N. Kuo, C. S. Lue, K.-Z. Syu, and Y. K. Kuo, Phys. Rev. B 88, 115113 (2013).
- Ślebarski et al. (2014) A. Ślebarski, M. Fijałkowski, M. M. Maśka, M. Mierzejewski, B. D. White, and M. B. Maple, Phys. Rev. B 89, 125111 (2014).
- Yu et al. (2015) W. C. Yu, Y. W. Cheung, P. J. Saines, M. Imai, T. Matsumoto, C. Michioka, K. Yoshimura, and S. K. Goh, Phys. Rev. Lett. 115, 207003 (2015).
- Tompsett (2014) D. A. Tompsett, Phys. Rev. B 89, 075117 (2014).
- Biswas et al. (2014) P. K. Biswas, A. Amato, R. Khasanov, H. Luetkens, K. Wang, C. Petrovic, R. M. Cook, M. R. Lees, and E. Morenzoni, Phys. Rev. B 90, 144505 (2014).
- Fang et al. (2014) A. F. Fang, X. B. Wang, P. Zheng, and N. L. Wang, Phys. Rev. B 90, 035115 (2014).
- Kuo et al. (2014) C. N. Kuo, H. F. Liu, C. S. Lue, L. M. Wang, C. C. Chen, and Y. K. Kuo, Phys. Rev. B 89, 094520 (2014).
- Goh et al. (2015) S. K. Goh, D. A. Tompsett, P. J. Saines, H. C. Chang, T. Matsumoto, M. Imai, K. Yoshimura, and F. M. Grosche, Phys. Rev. Lett. 114, 097002 (2015).
- Klintberg et al. (2012) L. E. Klintberg, S. K. Goh, P. L. Alireza, P. J. Saines, D. A. Tompsett, P. W. Logg, J. Yang, B. Chen, K. Yoshimura, and F. M. Grosche, Phys. Rev. Lett. 109, 237008 (2012).
- Kuo et al. (2015) C. N. Kuo, C. W. Tseng, C. M. Wang, C. Y. Wang, Y. R. Chen, L. M. Wang, C. F. Lin, K. K. Wu, Y. K. Kuo, and C. S. Lue, Phys. Rev. B 91, 165141 (2015).
- Homes et al. (1993) C. C. Homes, M. Reedyk, D. A. Cradles, and T. Timusk, Appl. Opt. 32, 2976 (1993).
- Tanner (2015) D. B. Tanner, Phys. Rev. B 91, 035123 (2015).
- Degiorgi et al. (1996) L. Degiorgi, M. Dressel, A. Schwartz, B. Alavi, and G. Grüner, Phys. Rev. Lett. 76, 3838 (1996).
- Hu et al. (2008) W. Z. Hu, J. Dong, G. Li, Z. Li, P. Zheng, G. F. Chen, J. L. Luo, and N. L. Wang, Phys. Rev. Lett. 101, 257005 (2008).
- Fang et al. (2013) A. F. Fang, G. Xu, T. Dong, P. Zheng, and N. L. Wang, SCIENTIFIC REPORTS 3 (2013), 10.1038/srep01153.
- Chen et al. (2009) Z. G. Chen, G. Xu, W. Z. Hu, X. D. Zhang, P. Zheng, G. F. Chen, J. L. Luo, Z. Fang, and N. L. Wang, Phys. Rev. B 80, 094506 (2009).
- Hu et al. (2007) W. Z. Hu, G. Li, J. Yan, H. H. Wen, G. Wu, X. Chen, and N. L. Wang, Phys. Rev. B 76, 045103 (2007).
- Huang et al. (2013) Y. Huang, H. P. Wang, W. D. Wang, Y. G. Shi, and N. L. Wang, Phys. Rev. B 87, 100507 (2013).
- Huang et al. (2014) Y. Huang, H. P. Wang, R. Y. Chen, X. Zhang, P. Zheng, Y. G. Shi, and N. L. Wang, Phys. Rev. B 89, 155120 (2014).
- H. P. Wang and Wang (2014) X. B. W. Y. H. T. D. R. Y. C. G. H. C. H. P. Wang, Y. L. Sun and N. L. Wang, Phys. Rev. B 90, 144508 (2014).
- McMillan (1976) W. L. McMillan, Phys. Rev. B 16, 245119 (1976).
- Varma and Simons (1983) C. M. Varma and A. L. Simons, Phys. Rev. Lett. 51, 138 (1983).
- (38) X.Chen, Phys.rev.B 93, 235121.