Extraction of -slopes from experimental and cross section data
Abstract
We analyze recent meson photoproduction data from the CLAS collaboration for the reactions and , fitting measured forward-angle differential cross sections to the form . We develop a quantitative scheme for determining the kinematic region where the fit is to be done, and, from the extracted -slope , determine whether single-Reggeon exchange can explain the production mechanism. We find that, in the region GeV2, production of the channel can be explained by single Reggeon exchange, but the production channel cannot. We verify these conclusions by fitting the data to a differential cross section produced by the interfering sum of two exponential amplitudes.
I Introduction
In recent years, the CEBAF Large Acceptance Spectrometer (CLAS) collaboration at Jefferson Lab has collected a large volume of high-precision data for the unpolarized photoproduction of mesons from a proton target with a or hyperon as the recoil baryon Bradford et al. (2006); McCracken et al. (2010); Dey et al. (2010). The experiments measured the differential cross section for a range of low and intermediate photon energies from GeV to GeV, corresponding to squared center-of-momentum energies from GeV2 to GeV2, and a wide range of angles from the forward to backward region.
Such a wide kinematic coverage allows for the data to be used in testing a variety of models with different domains of applicability. For instance, at central angles—specifically, in the center-of-momentum frame—the quark counting rule can be tested Schumacher and Sargsian (2011). By contrast, at forward angles, one can investigate the applicability of diffractive scattering and production models, such as those formulated on the basis of Regge theory. Additionally, the photoproduction data has been vital in the extraction of intermediate -channel resonances in both partial wave analyses and effective field theories (cf. Anisovich et al. (2007); Nikonov et al. (2008); Anisovich et al. (2011a, b, 2012, 2014)). The range of photon energies at which these measurements were done allows the tests of said models to be extended into center-of-momentum energies below which they have so far been successfully applied.
In this work, we look specifically at the recent CLAS data in the diffractive, forward production regime. Within this regime, it has been customary (cf. e.g., Bauer et al. (1978)) to fit data to an exponential function:
| (1) |
It is specifically the -slope factor that we will extract. Moreover, we will develop a quantitative scheme for determining the range of over which the fit to Eq. (1) should be done.
The paper is organized as follows. In Section II, we briefly review some basic results from Regge theory that justify the use of Eq. (1) and help determine its range of validity. In Section III, we perform the exponential fit to recent CLAS data for the reactions and and develop a scheme for determining the appropriate range of values to perform the fit. In Section IV, we perform an additional fit to the interfering sum of two exponentials in order to further investigate the results of the prior section. Finally, in V, we reiterate our conclusions and consider implications of this investigation.
II -slopes and Regge trajectories
Regge theory is a phenomenological theory that explains hadronic scattering amplitudes using mathematical properties of the scattering matrix in place of a fundamental theory of the strong nuclear interaction. It relies on imposing a handful of simple properties, namely unitarity of the -matrix, analyticity in terms of physical observables, and crossing symmetry in order to constrain the functional form that the scattering amplitude.
One of the most fruitful methods employed by Regge theory is to analytically continue functions of the angular momentum quantum number into the complex plane. This allows a partial-wave expansion of the scattering amplitude to be rewritten as a sum of integrals around cuts and poles in the complex- plane, in what is known as the Sommerfeld-Watson representation. Cuts tend to dominate the scattering amplitude at high , while poles dominate at smaller Collins (2009).
Using the fit form in Eq. (1) for a given value finds justification within Regge theory, provided that the reaction has a large center-of-momentum energy and a small invariant momentum transfer . More precisely, the conditions and should hold. The small leads us to expect poles to dominate the Sommerfeld-Watson representation of the scattering amplitude, and the conditions and together mean the contribution of one pole to the scattering amplitude follows the asymptotic form Collins (2009):
| (2) |
where is a function of alone. Here, is not actually constant, but a function of . However, the -dependence of is conventionally neglected and a central value of GeV2 is typically used Collins (2009); Guidal et al. (1997). The function is the real part of the location of the pole in the complex- plane, which represents infinitely many exchanged particles with different but otherwise identical quantum numbers.
Due to crossing symmetry, the function should be defined for both positive and negative values of its argument. In particular, where appears in a -channel diagram for the process , the expression will appear in an expression for the “crossed” process . When is the squared mass of a resonance with the quantum numbers of the Regge pole in question and internal angular momentum , i.e., when , one should have . This allows for phenomenological extraction of the functional form of in the region, and one typically finds to be approximately linear in this region. The line along which these exchange particles fall, and likewise the function , is called a Regge trajectory. The particles falling on a Regge trajectory are formally treated as a single fictitious particle with complex angular momentum called a Reggeon.
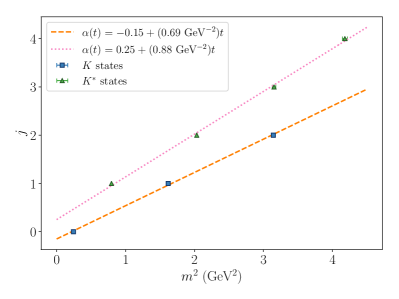
Relevant to the present work, the and mesons fall along linear trajectories on a vs. plot, as can be seen in Fig. 1. Since analyticity is also imposed on , the linear form is expected to hold at least for small as well. It is commonly understood (see e.g., Collins (2009); Guidal et al. (1997)) that the Regge trajectory saturates for larger values of and no longer follows this linear trend, but this nonlinear behavior can be neglected by keeping small, as is needed for the asymptotic form of Eq. (2) (and the negligibility of complex- cuts) to hold.
Using the linear form of the Regge trajectory, along with Eq. (2), gives the exponential fit form if we assume a single Regge trajectory (i.e., one pole in the complex- plane) contributes to the overall scattering amplitude. One moreover has
| (3) |
giving a theoretical expectation as to how the -slope we extract from the data should vary with .
In the following section we will extract the -slopes from recent CLAS and older world data for and (hereafter the and channels, respectively) by fitting these data to Eq. (1). In light of Eq. (3) from Regge theory, we will study the dependence of on the squared center-of-momentum energy, , to see if this dependence is in fact logarithmic, and to see if the slope of versus corresponds to either or . To find as much for either channel would suggest that photoproduction of this channel is dominated by exchange of a single Reggeon in the diffractive region.
III Exponential Fit and Slope Factors
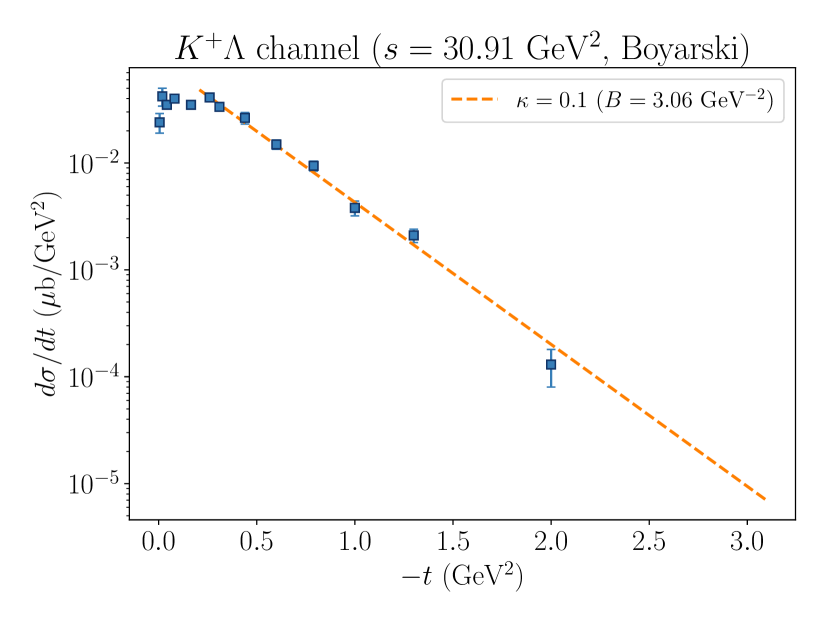
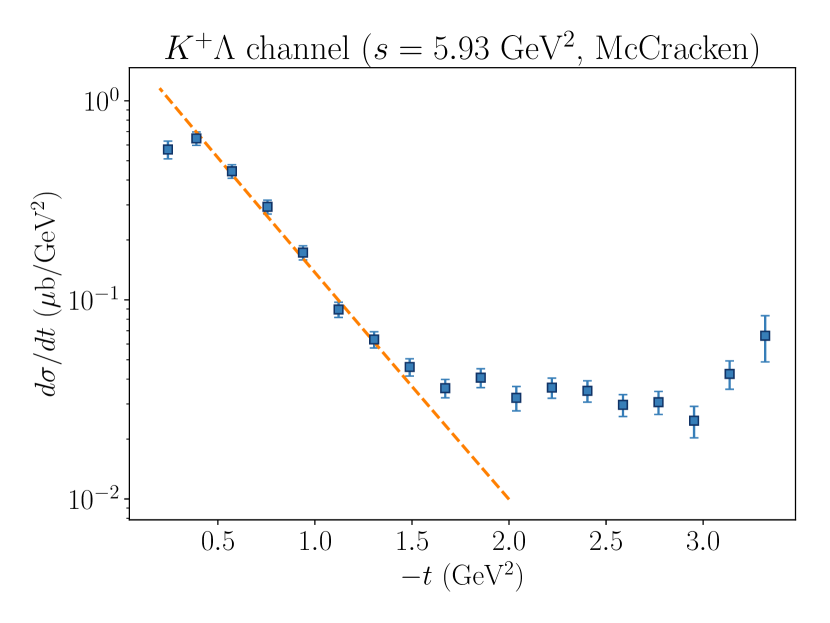
As explained in the previous section, Eq. (1) is valid for a fixed, large value of under the condition . However, there is currently no fixed quantitative scheme for determining what range of the condition corresponds to. Typically, at sufficiently high , one can determine the range for which this fit is valid by visual inspection of a log-scaled plot. For instance, in Fig. 2, one can see an unambiguous straight line when is plotted against with the -axis logarithmically scaled.
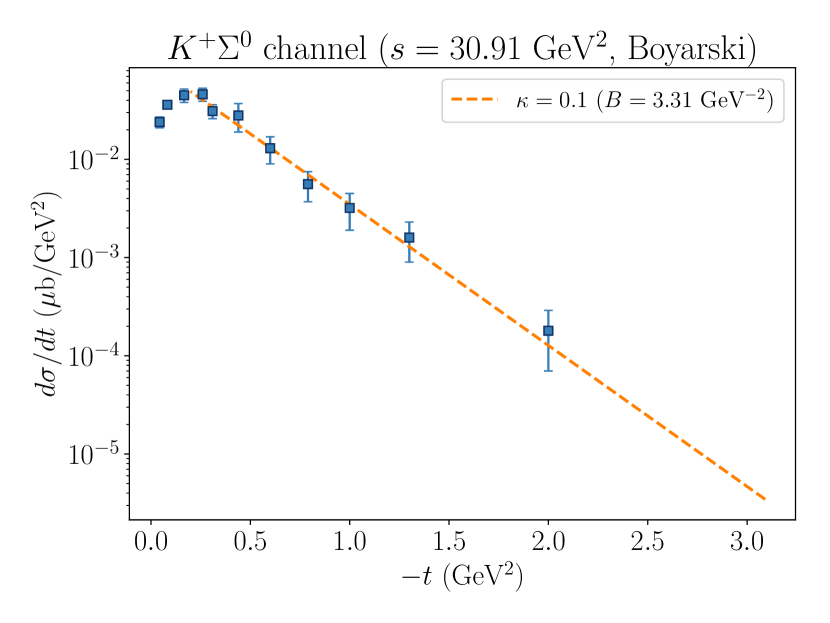
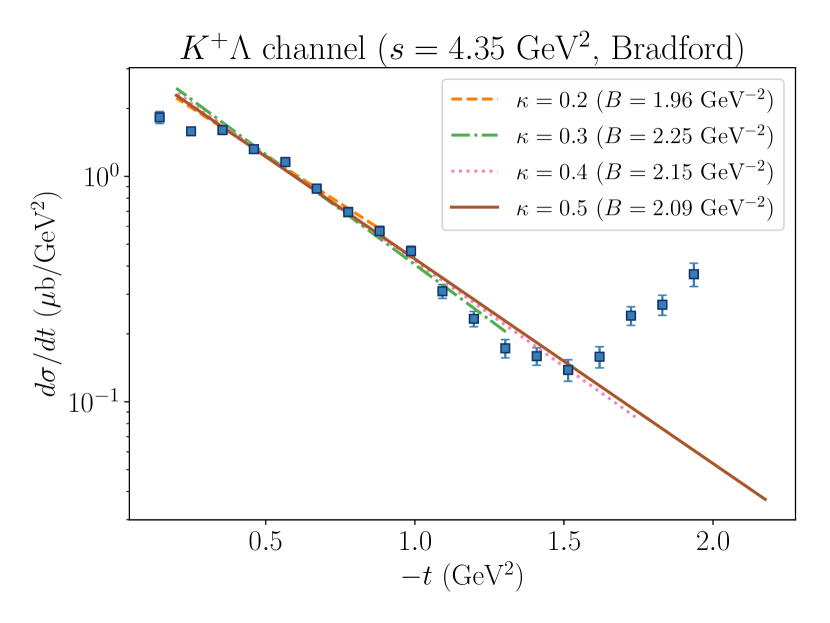
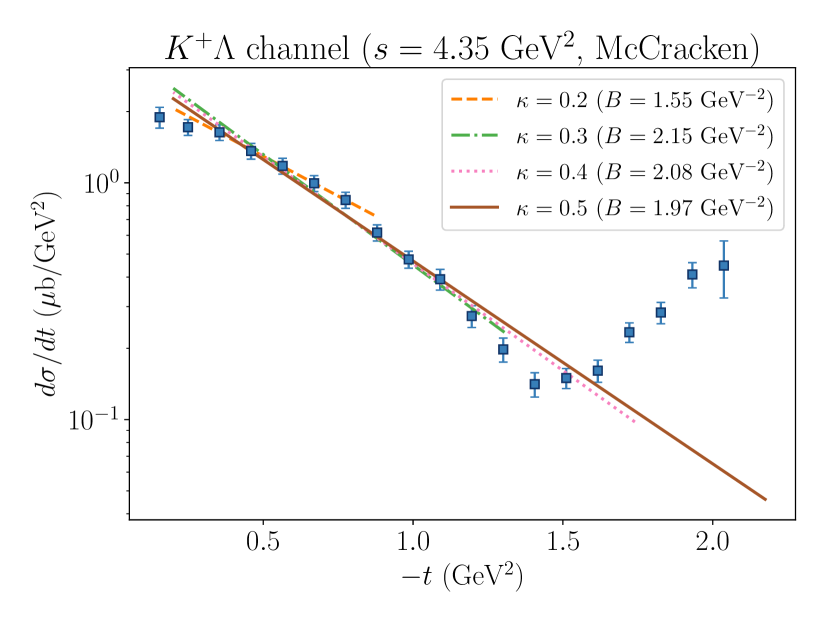
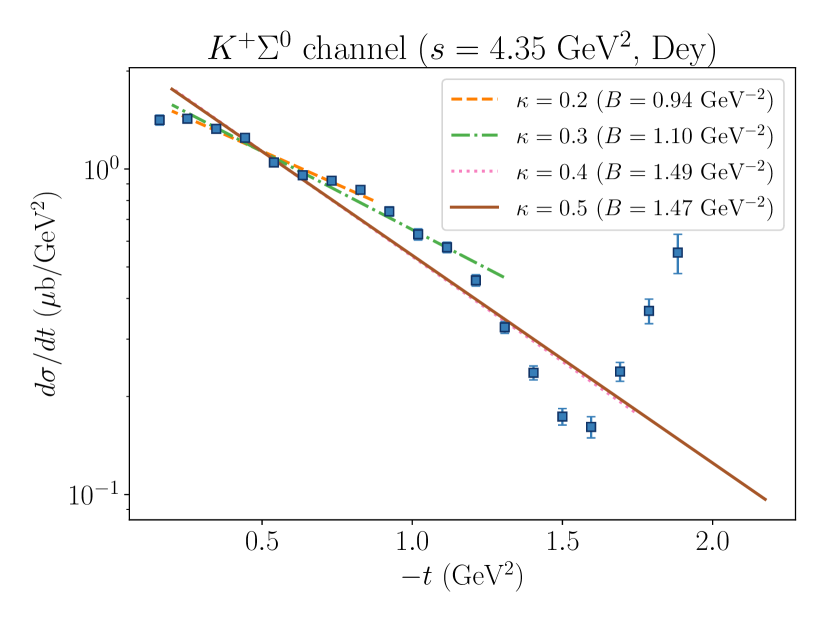
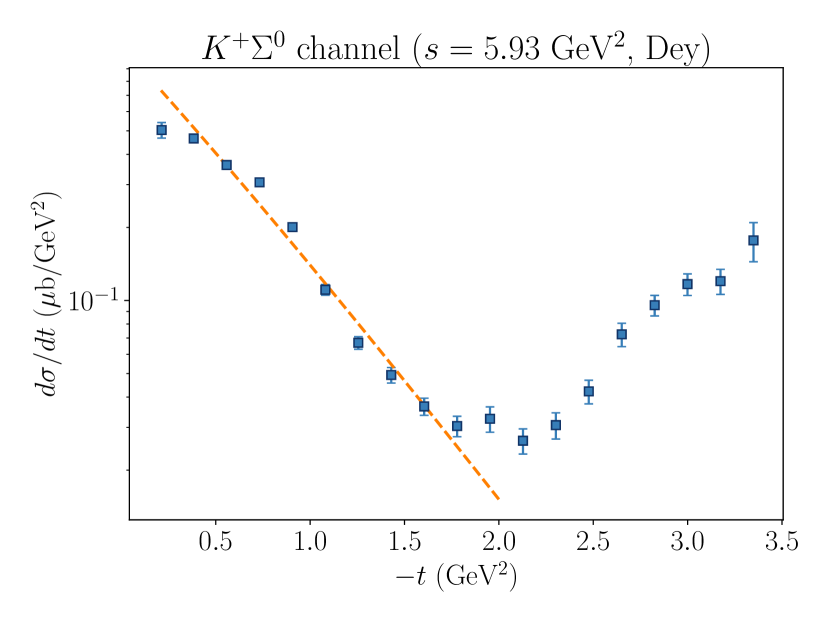
However, at smaller , there is not such a visibly clear delineation between the region where Eq. (1) works and where it fails. For instance, in Fig. 3, one sees that the differential cross section for photoproduction of the and channels at GeV2 is not quite a straight line on a log-scaled plot, but is slightly convex-down. This means that the extracted value of will vary with the region of that is fit. This dependence of on the fitted region has been observed before, especially for photoproduction of (see e.g., Bauer et al. (1978); Behrend et al. (1978); Seraydaryan et al. (2014); Dey et al. (2014)). Accordingly, it is necessary to develop a quantitative scheme for determining the fit region that is to be used, and for determining the systematic uncertainty in originating from this decision. Moreover, this scheme should help us determine the minimum value of to which Eq. (1) can be fruitfully applied.
Before proceeding, it is necessary to additionally exclude data with sufficiently small from the fit since, as can be seen in both Figs. 2 and 3, the logarithmic slope of the differential cross section flattens out and even falls when is close to zero. To this end, we have fit the function to low- data, looking for the critical point corresponding to the maximum cross section. Since the fit function of Eq. (1) is strictly monotonically decreasing, we use the critical point for each bin as the for this bin. On average, is about GeV2.
To exclude large data from the fit, we define a quantity
| (4) |
and study the dependence of the extracted on the value of . For example, in Fig. 3, the differential cross section of the and channels were fit to the Eq. (1) within the region , using multiple values of . The fits in this figure were performed by minimizing . The extracted values for the channel seem to be robust against variation of , but this is due predominantly to the relatively larger uncertainties in the high data than in the low data, a difference which causes the low data to overwhelmingly dominate the least- fit. Nonetheless, it is clear that the higher data ( GeV2) in Fig. 3 do not follow the linear trend that the fit suggests, and high in this sense produces a bad fit.
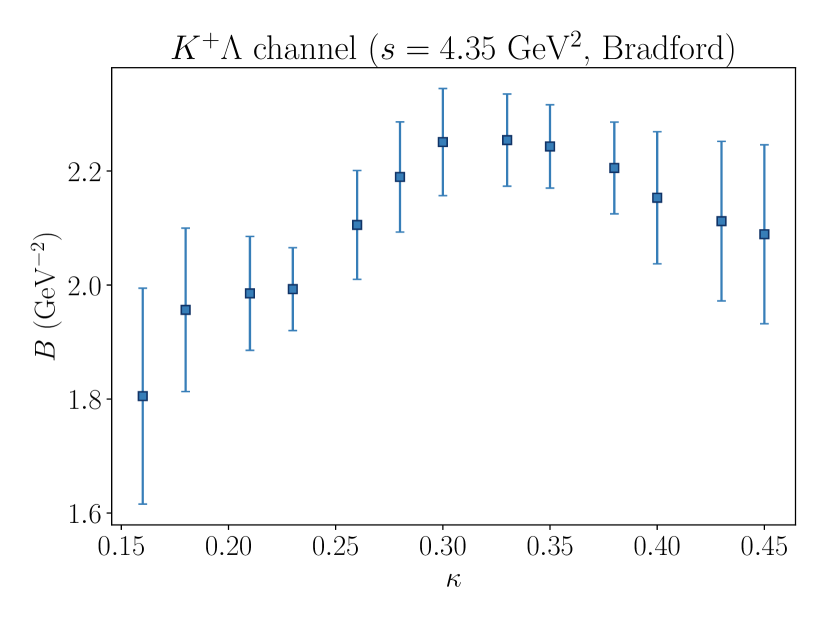
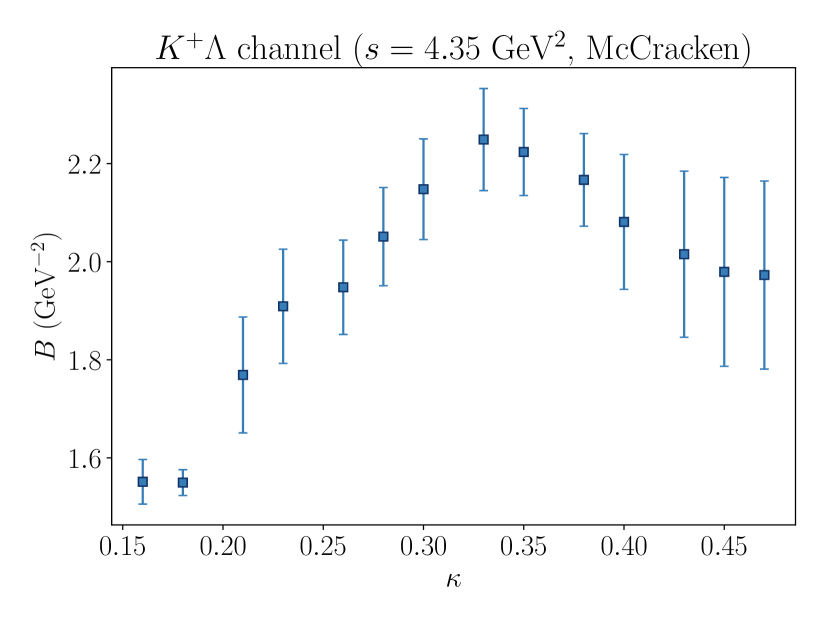
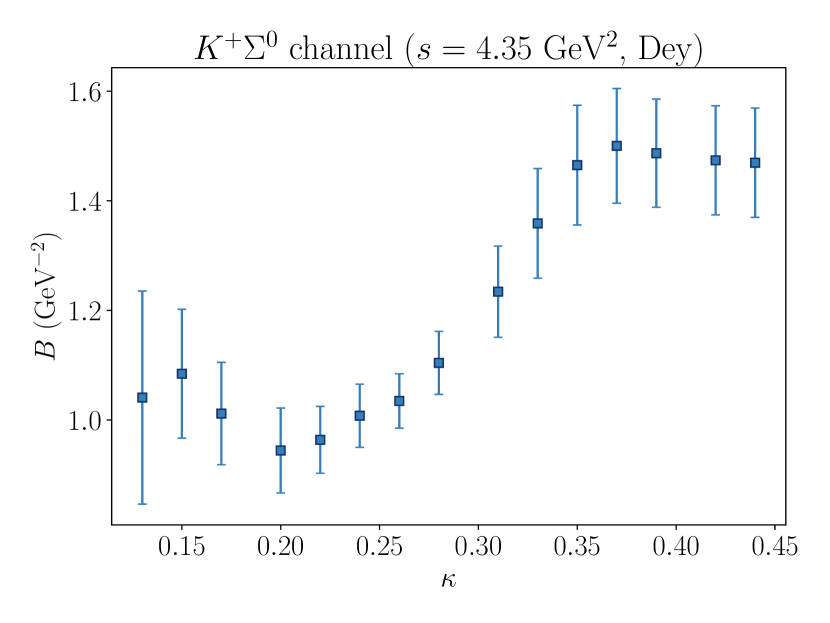
One trend we can see in Fig. 3 is that the differential cross section begins falling more steeply as increases from through around GeV2 or so, and at sufficiently high the fall-off stops and the differential cross section begins rising again. Accordingly, we expect that the extracted , taken as a function of , should rise with to some maximum value before falling. In light of this expectation, we have plotted the dependence of on for both the and channels in Fig. 4. The expectation is indeed met.
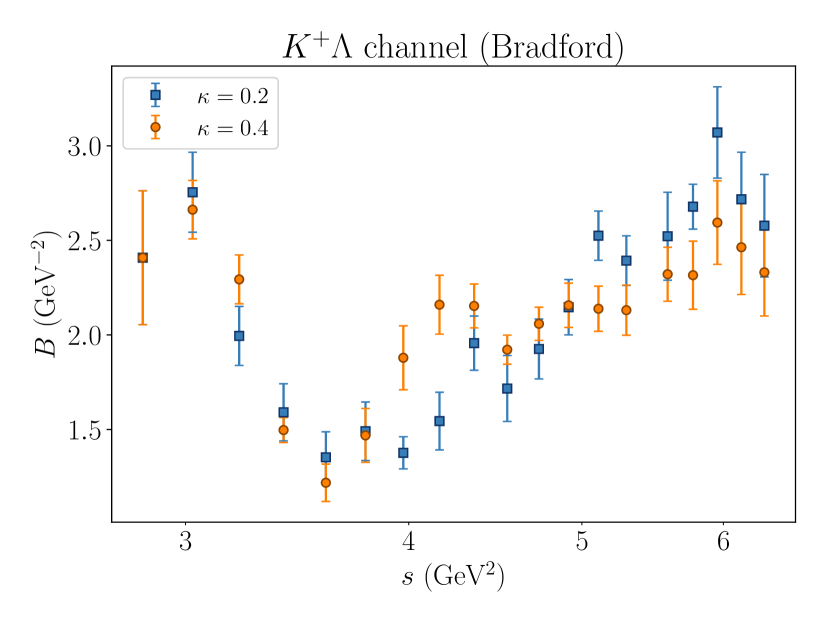
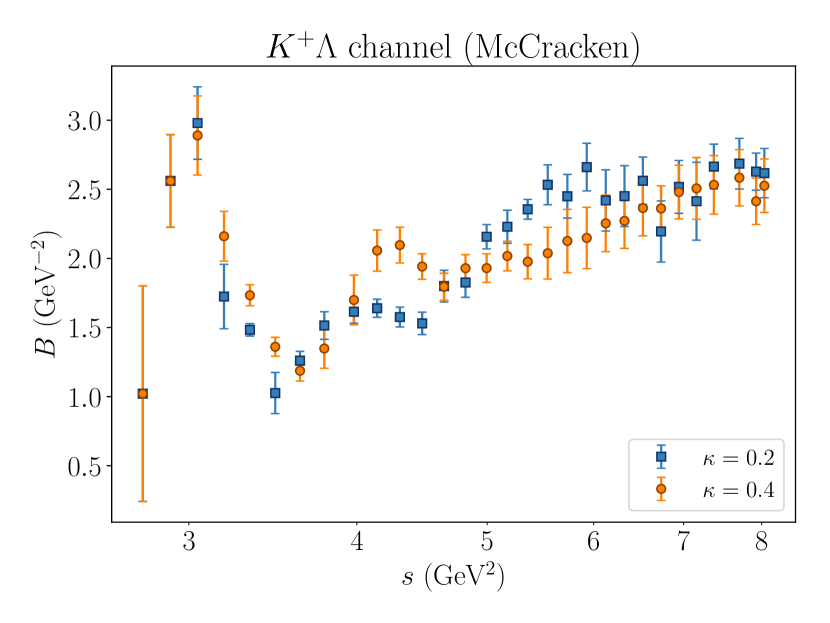
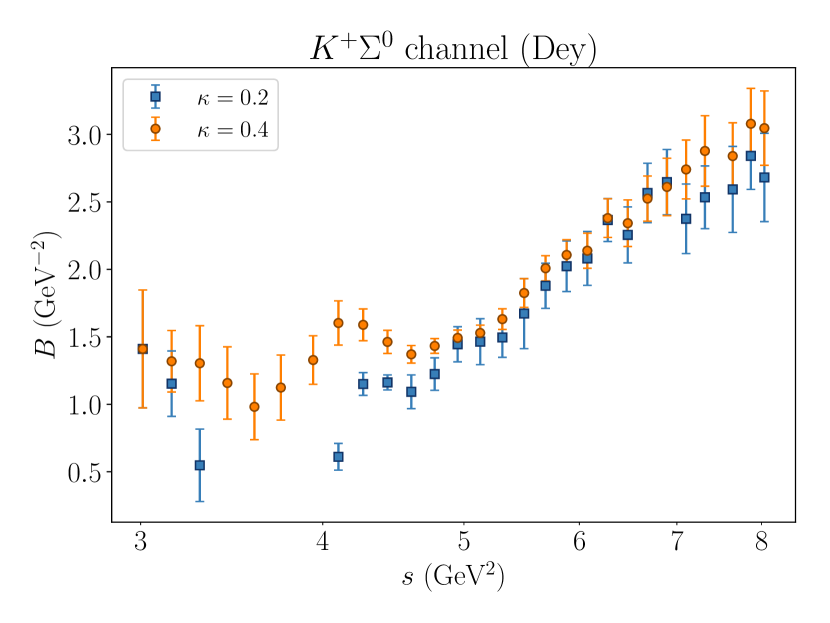
Next, we look at the dependence of . Since the choice of will affect the extracted value, we study the dependence at two different values of , specifically and . We plot several of the extracted values against in Fig. 5. Since the CLAS data is very finely binned, we have plotted every fourth data point so that the plots are readable. For the extractions from the more recent CLAS publications from McCracken et al. McCracken et al. (2010) and Dey et al. Dey et al. (2010), in Fig. 5, the extracted values for the two different values fall within each other’s error bars at GeV2.
It has previously been observed (e.g. in Guidal et al. (1997)) that Regge theory’s expected domain of validity is GeV2, and the relative robustness of the extractions from the McCracken and Dey values in this domain is compatible with this previous knowledge. However, there is less consistency between the values for the Bradford et al. data Bradford et al. (2006), thus prompting the question of which value is most appropriate.
We next investigate how to determine the best value of to use, and to estimate the systematic uncertainty in resulting from that choice. To proceed, we make use of the fact that (as in Fig. 4) as a function of reaches a maximum value, corresponding to a range of in which the cross section most behaves like a steeply-falling exponential. The which maximizes is chosen as a “central” value, and is denoted . Two lower and higher values of are chosen which produce different -slopes (denoted , , , and ), and the standard deviation of the -slopes produced by these values is taken as the systematic “ choice” uncertainty. Namely, we define
| (5) |
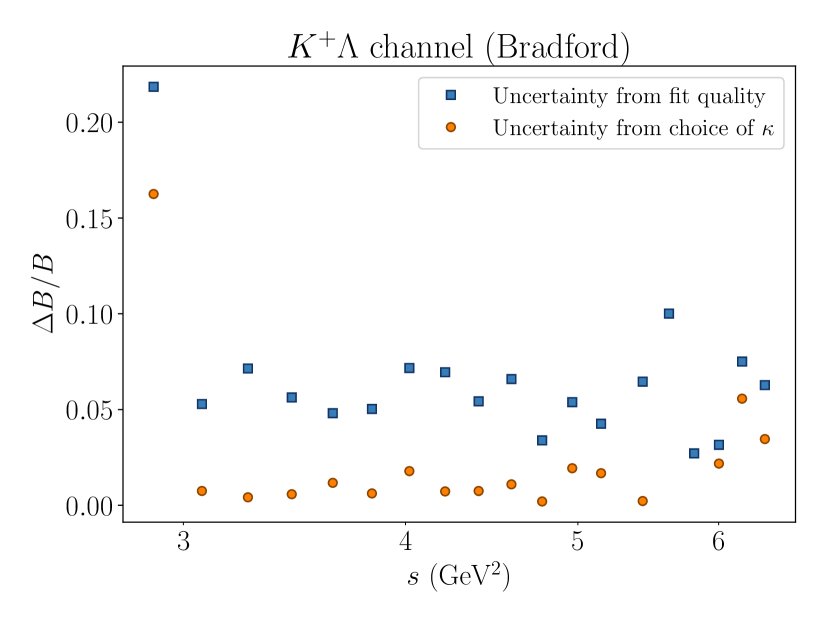
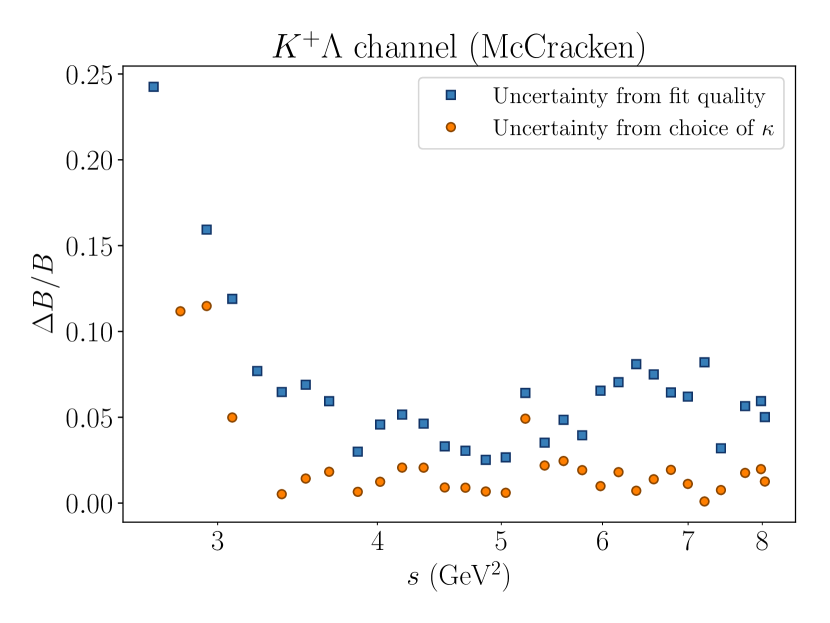
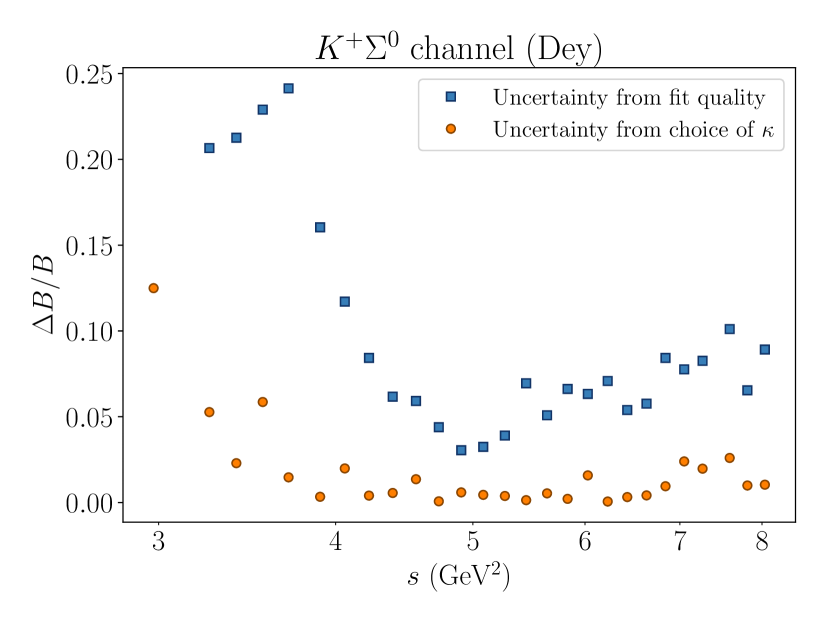
In Fig. 6, we have plotted the relative uncertainty in the -slope due to both the quality of the fits, and the systematic uncertainty due to the choice of . It is worth noting that the choice uncertainty (for the central value we have chosen) is significantly smaller than the uncertainty due to quality of the fits.
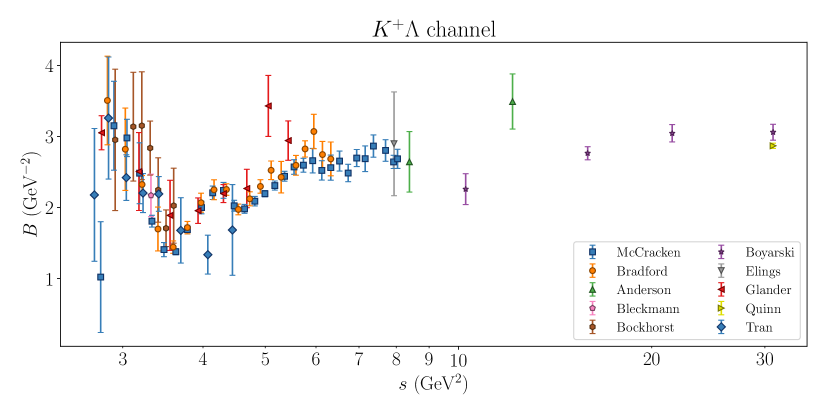
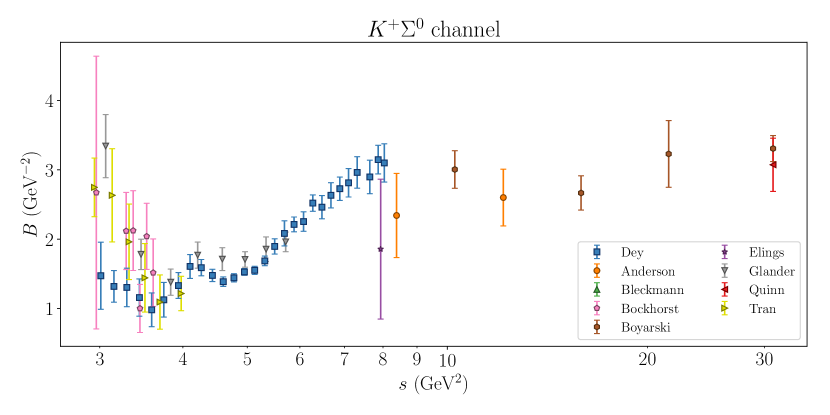
In Fig. 7, we use the “maximum ” scheme for determining the slope factor, and have plotted the extracted slope factors against . We have included the world data for small-angle photoproduction of both and from a proton target in this figure. For the finely-binned CLAS data Bradford et al. (2006); McCracken et al. (2010); Dey et al. (2010), we have plotted every fourth data point in order to keep the plot readable. In these plots, the newer CLAS data from McCracken McCracken et al. (2010) and Dey Dey et al. (2010) seem to fall roughly along straight lines in the region GeV2 when the -axis is log-scaled. This is in accordance with the prescription of Eq. (3).
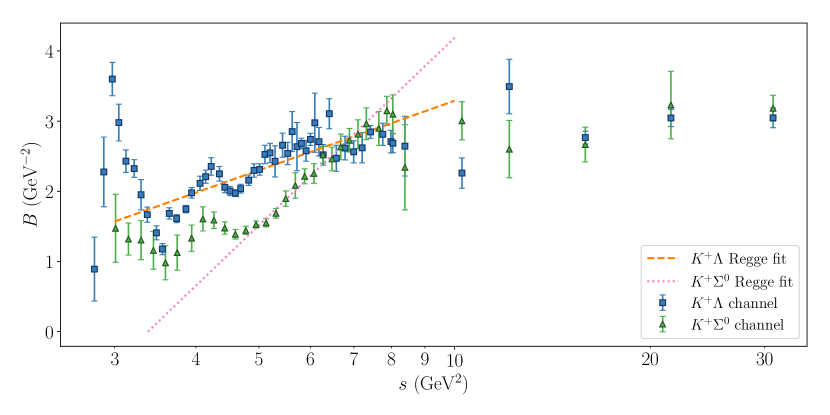
Since Fig. 7 seems to vindicate Eq. (3), we proceed to extract the parameters and by fitting Eq. (3) to the recent CLAS data from McCracken et al. McCracken et al. (2010) and Dey et al. Dey et al. (2010). We perform this fit in the region GeV GeV2 for both the and channels. This produces extracted Regge slopes of
| (6) | |||||
| (7) |
and extracted values of
| (8) | |||||
| (9) |
Neither of the extracted trajectories in this two-parameter fit is compatible with one-Reggeon exchange, although the channel comes close. In fact, it is possible to peform a one-paraeter fit the data with the constraint GeV2 with little increase in of the fit, which would give us
| (10) |
This is compatible with pure Reggeon exchange, since GeV-2. On the other hand, the trajectory for the channel far exceeds the trajectories of both the and the , and it is not possible to contrain GeV2 for the channel without increasing by an order of magnitude, suggesting that the final state is not produced by exchange of a single Reggeon.
Regarding the extracted values, we remind the reader that the parameter is not truly a constant, but a function of , which can approximately be written as Collins (2009)
| (11) |
where or , depending on the channel. Eq. (11) gives GeV2 when is small, and this is the conventional value of used in Regge phenomenology Collins (2009); Guidal et al. (1997). The value GeV2 that we obtained is roughly compatible with this, but GeV2 is far in excess of the values will take in the range of interest. We interpret this to vindicate both that the channel is produced mostly by Reggeon exchange, and that the channel cannot be explained by single Reggeon exchange. Compatibility with Eq. (3) is indicated, after all, not just by a logarithmic dependence of on , but by the parameters in the equation representing true physical values.
It is further worth noting that the linear trend followed by the CLAS data in Figs. 7 and 8 stops at around GeV2. At higher , the existing world data is sparse but, when taken together with the lower- CLAS data, is suggestive of a flattening out of . However, a finer structure that cannot be discerned with the current world data is also possible. In either case, the functional form suggested by Eq. (3) appears to be violated at larger . It would be prudent to extend the experimental investigation of meson photoproduction to higher energies in order to obtain more high-precision data in the GeV2 region. This will be possible at Jefferson Lab with the recent 12 GeV upgrade.
IV Double-exponential Fit
It was observed in the previous section that the “trajectory” of the channel exceeded the expected trajectories for both and Reggeon exchange, and we hypothesized that this was due to exchange of multiple Reggeons. In this section, we offer a preliminary investigation into this possibility by fitting the cross section to the interfering sum of two trajectories. In particular, we fit the cross section to
| (12) |
Since we are assuming purely diffractive -channel exchanges, both and should be predominantly imaginary. Typically, one would introduce a small real part using , but we will here neglect the real part, taking . Since Eq. (12) can only be used to fit and up to a common phase, we will normalize the phase so that is positive.
We use Eq. (12) to fit only and . The slope factors and used in the fit are determined using Eq. (3), in which we use the “conventional” value of GeV2 . We apply the fit to the range , where are the values determined previously through the “maximum ” scheme. With these constraints in place, the magnitudes and relative sign of and remain to be fit.
Examples of double-exponential fits are given in Fig. 9. The fits are of variable quality, with improved description of the data at higher . We expect the fits to be imperfect because of several approximations that have been made, including (1) that all of the -dependence of the differential cross section comes from the Regge trajectory , and (2) that the reaction proceeds entirely through -channel exchange. A more complete description including other sources of dependence (such as the -dependence of ) as well as resonance contributions to the cross section, such as found in Guidal et al. (1997); Corthals et al. (2006, 2007), would likely describe the data better. However, the fits in Fig. 9 are improvements upon the simple exponential fits that can be seen in Fig. 3.
The purpose of this double-exponential fit is to test the hypotheses that, in the region GeV2, (1) the channel occurs almost entirely due to Reggeon exchange, and (2) the channel occurs due to a mixture of and Reggeon exchange. Accordingly, we have applied this fit to the recent CLAS data in the region GeV2, and to world data at higher to check whether the Reggeon exchange contributions do change around GeV2.
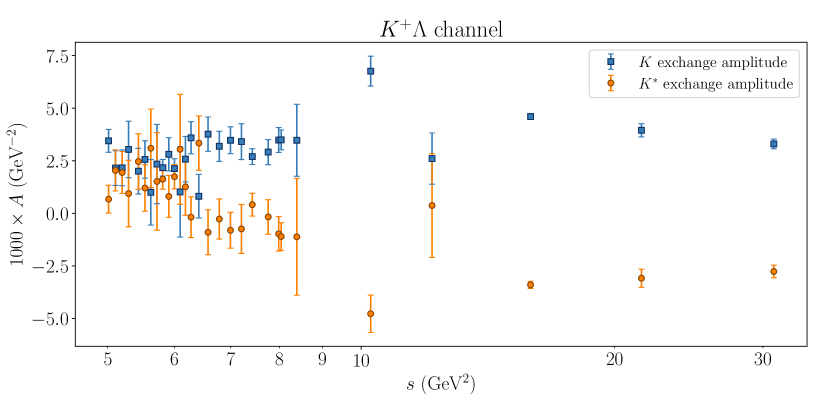
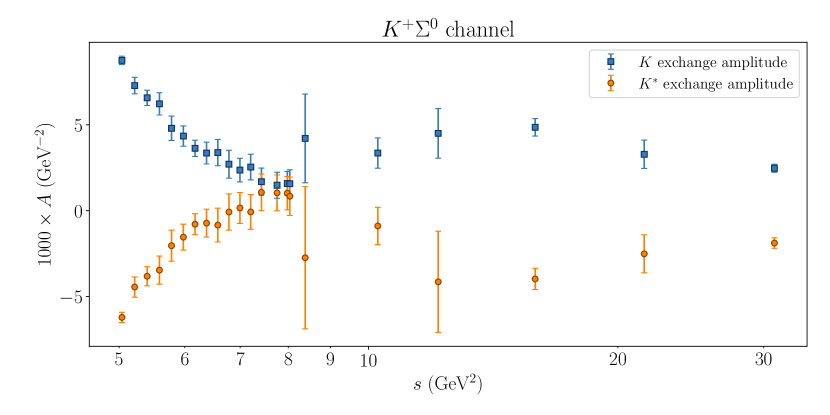
In Fig. 10, we can see the results of the double-exponential fit plotted against . In accordance with our previous hypothesis, production appears to occur predominantly through Reggeon exchange, in the GeV2 region, while production requires a mix of and Reggeon exchange at all . Moreover, we have found that the and Reggeon exchange contributions are opposite in phase. Additionally, at GeV2, the exchange behavior of both channels does appear to change, with exchange suddenly becoming significant in production.
One of the peculiarities in the bottom panel of Fig. 10 is the apparent convergence of the amplitudes for the channel GeV2. We cannot say whether this is a robust conclusion of our analysis. The simple form of Eq. (12), or perhaps the other approximations used in this work, may be inadequate for describing the channel. This channel did, after all, also evade description by the simple Reggeon exchange model previously where the proved amenable to such a description.
It is worth emphasizing that the double-exponential fit performed here is somewhat crude, and should not be taken as more than a preliminary investigation. A theoretical analysis of the data from Boyarski et al. (1971) was previously done in Guidal et al. (1997), and the conclusions reached for these data were that and Reggeons contributed about equally (with opposite phases) to the channel, and that the Reggeon contribution to production overwhelmed the contribution. Our double-exponential fit is compatible with the previous observation that and exchange both contribute significantly to production at large , but we do not observe the exchange amplitude overwhelming the exchange amplitude for production. The conclusions of Guidal et al. (1997) regarding the channel are likely more robust than ours, but we take the consilience between Guidal et al. (1997) and this work for the channel to lend credence to our analysis of this channel.
V Conclusions and Outlook
We have fit recent high-precision CLAS data for meson photoproduction to the the exponential fit form , extracting the -slope factor as a function of for the and channels. In performing the extraction, we developed a scheme for determining the range of to which the fit should be applied, and for estimating the systematic uncertainty due to our choice.
We found that photoproduction is compatible with exchange of a Reggeon being the dominant contribution in the region GeV2. On the other hand, production could not be attributed to single-Reggeon exchange. We then performed a fit to interfering exponential amplitudes (using Eq. (12)), the results of which vindicate our conclusions from the single exponential fit.
At GeV2, which coincides with the limit of recent high-precision CLAS data, the behavior of the -slope appears to change dramatically. However, the world data at GeV2 is sparse and imprecise. A better understanding whether and how the production mechanisms for meson photoproduction change at GeV2 will require obtaining more high-precision data at and above this energy. This will be possible at Jefferson Lab with the 12 GeV upgrade.
The analysis done in this work is somewhat crude and strictly phenomenological. A more complete analysis would account for dependence in the differential cross section other than what is contained in the functional form , including -dependence of the parameter used in the theoretical expression (3) for . Additionally, a more complete analysis would account for -channel (resonance) contributions.
Nonetheless, our results hint at the production mechanisms that may contribute to meson photoproduction at intermediate energies. Additionally, phenomenological -slopes such as those we have extracted may be potentially useful in a Monte Carlo generator for -channel production of hyperon channels. For this reason, we have included a spreadsheet containing the extracted -slopes as supplemental material.
Acknowledgments
This work was supported by DOE award DE-SC0013620. R.B. was supported, in part, by the FIU Graduate School through a Dissertation Year Fellowship. A.F. was supported during the revision by ANL LDRD Project No. 2017-058-N0. We would like to thank Jan Ryckebusch for interesting discussions that helped contribute to this research, and Seamus Riordan for reading the manuscript.
References
- Bradford et al. (2006) R. Bradford et al. (CLAS), Phys. Rev. C73, 035202 (2006), arXiv:nucl-ex/0509033 [nucl-ex] .
- McCracken et al. (2010) M. E. McCracken et al. (CLAS), Phys. Rev. C81, 025201 (2010), arXiv:0912.4274 [nucl-ex] .
- Dey et al. (2010) B. Dey et al. (CLAS), Phys. Rev. C82, 025202 (2010), arXiv:1006.0374 [nucl-ex] .
- Schumacher and Sargsian (2011) R. A. Schumacher and M. M. Sargsian, Phys. Rev. C83, 025207 (2011), arXiv:1012.2126 [hep-ph] .
- Anisovich et al. (2007) A. V. Anisovich, V. Kleber, E. Klempt, V. A. Nikonov, A. V. Sarantsev, and U. Thoma, Eur. Phys. J. A34, 243 (2007), arXiv:0707.3596 [hep-ph] .
- Nikonov et al. (2008) V. A. Nikonov, A. V. Anisovich, E. Klempt, A. V. Sarantsev, and U. Thoma, Phys. Lett. B662, 245 (2008), arXiv:0707.3600 [hep-ph] .
- Anisovich et al. (2011a) A. V. Anisovich, E. Klempt, V. A. Nikonov, A. V. Sarantsev, and U. Thoma, Eur. Phys. J. A47, 27 (2011a), arXiv:1009.4803 [hep-ph] .
- Anisovich et al. (2011b) A. V. Anisovich, E. Klempt, V. A. Nikonov, A. V. Sarantsev, and U. Thoma, Eur. Phys. J. A47, 153 (2011b), arXiv:1109.0970 [hep-ph] .
- Anisovich et al. (2012) A. V. Anisovich, E. Klempt, V. A. Nikonov, A. V. Sarantsev, and U. Thoma, Phys. Lett. B711, 167 (2012), arXiv:1111.6150 [hep-ex] .
- Anisovich et al. (2014) A. V. Anisovich, R. Beck, V. Burkert, E. Klempt, M. E. McCracken, V. A. Nikonov, A. V. Sarantsev, R. A. Schumacher, and U. Thoma, Eur. Phys. J. A50, 129 (2014), arXiv:1404.4587 [nucl-ex] .
- Bauer et al. (1978) T. H. Bauer, R. D. Spital, D. R. Yennie, and F. M. Pipkin, Rev. Mod. Phys. 50, 261 (1978).
- Collins (2009) P. D. B. Collins, An Introduction to Regge Theory and High-Energy Physics, Cambridge Monographs on Mathematical Physics (Cambridge Univ. Press, Cambridge, UK, 2009).
- Guidal et al. (1997) M. Guidal, J. M. Laget, and M. Vanderhaeghen, Nucl. Phys. A627, 645 (1997).
- Boyarski et al. (1971) A. Boyarski, R. E. Diebold, S. D. Ecklund, G. E. Fischer, Y. Murata, B. Richter, and M. Sands, Phys. Lett. B34, 547 (1971).
- Behrend et al. (1978) H. J. Behrend, J. Bodenkamp, W. P. Hesse, W. A. McNeely, Jr., T. Miyachi, D. C. Fries, P. Heine, H. Hirschmann, A. Markou, and E. Seitz, Nucl. Phys. B144, 22 (1978).
- Seraydaryan et al. (2014) H. Seraydaryan et al. (CLAS), Phys. Rev. C89, 055206 (2014), arXiv:1308.1363 [hep-ex] .
- Dey et al. (2014) B. Dey, C. A. Meyer, M. Bellis, and M. Williams (CLAS), Phys. Rev. C89, 055208 (2014), [Addendum: Phys. Rev.C90,no.1,019901(2014)], arXiv:1403.2110 [nucl-ex] .
- Elings et al. (1967) V. B. Elings, K. J. Cohen, D. A. Garelick, S. Homma, R. A. Lewis, W. Lobar, D. Luckey, and L. S. Osborne, Phys. Rev. 156, 1433 (1967).
- Bleckmann et al. (1970) A. Bleckmann, S. Herda, U. Opara, W. Schulz, W. J. Schwille, and H. Urbahn, Z. Phys. 239, 1 (1970).
- Anderson et al. (1976) R. L. Anderson, D. Gustavson, D. Ritson, G. A. Weitsch, H. J. Halpern, R. Prepost, D. H. Tompkins, and D. E. Wiser, Phys. Rev. D14, 679 (1976).
- Quinn et al. (1979) D. J. Quinn, J. P. Rutherfoord, M. A. Shupe, D. Sherden, R. Siemann, and C. K. Sinclair, Phys. Rev. D20, 1553 (1979).
- Bockhorst et al. (1994) M. Bockhorst et al., Z. Phys. C63, 37 (1994).
- Tran et al. (1998) M. Q. Tran et al. (SAPHIR), Phys. Lett. B445, 20 (1998).
- Glander et al. (2004) K. H. Glander et al., Eur. Phys. J. A19, 251 (2004), arXiv:nucl-ex/0308025 [nucl-ex] .
- Corthals et al. (2006) T. Corthals, J. Ryckebusch, and T. Van Cauteren, Phys. Rev. C73, 045207 (2006), arXiv:nucl-th/0510056 [nucl-th] .
- Corthals et al. (2007) T. Corthals, D. G. Ireland, T. Van Cauteren, and J. Ryckebusch, Phys. Rev. C75, 045204 (2007), arXiv:nucl-th/0612085 [nucl-th] .