Modelling high-resolution spatially-resolved Supernova Remnant spectra with the Sardinia Radio Telescope
Sara Loru 1,2,
Alberto Pellizzoni 1,
Elise Egron 1,
Noemi Iacolina 1,
Simona Righini 3,
Marco Marongiu 1,
Sara Mulas 2,
Giulia Murtas 2,
Davide Simeone 2,
Maura Pilia 1,
Matteo Bachetti 1,
Alessio Trois 1,
Roberto Ricci 3,
Andrea Melis 1
and Raimondo Concu 1
1 INAF-Osservatorio Astronomico di Cagliari, Via della Scienza 5, 09047 Selargius, Italy
2 Dipartimento di Fisica, Università di Cagliari, SP Monserrato-Sestu, KM 0.7, 09042 Monserrato, Italy
3 INAF-Istituto di Radioastronomia,Via Gobetti 101, 40129 Bologna, Italy
Abstract
Supernova Remnants (SNRs) exhibit spectra featured by synchrotron radio emission arising from the relativistic electrons, and high-energy emission from both leptonic (Bremsstrahlung and Inverse Compton) and hadronic processes ( mesons decay) which are a direct signature of cosmic rays acceleration. Thanks to radio single-dish imaging observations obtained in three frequency bands (, , GHz) with the Sardinia Radio Telescope (www.srt.inaf.it), we can model different SNR regions separately. Indeed, in order to disentangle interesting and peculiar hadron contributions in the high-energy spectra (gamma-ray band) and better constrain SNRs as cosmic rays emitters, it is crucial to fully constrain lepton contributions first through radio-observed parameters. In particular, the Bremsstrahlung and Inverse Compton bumps observed in gamma-rays are bounded to synchrotron spectral slope and cut-off in the radio domain. Since these parameters vary for different SNR regions and electron populations, spatially-resolved radio spectra are then required for accurate multi-wavelength modelling.
1 Introduction
The long quest for the firm disentanglement among leptonic and hadronic scenarios represents one of the most important challenges for the high-energy study of SNRs, being directly related to cosmic rays origin and acceleration models. Accurate radio images of SNRs are typically available at low frequencies (Castelletti G. et al. and ; Gao et al. ). On the other hand, multi-wavelength data on SNRs are sparse and spatially-resolved spectra are rarely available in the 5-20 GHz range, critical for model assessment, also for the most studied and bright objects (see Green D.A. ). Deep multi-frequency imaging of the complex SNRs IC443 and W44 with the Sardinia Radio Telescope (SRT) can disentangle different populations and spectra of radio/gamma-ray-emitting electrons in these SNRs, in order to better address models and then firmly constrain high-energy emission arising from hadrons. On the other hand, accurate radio spectral imaging allows us to distinguish between shock parameters and different physical processes taking place within SNRs. Recent constraints on cosmic rays emission from SNRs and related models (Giuliani et al. ; Ackermann et al. ; Cardillo et al. ) are based on integrated radio fluxes only (no spatially resolved spectra) implying the simplistic ”single-zone” assumption of a single electron population for the whole SNR. In the aim of studying the local properties of W44 and IC443, we performed with SRT accurate on-the-fly scans of these SNRs at three frequencies (L, C, K bands) in order to obtain detailed radio images and spatial-resolved spectral-slope measurements (synchrotron breaks are possibly expected in this range). Indeed, spectral index maps provide evidence of a wide physical parameters scatter among different SNR regions.
2 SRT multi-frequency maps of W44 and IC443
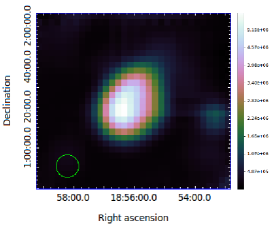
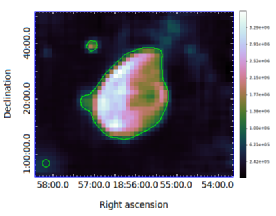
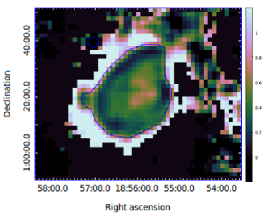
In the framework of the Astronomical Validation and Early Science Program with the 64m single-dish Sardinia Radio Telescope, we provided for the first time single-dish deep imaging at 7 GHz for IC443 and W44 complexes coupled with spatially-resolved spectra in the range 1.6-7 GHz (Egron et al. these proceedings). In Fig.1 we show the maps of the SNR W44 obtained with SRT at 1.6 GHz and 7 GHz. In order to study the spectral index distribution of these sources, we used the spectral index maps obtained by coupling L and C-band images, binning data at low-resolution (1.5’ pixel size) and considering only pixels with high source signal in both bands. In Fig.2 we present the spectral index map of SNR W44 together with the map at 7 GHz for comparison. A flat spectrum is observed from the brightest SNR regions at the limbs, while steeper spectral indices (up to 0.8) are observed in fainter central regions and halos, disentangling different populations and spectra of radio/gamma-ray-emitting electrons in these SNRs. The possible origin of the observed spectral index scatter is under assessment: it could be due to either non-uniform absorption processes, region-dependent cooling rates or intrinsic shock parameters differences. In perspective, we will also produce K-band (22 GHz) maps not available so far in literature for IC443 and W44, allowing us to study detailed the morphology of these sources at high radio-frequencies. Furthermore, coupling K-band maps with L-band and C-band maps, we will search for possible spectral steepening or breaks in selected SNR regions, assessing the high-energy tail of the region-dependent electron distribution.
References
Ackermann et al., , Science, , ;
Castelletti G. et al., , A&A, , A;
Castelletti G. et al., , A&A, , A;
Cardillo et al., A&A,, ;
Gao X.Y., Han J.L., Reich W. et al. , A&A, , A;
Giuliani et al., , ApJ, , L;
Green D.A. , A Catalogue of Galactic Supernova Remnants (http://www.mrao.cam.ac.uk/surveys/snrs/)