![[Uncaptioned image]](/html/1609.03825/assets/figures/figure1.png)
Measurement of the photon and jet production with the ATLAS detector
Abstract
Production of prompt isolated photons at hadron colliders provides a probe of perturbative QCD and can be used to study the gluon density function of the proton. The ATLAS collaboration has performed precise measurements of the inclusive production of isolated prompt photons in 20.2 fb-1 of data collected at TeV and in 6.4 pb-1 of data collected at TeV. The measurements are compared with state-of-the-art theory predictions at NLO in QCD and with predictions of several MC generators.
Production of inclusive jets at hadron colliders also provides a probe of perturbative QCD. The inclusive jet production cross-section was measured in 78 pb-1 of data collected at TeV. Results have been compared with (state-of-the-art) theory predictions at NLO in QCD, interfaced with different parton distribution functions.
1 Introduction
Measurements of prompt photon production and of jet production provide a tool for testing perturbative Quantum Chromodynamics (pQCD). These measurements can be used also to study parton distribution functions (PDF). For example, Compton scattering of quarks and gluons () can be used to study parton distribution function of the gluon. Improved understanding of these processes can lead to the improvement in other measurements. For example, photon production is a background for Higgs production in the diphoton channel. Jet production is a background for many SUSY/Exotics processes. Finally, precise jet cross-section measurements allow the extraction of information about the strong coupling constant and probes QCD at scales sensitive to new physics.
2 The ATLAS detector
The ATLAS detector [1] at LHC [2] is a multi-purpose particle physics detector with a forward-backward symmetric cylindrical geometry and nearly 4 coverage in solid angle. It consists of an inner tracking detector surrounded by a thin superconducting solenoid providing a 2 T axial magnetic field, electromagnetic and hadronic calorimeters, and a muon spectrometer. The inner tracking detector covers the pseudorapidity range 2.5.
3 Photon reconstruction, identification, isolation
Photons are reconstructed from energy deposits in the electromagnetic calorimeter with transverse energy 2.5 GeV in towers of cells in .
Reconstructed photons are selected for analyses using identification and isolation criteria. Photon identification is used to reject hadronic background by applying requirements on the energy leaking into the hadronic calorimeter and on the shower-shape variables. The ”tight” selection is optimised to reduce the contribution from jets with one or more hard decaying to photons and carrying most of the jet energy. Photon isolation is based on isolation energy (). A photon is considered isolated if its is less than some isolation cut value. The is based on the energy measured in topological clusters within a cone of radius R=0.4 with the core of the cone removed. In the photon measurements presented here, the cut is 4.8 GeV + 4.2.
Prompt photons, which represent the signal in the analysis, can belong to two different groups - direct photons and fragmentation photons. Direct photons originate from the hard processes. Fragmentation photons are emitted in the fragmentation of a high transverse momentum parton.
4 Photon cross-section measurement at =8 TeV
The measurement of isolated prompt photon cross-section at =8 TeV [3] is based on 20.2 fb-1 of data collected in 2012.
Events are selected according the following criteria: each event is required to have a reconstructed vertex consistent with the average beam-spot position, where the vertex is required to have at least two associated tracks. Photons are required to have , and GeV. They are triggered using single photon triggers with thresholds 20, 40, 60, 80, 100, and 120 GeV. Data taken by these triggers are multiplied by appropriate prescales and combined together. Tight isolated photons are considered as signal here.
The background is subtracted using the so-called 2D sideband method. The purpose of this method is to remove the residual background from meson decays and jets. It is based on isolation and identification criteria. In this method, photons are divided into four regions (A: tight and isolated; B: tight and non-isolated, C: non-tight and isolated; D: non-tight and non-isolated). Regions B, C and D contain both signal and background events, region A contains only signal ones. Based on the numbers of photons in each category, the number of signal photons in data can be estimated.
Data are compared to Monte Carlo simulations. Pythia 8.165 [4] (using CTEQ6L1 PDF), Sherpa 1.4.0 [5] (using CT10 PDF), JetPhox [6] and PeTer [7] (both using CT10 PDF) are used. JetPhox is a parton-level generator for predictions of processes with photons in the final state. It achieves next-to-leading-order (NLO) accuracy for both direct and fragmentation photon processes. PeTer is a parton-level NLO generator which contains resummation of threshold logarithms in addition.
Systematic uncertainties are dominated by the energy scale uncertainty at the high- region, by the uncertainty of a 2D sideband method and uncertainties of the content of direct and fragmentation photons in the low- region. The luminosity uncertainty is 1.9%. The statistical uncertainty is between 1 % and 2 % (except for high- bins).

The cross-section of prompt photon production is shown in Figure 1 for data and the NLO Monte Carlo JetPhox. The Monte Carlo describes the shape of the data well over ten orders of magnitude. The agreement is similar for all tested PDF sets (CT10, MSTW2008, NNPDF2.3, and HeraPDF1.5).
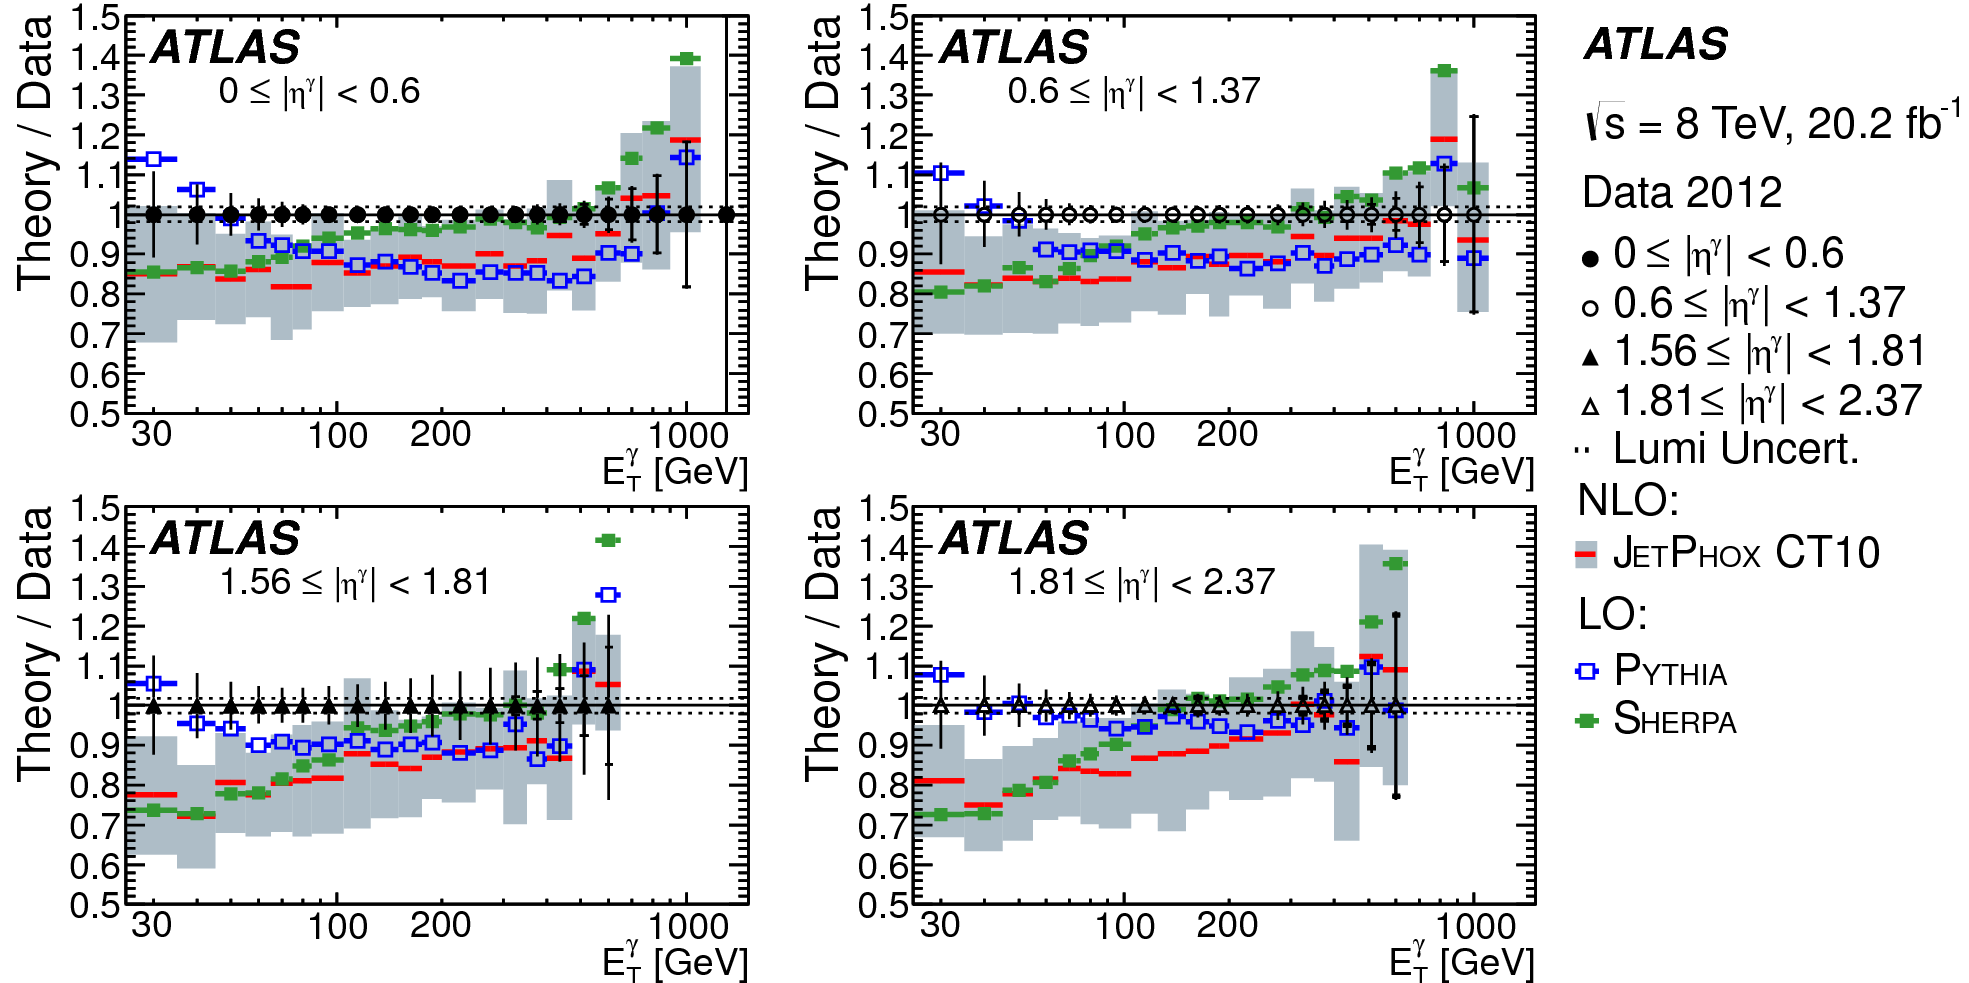
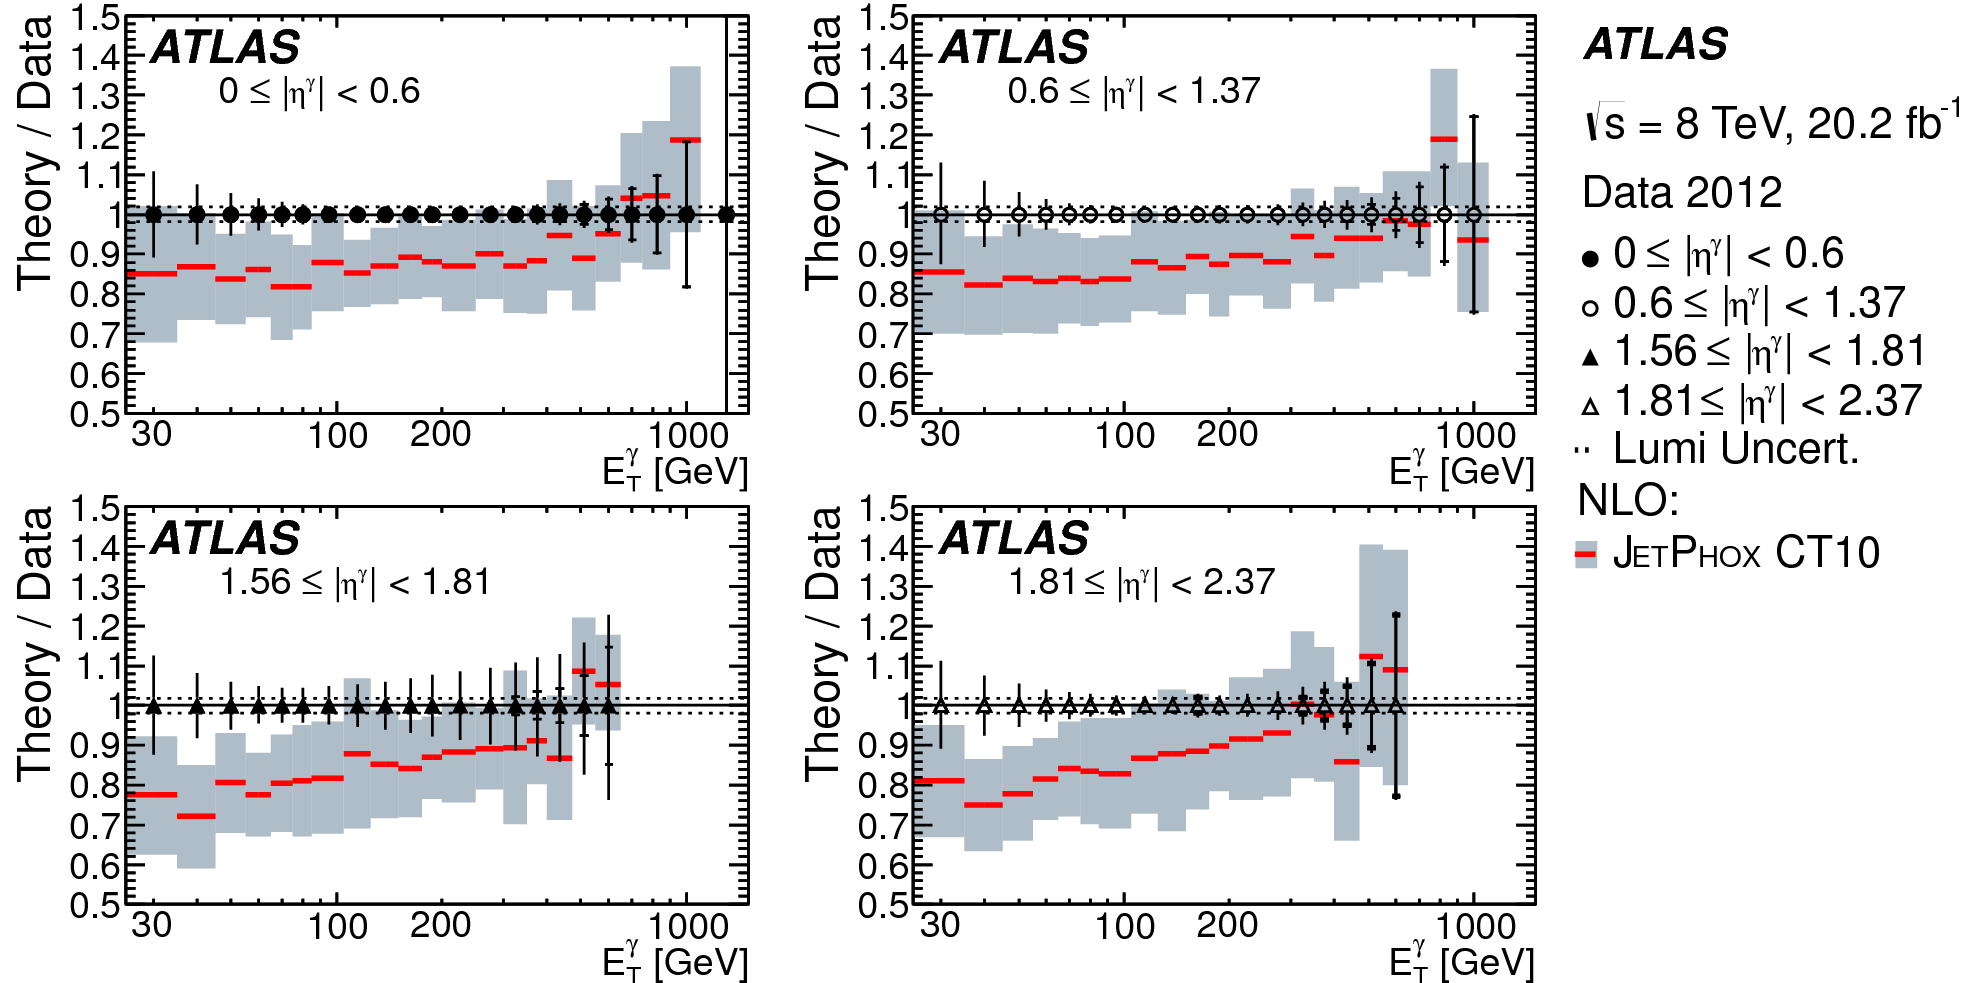
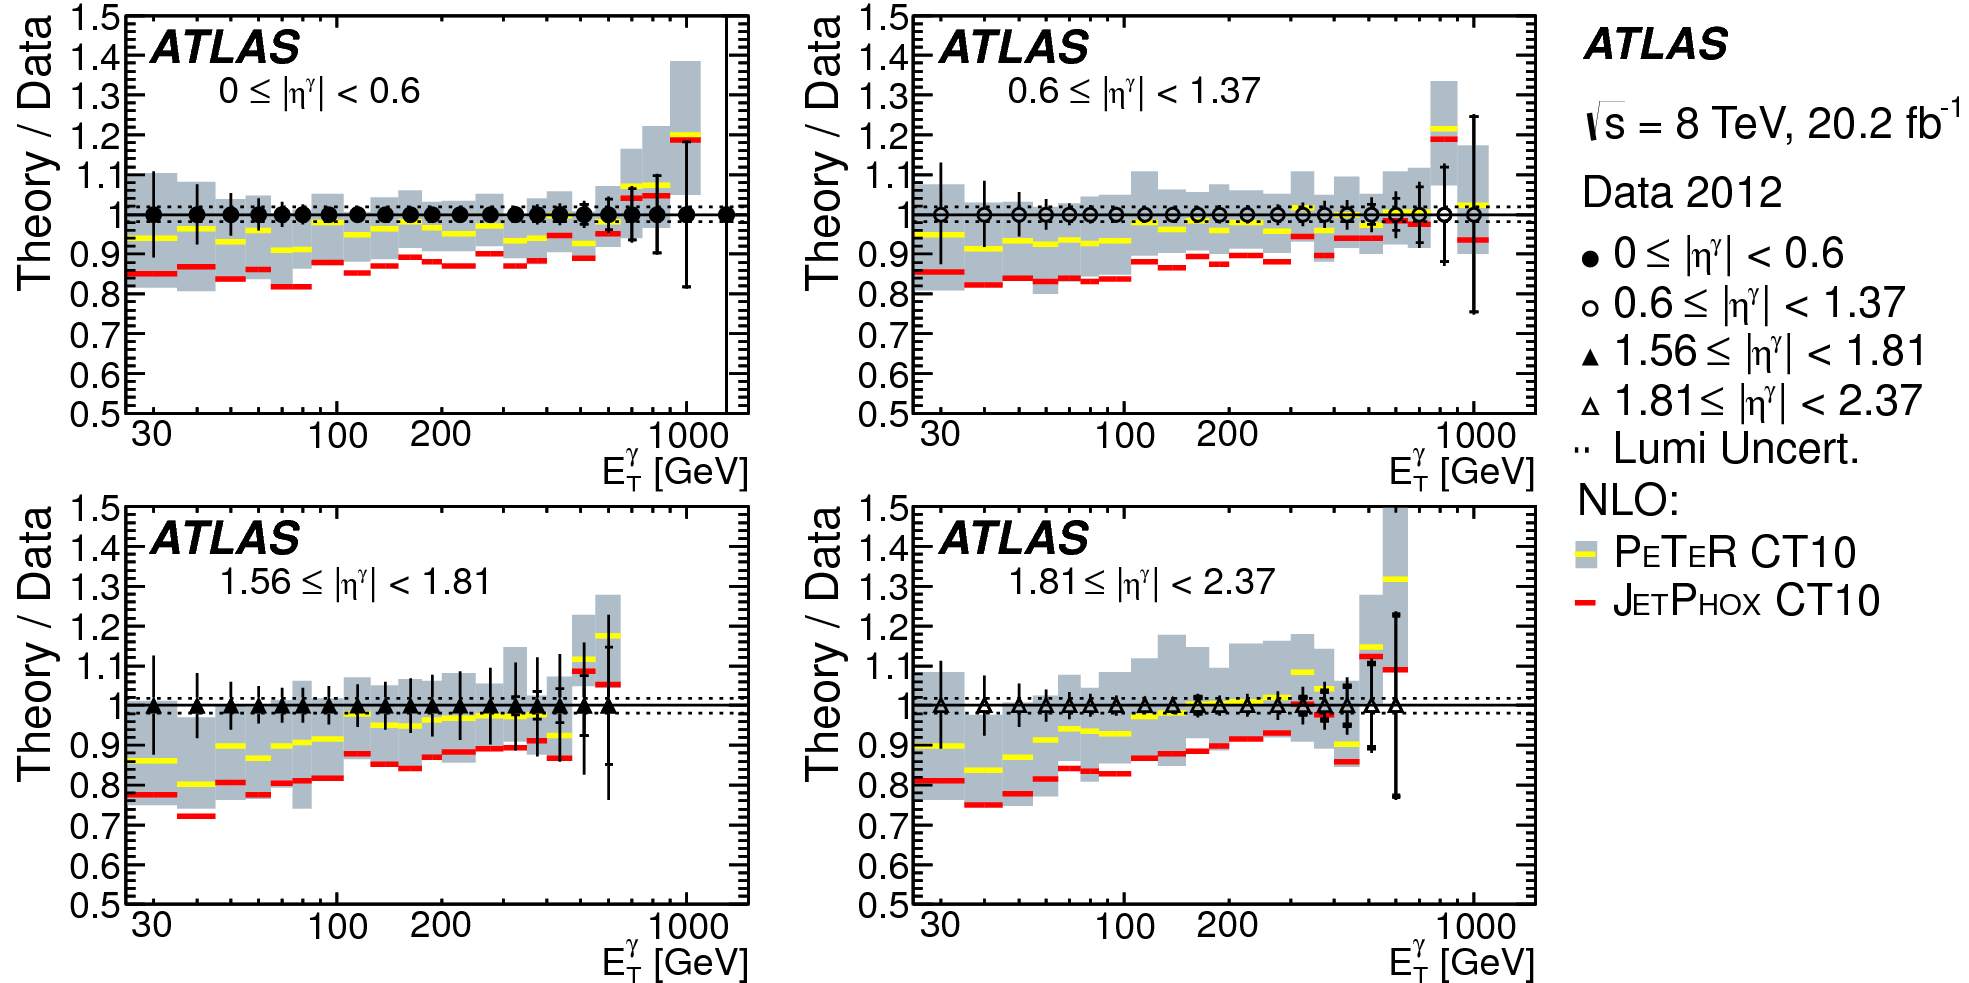
Ratios theory/data for LO Monte Carlo (Pythia and Sherpa) are shown in the four top plots of Figure 2. Sherpa matches the data in GeV. In the lower region (where a larger fragmentation contribution is expected), Sherpa follows the predictions from JetPhox. In the high- region, it tends to go above the measured value. Pythia overestimates the measured cross-section in the low- region (the fragmentation contribution is not well modeled by the parton shower). In the rest, it is similar to JetPhox. The ratios are shown in the bottom eight plots of Figure 2 for the NLO Monte Carlo (PeTer and JetPhox). Predictions of JetPhox are lower than data (up to 20%) but still within uncertainties. The description of the data by PeTer Monte Carlo is much better.
5 Photon measurement at =13 TeV
The isolated prompt photon measurement at =13 TeV [8] used 6.4 pb-1 of data collected in 2015.
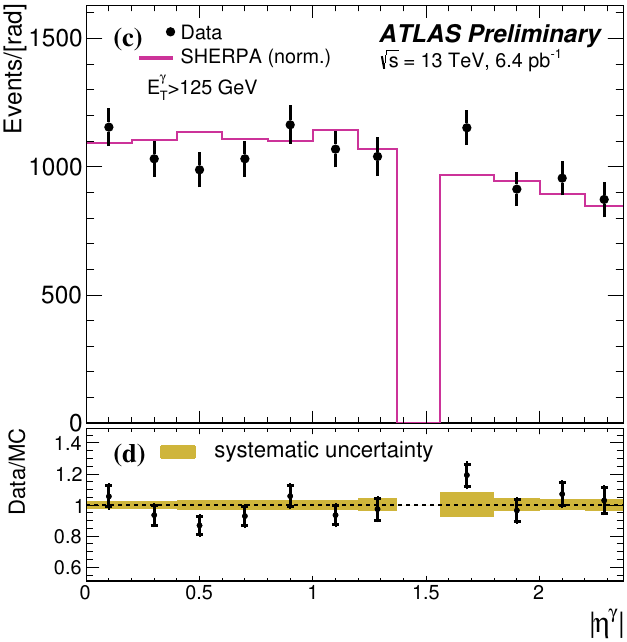
The selected events are required to have at least one reconstructed primary vertex, with at least two associated tracks, consistent with the average beam-spot position. Photons are required to have , and GeV. They are triggered using a single photon trigger with threshold 120 GeV. Tight isolated photons are considered as signal also in this analysis.
The background is subtracted using a 2D sideband method (described in section 4). Additional background (e.g. from multijet processes) removal is required. The events are divided into two groups, one with tight photons and one with non-tight photons. The non-tight distribution is normalised such that the integrals of the tight and non-tight distributions in the range GeV coincide. Contribution of non-tight photons in isolated photons region is considered to be a background and is subtracted to obtain the final signal yield.
Data are compared to LO Monte Carlo. The simulations are done by Sherpa 2.1.1 using CT10 PDF.
Systematic uncertainties are dominated by the photon energy scale and resolution, by the identification and trigger efficiency, and by the modeling of isolation energy. A systematic uncertainty of 5% is assigned to the 2D sideband method.
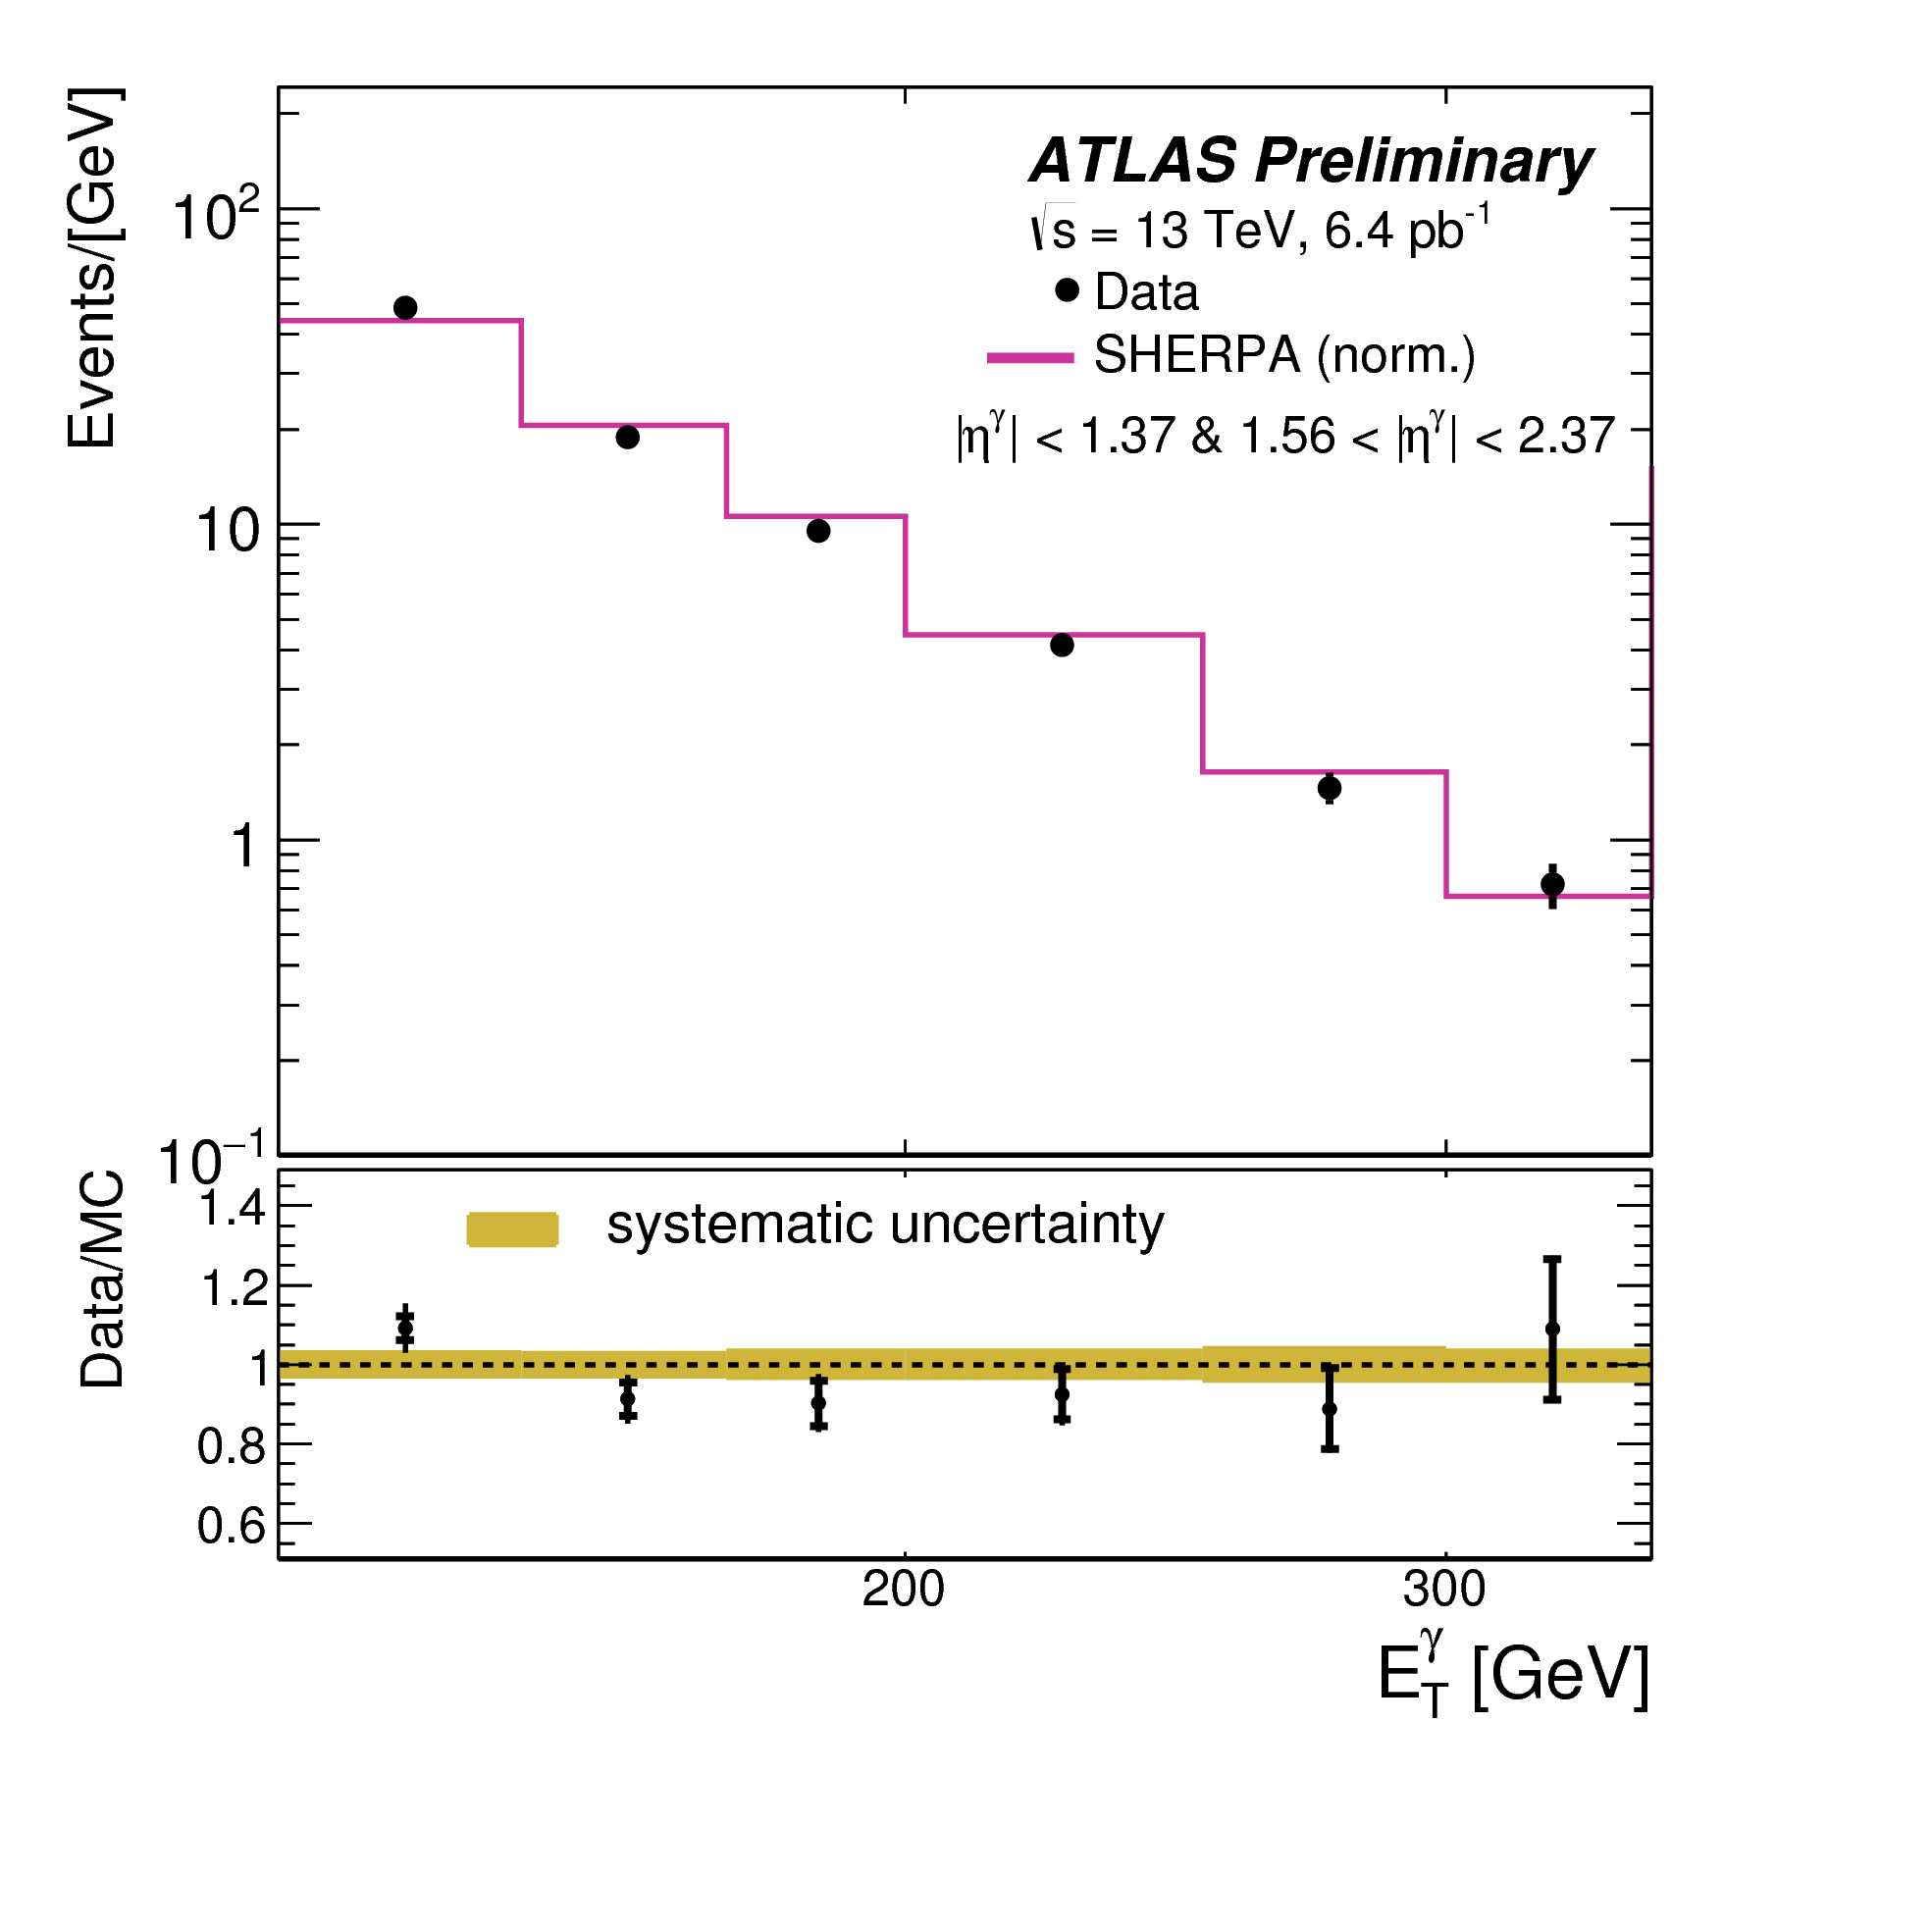
Distributions of the event yield as a function of and for data and Sherpa are shown in Figure 3. The description of the data by the Monte Carlo is good.
6 Jet reconstruction and identification
Jets are reconstructed from topological clusters of cells in the calorimeter using the anti-kT algorithm with radius 0.4. They are calibrated using transverse momentum and pseudorapidity dependent corrections from Monte Carlo. Jets in data are additionally corrected by a factor based on in situ studies.
Identification criteria are selected to reject fake jets reconstructed from non-collision signals - like beam-related background, cosmic rays, or detector noise, etc.
7 Jet cross-section measurement at =13 TeV
The inclusive jet cross-section measurement [9] used 78 pb-1 of data collected in 2015 at =13 TeV.
The selected events are required to have at least one well-reconstructed vertex, which must have at least two associated tracks with transverse momentum greater than 400 MeV and must be consistent with the beam spot of the proton-proton collisions. Jets are measured in the rapidity range and with GeV. The rapidity range is chosen to be within the coverage of the barrel calorimeters. The upper limit is caused by the fact that the performance of the detector for jets with higher is still under study. Single jet triggers with various thresholds are used. Jets are also required to pass a looser identification criterion.
The data are compared to NLO Monte Carlo. The simulations are done by NLOJET++ 4.1.3 [10] (interfaced to APPLGRID [11]) using CT10, MMHT and NNPDF 3.0 PDFs.
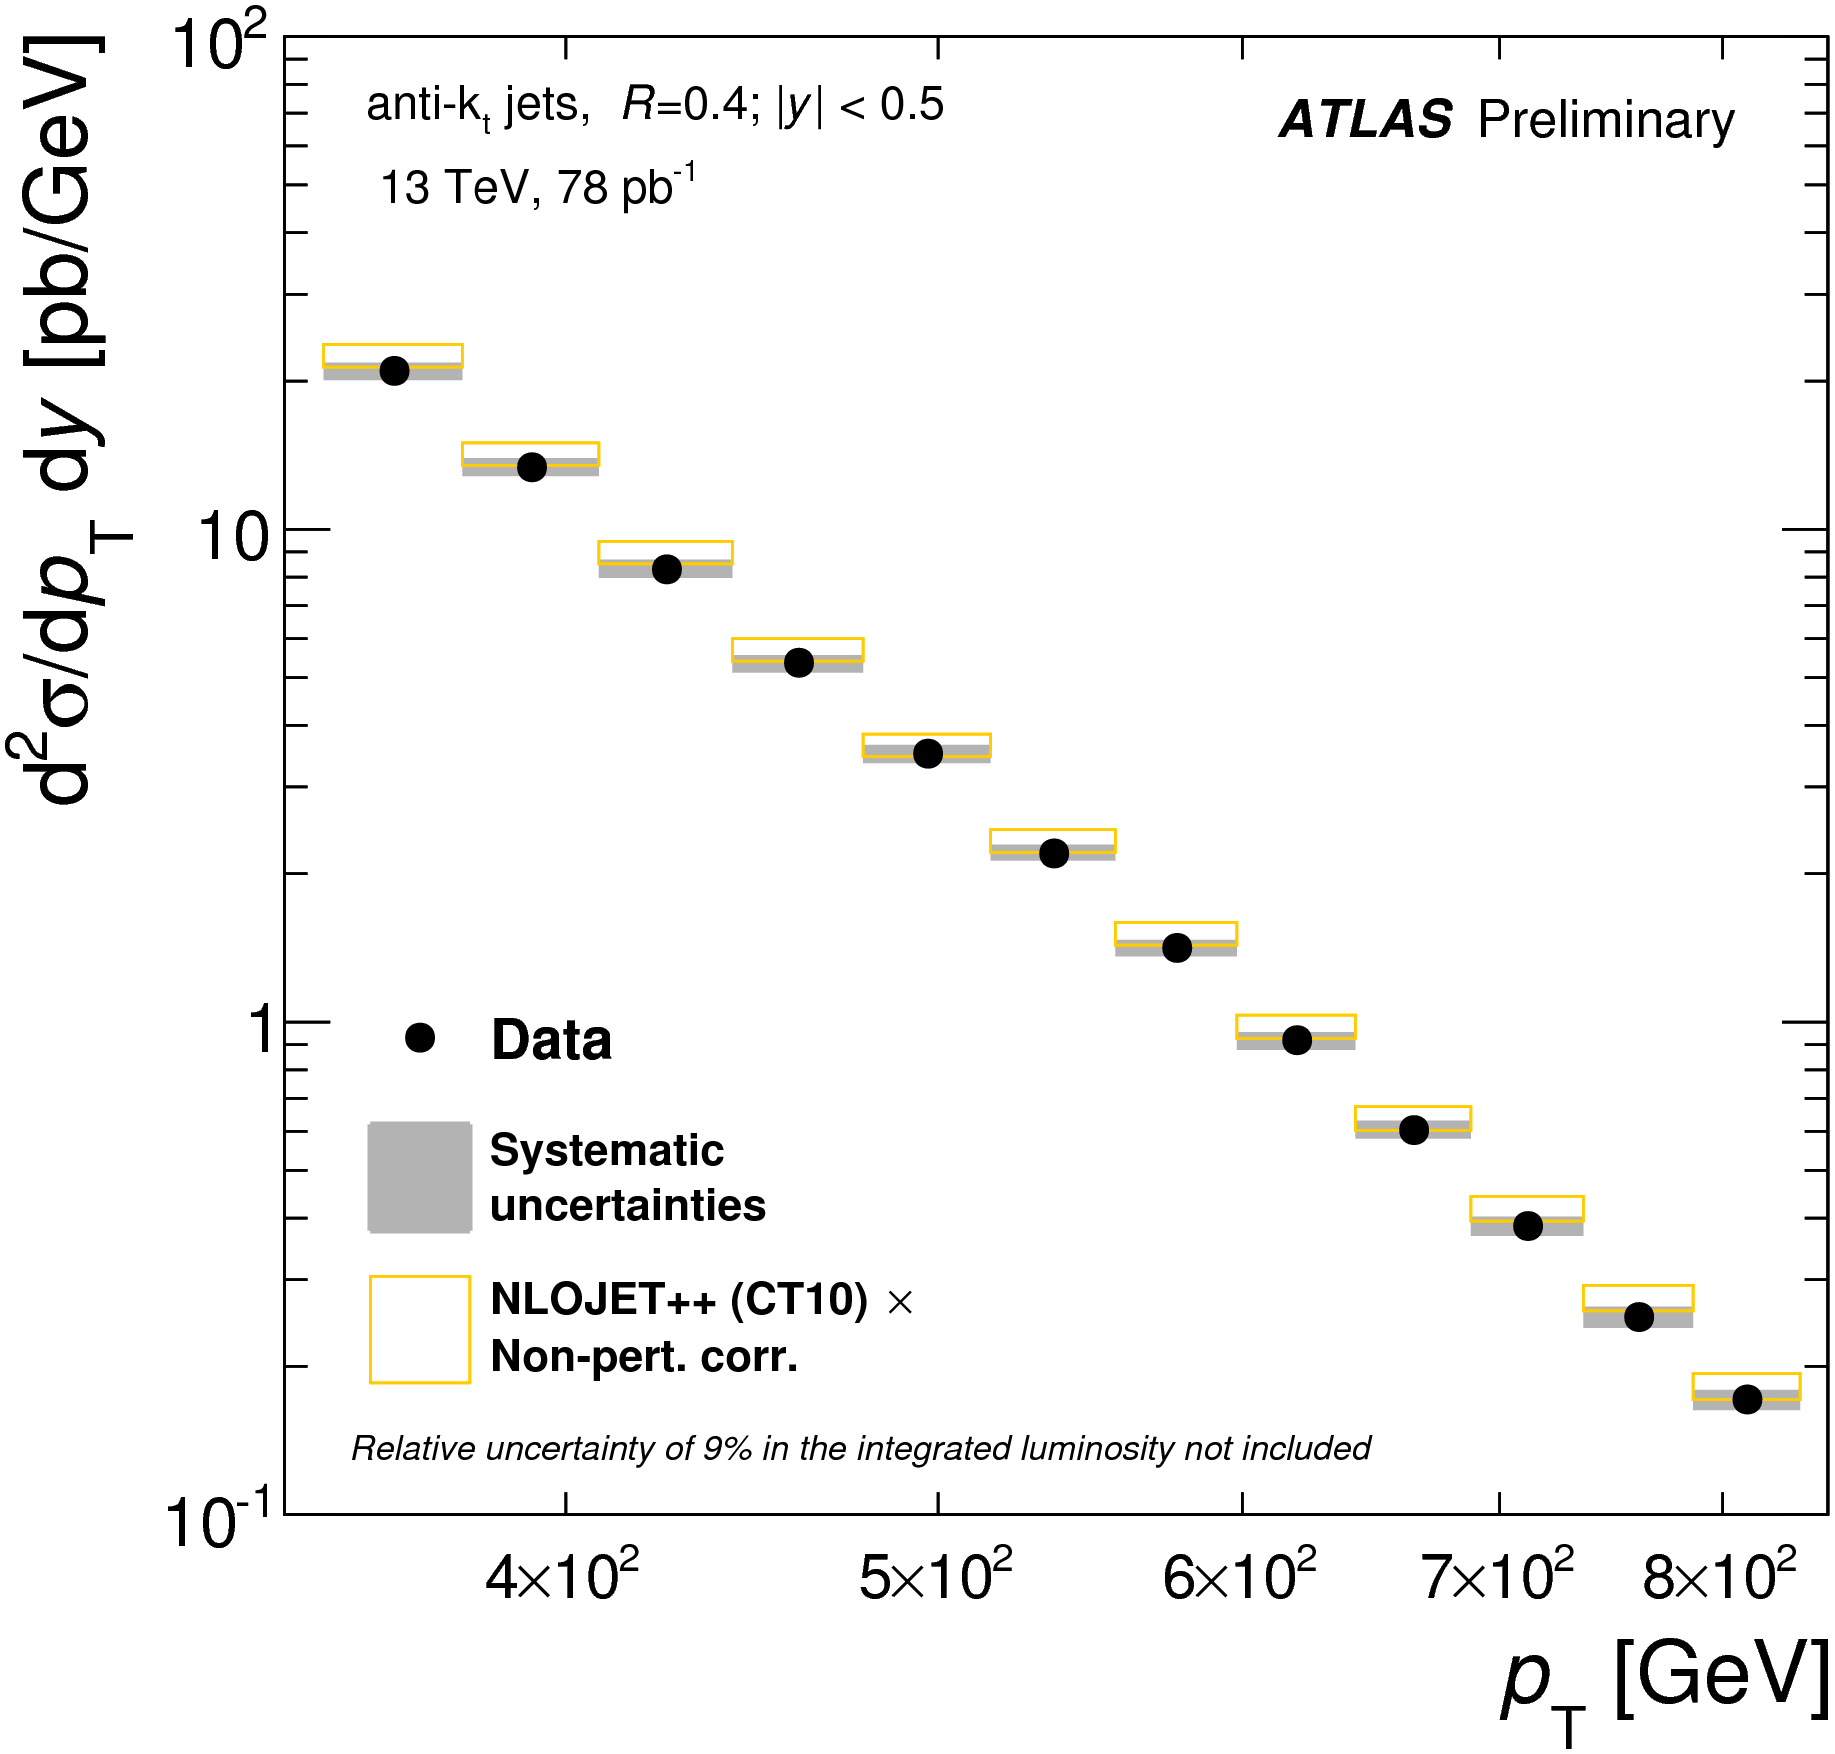
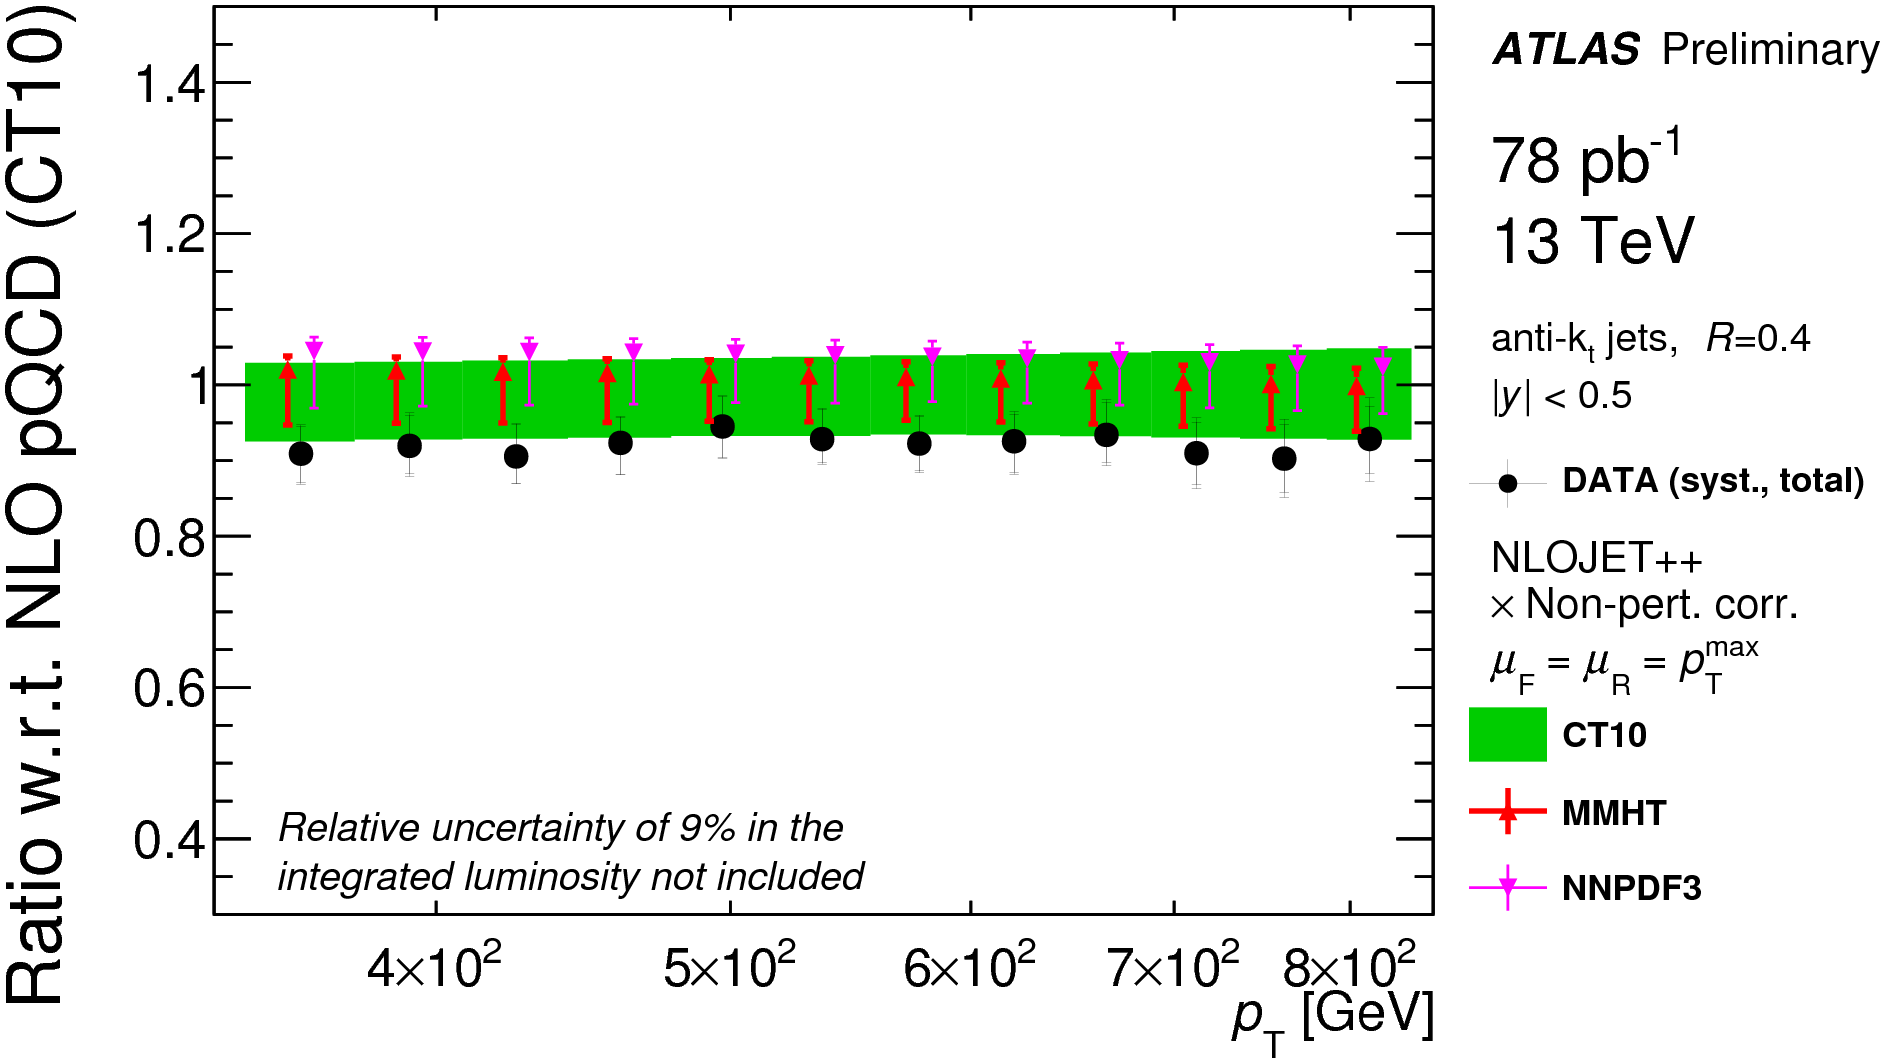
The systematic uncertainty is dominated by the jet energy scale and by the resolution and unfolding uncertainties. The luminosity uncertainty is 9%.
The results are in Figure 4. NLO prediction (using CT10 PDF) describes data well over two orders of magnitude. The dependence of Monte Carlo prediction on PDF used (MMHT and NNPDF3 were tested) is weak.
8 Summary
The cross-section of isolated prompt photon is measured using 20.2 fb-1 of data collected at =8 TeV in 2012. It is measured as a function of transverse energy of the leading photon in four pseudorapidity bins (, , , and ). Data are compared to LO Monte Carlo (Pythia and Sherpa) and NLO Monte Carlo (PeTer and JetPhox). JetPhox describes the shape of the data well over ten orders of magnitude. Its predictions are lower than data (up to 20%) but still within uncertainties. This is valid for all tested PDFs. The description of the data by the PeTer Monte Carlo is much better because of its beyond NLO calculations. Sherpa shows a different behaviour in three different regions when compared to data. In the low- region, Sherpa follows the predictions from JetPhox. A larger fragmentation contribution is expected there. In the region GeV, Sherpa matches the data. In the high- region, it rises above the measured value. Pythia overestimates data in the low- region. The fragmentation contribution is not well modeled by the parton shower in this area. In the rest of the range, Pythia is similar to JetPhox.
The photon yield is measured at =13 TeV using 78 pb-1 of data collected in 2015. It is measured as a function of transverse energy and pseudorapidity of the leading photon. The data are compared to Sherpa. The description of the data by the Monte Carlo is good.
The differential cross-section of the leading jet as a function of jet transverse momentum is measured using 78 pb-1 of data collected at = 13 TeV in 2015. NLOJET++ 4.1.3 using CT10 prediction describes data well over two orders of magnitude.
References
- [1] ATLAS Collaboration, JINST 3 (2008) S08003
- [2] L. Evans and P. Bryant, JINST 3, S08001 (2008)
- [3] ATLAS Collaboration, JHEP 1608, 005 (2016)
- [4] T. Sjostrand, S. Mrenna and P. Z. Skands, Comput. Phys. Commun. 178, 852 (2008)
- [5] T. Gleisberg et al., JHEP 0902, 007 (2009)
- [6] S. Catani, M. Fontannaz, J. P. Guillet and E. Pilon, JHEP 0205, 028 (2002)
- [7] T. Becher, C. Lorentzen and M. D. Schwartz, Phys. Rev. D 86, 054026 (2012)
- [8] ATLAS Collaboration, ATL-PHYS-PUB-2015-016, http://cds.cern.ch/record/ 2037667
- [9] ATLAS Collaboration, ATLAS-CONF-2015-034, http://cds.cern.ch/record/ 2038145
- [10] Z. Nagy, Phys. Rev. D 68, 094002 (2003)
- [11] T. Carli et al., Eur. Phys. J. C 66, 503 (2010)