Unified rheology of vibro-fluidized dry granular media:
From slow dense flows to fast gas-like regimes.
Abstract
Granular media take on great importance in industry and geophysics, posing a severe challenge to materials science JNB96 ; andreotti13 ; puglio15 . Their response properties elude known soft rheological models sollich97 ; delannay07 ; forterre08 ; henann13 , even when the yield-stress discontinuity is blurred by vibro-fluidization dijksman11 . Here we propose a broad rheological scenario where average stress sums up a frictional contribution, generalizing conventional -rheology gdr04 ; cruz05 ; jop06 , and a kinetic collisional term dominating at fast fluidization volfson03 . Our conjecture fairly describes a wide series of experiments in a vibrofluidized vane setup dzuy83 , whose phenomenology includes velocity weakening, shear thinning, a discontinuous thinning transition, and gaseous shear thickening. The employed setup gives access to dynamic fluctuations, which exhibit a broad range of timescales scalliet15 . In the slow dense regime the frequency of cage-opening increases with stress and enhances, with respect to -rheology, the decrease of viscosity. Diffusivity is exponential in the shear stress in both thinning and thickening regimes, with a huge growth near the transition.
Dry granular materials are collections of macroscopic particles, interacting through frictional contact forces. The resistance of a granular aggregate to an applied shearing force is sensitive to many aspects of the experimental setup and may present analogies with macroscopic frictional laws, plasticity, soft glassy rheology and the shear thinning or thickening phenomena of suspensions brown10 ; BGP11 ; dullens11 ; kawasaki14 . Recently, consensus has been achieved on a certain class of steady slow flows which obey the so-called -rheology gdr04 ; jop06 ; cruz05 ; forterre08 . In such a framework the shear stress is proportional to normal pressure through a friction coefficient , which slightly depends on the shear rate itself through the adimensional “inertial number” , according to the following formula:
| (1) |
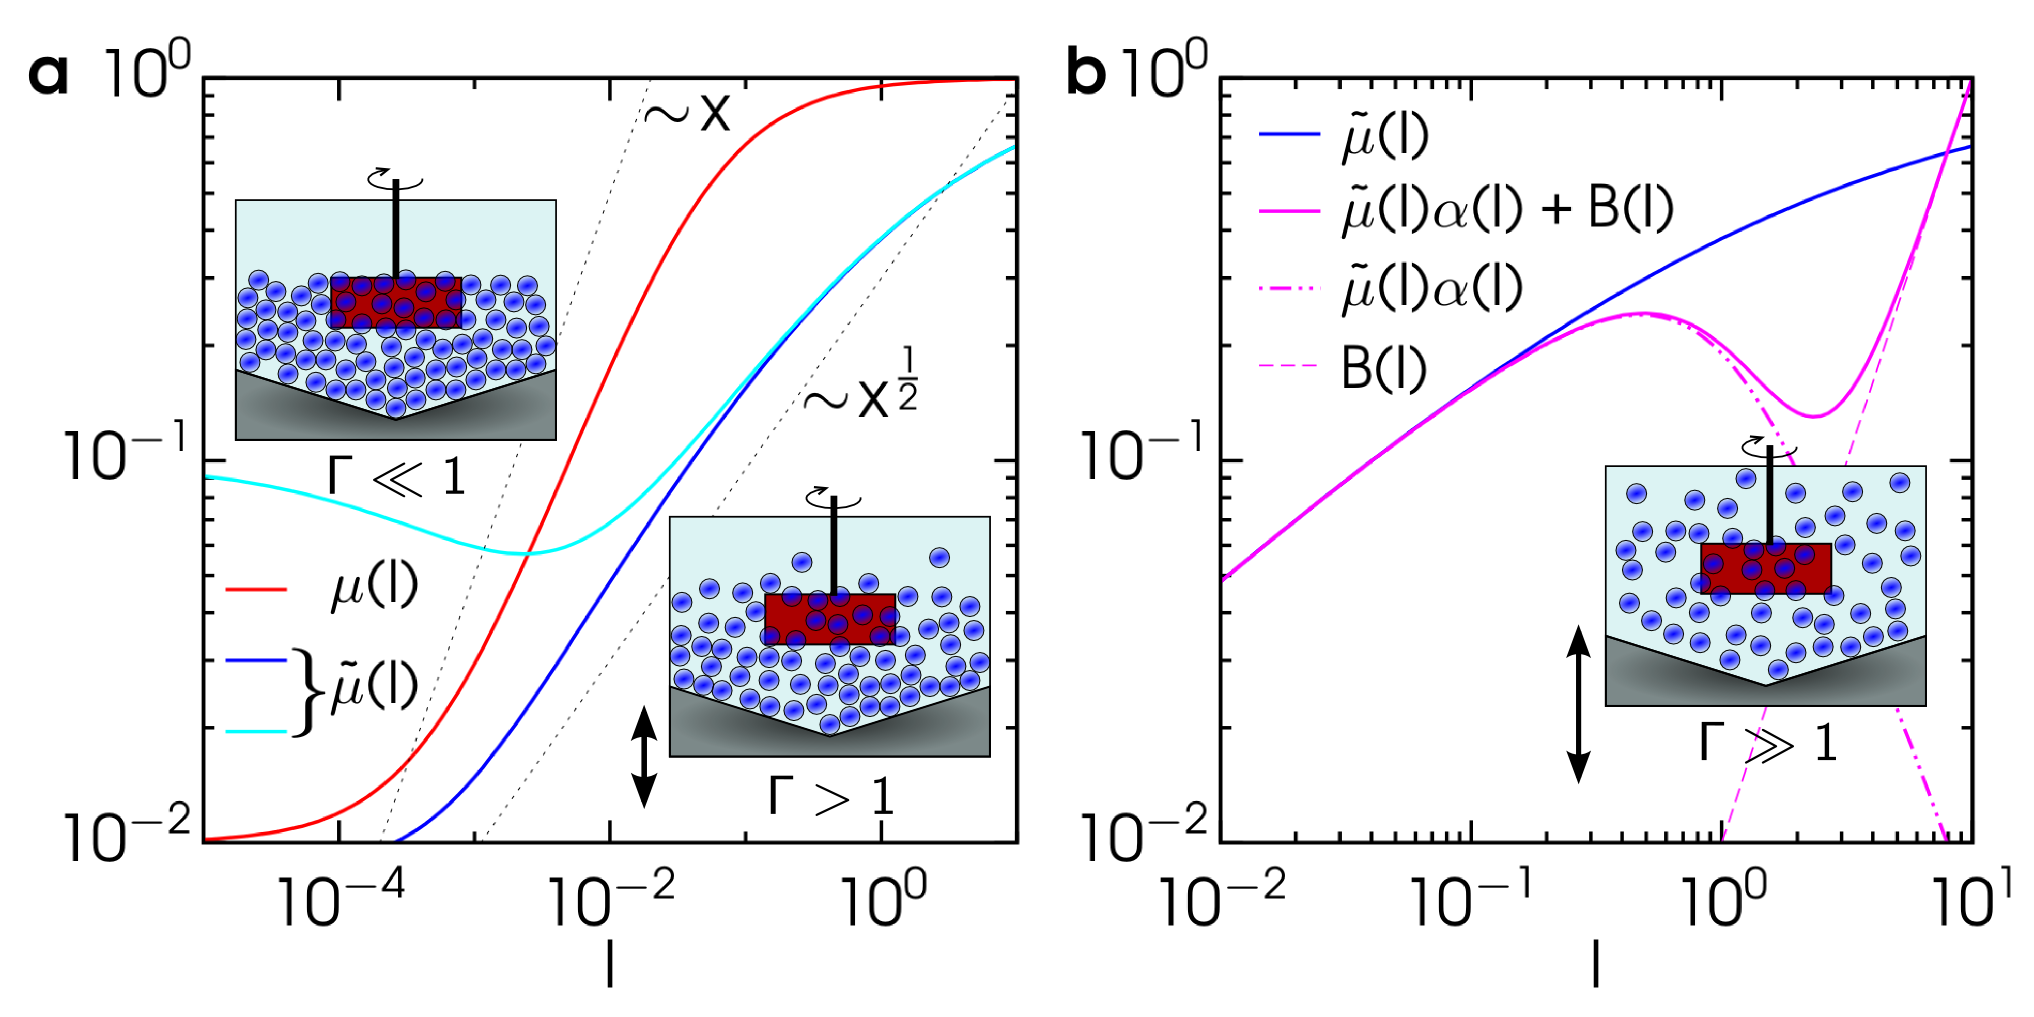
where , and are constants. The above formula (see red curve in Fig. 1a) expresses (at constant ) a monotonic growth of from a minimum yield stress to a saturation (frictional) stress . The inertial number is the ratio between the shear rate and the microscopic frequency ( the diameter of a grain, its material density, its mass, the space dimension). Basically is the inverse of the time needed by a grain to move by under the acceleration given by the pressure, if starting at rest. The validity of the scenario has been probed in different setups and is typically associated with a dilatancy effect in the form of a -dependent packing fraction gdr04 . For this reason the scenario is better appreciated in experiments where the volume is not constrained. Note that Eq. (1) corresponds to a monotonic thinning-like reduction of effective viscosity which goes from to as the shear rate is increased.
A more complex picture emerges in the presence of vibro-fluidization, that is, under vertical vibration of the granular container danna03 ; dijksman11 . In applications, vibro-fluidization is a renowned technique that enhances homogenization and surface of contact at the solid-gas interface for combustion chambers and chemical reactors. A parameter that characterizes the intensity of vibration is , that is the maximum vertical acceleration (in the case of sinusoidal vibration) normalized by gravity acceleration . Even at mild values of (), an internal diffusion of kinetic energy cooperates with the applied stress and softens the discontinuities provided by enduring contacts dijksman11 . The result is the introduction of a thermal-like energy scale (absent in non-fluidized granular media), an evident reduction of the yield stress and a faster fluidization of the material under increasing rates of deformation. Rheological studies in a split-bottom cell under vertical vibro-fluidization demonstrated the existence of a thinning transition dijksman11 , whose exact nature is under scrutiny gravish10 ; wulfert16 , recently ascribed to an internal distribution of microscopic stresses and a local Herschel-Bulkley rate-stress relation wortel16 .
A parallel line of investigation has approached the problem of dry granular rheology by introducing the concept of partial fluidization volfson03 ; bouzid13 . In this context there is agreement about the hybrid nature of granular internal stress, modelled as a superposition of a frictional contribution, sustained by enduring contacts stabilized by normal pressure, and a kinetic contribution, where momentum is transferred through instantaneous collisions of the fluidized particles. The kinetic contribution is expected to be negligible in the densest and slowest regimes, while it emerges in liquid-like flows and finally becomes dominant in gas-like configurations. Notwithstanding the immediacy of the concept of partial fluidization, very different recipes and analyses have been suggested in the literature, focusing on different aspects and setups. A relevant role in this framework is played by models of non-local rheology kamrin12 ; henann13 ; bouzid13 .
Our aim, here, is to put under scrutiny a conjecture of ours for a minimal rheological model, based upon superposition between frictional and collisional contributions to internal stresses, that can embrace the full spectrum of rotationally forced granular flows under vibro-fluidization, specifically a large range of values of and . In general, normal stress (pressure) depends upon the degree of fluidization, i.e. upon both and . For this reason we take as a pressure scale which is the pressure at total rest ( and ): the inertial number takes the same definition as above, by replacing with . Our proposal, illustrated in Fig. 1, takes the following form for a rheological curve at constant :
| (2) |
where the modified friction coefficient (blue and cyan curves in Fig. 1a) has the form
| (3) |
the Bernoulli pressure correction function (see dot-dashed purple curve in Fig. 1b) is defined as
| (4) |
and finally the Bagnold rheology function (dashed purple curve in Fig. 1b) is simply
| (5) |
with , , , , , and model parameters. Our proposal is not only supported by a wide agreement with experimental data, discussed below, but is substantiated through the following physical arguments.
First, in contrast with the original function, a additional contribution appears at the denominator of : it represents “activated fluidization”, that is, the enhancement of the breakage rate of enduring contacts due to the applied stress. We note that the -dependence of the friction coefficient can be ascribed to the variation of the fraction of enduring “solid”-like contacts, namely . A minimal model for consists in neglecting memory effects (expected to be important only at very slow shear rates) and writing down a balance equation MHMK13 , whose stationary state reads , with and the transition rates from fluid to solid state and vice-versa, respectively. Comparison with the usual rheology, Eq. (1), suggests that and are linear in . On the contrary, the correction in the , Eq. (3), implies that is enhanced by an additional contribution . In our experiment detailed below, the analysis of fluctuations provides a transparent interpretation of such an additional term as a cage-exit frequency. The -correction can also reproduce rheological behaviors of the kind shown as the cyan curve in Fig. 1a, i.e. cases of velocity-weakening (an initial reduction of from the value) which appear in certain experiments at very low vibro-fluidization. Weakening cannot be explained by the usual function, which is necessarily monotonic. The correction to pressure dictates the drop in pressure in the presence of finite fluid velocity, in analogy with classical Bernoulli’s principle. Finally, the Bagnold rheology function provides us with the inertial contribution of instantaneous collisions, dominating at large , where one expects a viscous contribution and the “thermal” fluctuations underlying effective viscosity are ruled by the shear rate itself, that is . The Bagnold relation is usually indicated as a case of shear thickening, even if there is no universal consensus on whether the word “thickening” should be reserved for dense suspensions, or it also applies to inertial effects arising in diluted fluids.
Gathering all the pieces together, a general rheological curve is obtained, an instance of which is shown as solid purple curve in Fig. 1b. At the transition between the solid-dominated and the kinetic-dominated regions it is possible to observe a non-monotonic van der Waals-like behavior of which, in stress-controlled experiments, appears as a discontinuous thinning dijksman11 ; wulfert16 . It is straightforward to verify that a continuous change of parameters appearing in Eq. (2) transforms the non-monotonic crossover in a monotonic one, as seen in the experiments. We underline that the non-monotonic crossover between and is clearly distinct from the velocity-weakening effect discussed above, which belongs to the behavior of alone.
The unified rheological formula, Eq. (2), contains a series of parameters which depend, among other physical aspects of the setup, upon the intensity of vibro-fluidization . We remark that in the frictional contribution the dependence on is expected to have a behavior opposite to that in the kinetic contribution . Indeed, vibro-fluidization reduces the steady fraction of enduring contacts, while increasing the thermal agitation of flying/colliding particles. Such contrasting dependencies neatly reflect our experimental observations, as described below.
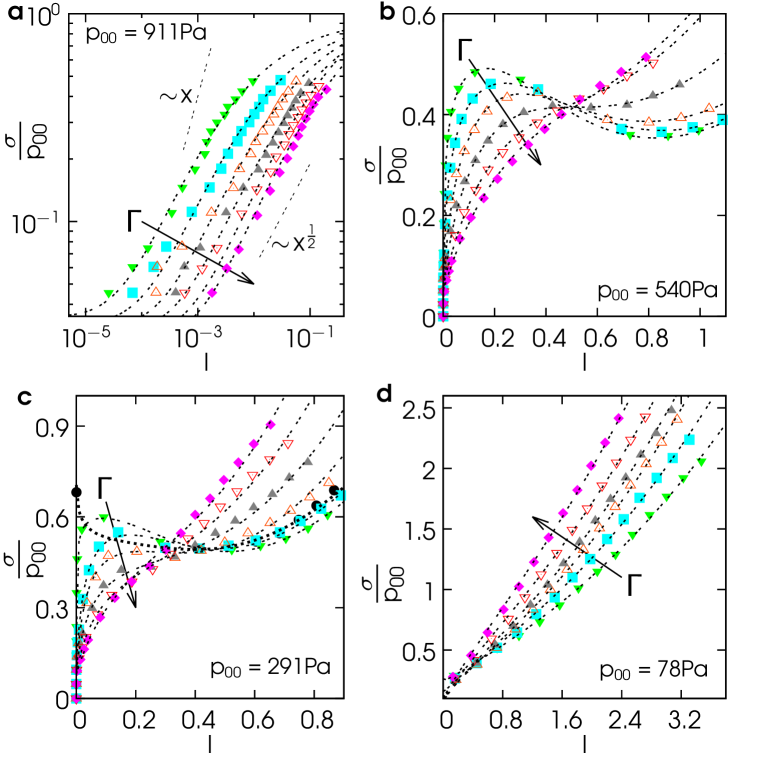
The theoretical picture of Eq. (2) fairly describes the broad phenomenology observed in the experiments we carried out. These are inspired by vane-test tools for the in-situ rheology of soils dzuy83 ; ford09 , while the granular medium undergoes mechanical vibro-fluidization in the vertical direction. Experiments are detailed in the Methods section. The observed rheological curves vs explore ranges of which depend upon . The four frames in Fig. 2 show several representative cases together with their best fits through Eq. (2).
Frame illustrates a case at high which provides us with a high resolution at low , i.e. zooming in the first part of Eq. (2), where the kinetic contribution is negligible and . The behavior is evident, as well as a small but non-negligible yield stress . At intermediate values of (frames and ) the flow curve vs exhibits the crossover from the solid-dominated regime to the collisional-dominated regime, which at low is non-monotonic. Increasing the parameters change continuously, leading to a point where the curve becomes monotonic. The pressure at rest in case is low enough to allow a series of data at (see black circles) where a large yield stress can be measured. Finally, frame reports a low pressure situation, where the collisional part of Eq. (2) dominates, leading to thickening-like behavior, that is an increasing differential effective viscosity . The four frames confirm what we argued in the above theoretical discussion: when the stress is dominated by the solid contribution, an increase of leads to a reduction of stress, while the opposite occurs when the kinetic contribution dominates. At a given , the value of corresponding to the crossover between the two regimes does not depend upon : indeed the non-monotonic curves (case and at low ) cross, roughly, at a single point.
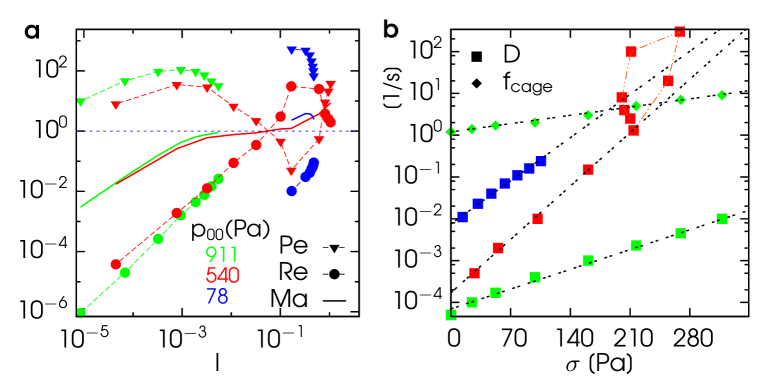
Further support for our picture comes from the study of fluctuations, made feasible by our vane-test experiment where the rotating blade behaves also as a micro-rheological probe wang14 ; scalliet15 ; lasanta2015 . In particular we have measured diffusivity (where is the angular position of the blade), the frequency of relaxation of the angular velocity defined as , and the frequency of typical cage exit (which is well defined only in the slow dense cases at high scalliet15 ). The precise definition of those quantities is given in the Methods section. The Péclet number , the Reynolds number and the Mach number , are shown in Fig. 3, frame . In both cases at high and low , we find and wang16 , with the crucial difference that in the high case and in the low case. Interestingly, an inversion occurs - with becoming smaller than and larger than - at a value of corresponding to crossing , comparable to that where the unstable branch of begins. At higher the two numbers come back to be ordered as , with . The observation of in the low case with thickening (red circles) suggests that our definition of is not adequate in regimes of very high Mach numbers.
Green diamonds in Fig. 3b indicate which at low values of stress is well approximated by . This observation, together with the behavior seen in Fig. 2a, is compatible - at low rates - with our interpretation of the denominator of : the main responsible factor for the loosening of solid-like contacts is the activated escape from trapping cages hecke15 . A further observation concerns the dependence of on , again displayed in Fig. 3b: in all regimes, excluding the dense-dilute crossover region, we observe a striking exponential behavior . This law seems universal and denotes a wide variability of when is varied keeping constant. For instance in cases near the transition a variation of more than three decades appears. Those findings reveal an extreme sensitivity of micro-dynamics to external disturbances which is critical in designing industrial processes or predicting geophysical hazards.
Methods
.1 Details of the experiment
The granular medium was made of a number of spheres of diameter mm made of non-magnetic steel (mass of each sphere: g), glass (mass g), or delrin® (mass g). They were housed in a plexiglas® cylinder with a conical-shaped floor (diameter mm, minimum height mm, maximum height mm) in which a plexiglas vane (height mm, width mm, length mm) was suspended in order to be in contact with the granular medium and not with the container gnoli14 . The container was vertically vibrated by an electrodynamic shaker (LDS V450) fed with an acceleration signal . In most of the experiments is a white noise with a band-pass filter between Hz and Hz, while in the lowest case ( Pa) we used a sinusoidal signal at frequency Hz. This choice is motivated by two empirical observations: 1) a lower number of particles (as in the case of low ) requires a larger energy input to be homogeneously fluidized and to reach the blade, and this can be obtained by supplying energy through a sinusoidal signal at low frequency; 2) in dense cases a sinusoidal signal induces spurious resonances, while in diluted cases such resonances are never observed. We have checked that performing the same experiments with noise signal for (pushing the shaker to its working limits) gives flow curves with the same shape. An accelerometer placed on the container side measured , allowing us to define . The vane, mounted through its rotation axis to a rotary encoder, was also connected to a dc motor (typical working voltage V) as the source of the driving torque. The motor was directly fed by a dc voltage supply in the range to V. No limit was set for the maximum current absorbed by the motor that, averaged on the duration of the experiment, was never higher than mA. A data acquisition system collected data for the angular position/velocity of the vane, the effective motor voltage, the current circulating in the motor and the root-mean-square vertical acceleration of the container. A procedure of calibration allowed us to translate average values of current into average values of applied torque. The same procedure helped determining the moment of inertia of the rotating block, (the blade with its axis and the gears linking it to the motor). The typical experiment, at a given and applied motor voltage, was s long, with the granular always “reset” at the beginning of each run for s at high shaking intensity () and motor off. This procedure - together with periodic replacement of used spheres - guaranteed reproducible results at a distance of several weeks. Packing fractions was non-homogeneous (it was larger in regions far from the borders of the container): its value at rest was estimated to be in the range , while it decreased when vibration was switched on. In the analysis we have identified the shear rate with the average of the angular velocity of the rotating blade, i.e. , while the shear stress is proportional to the average of the applied torque through the shear stress constant , i.e. with (with and the blade half-length and height, respectively) dzuy83 .
.2 Details of data analysis
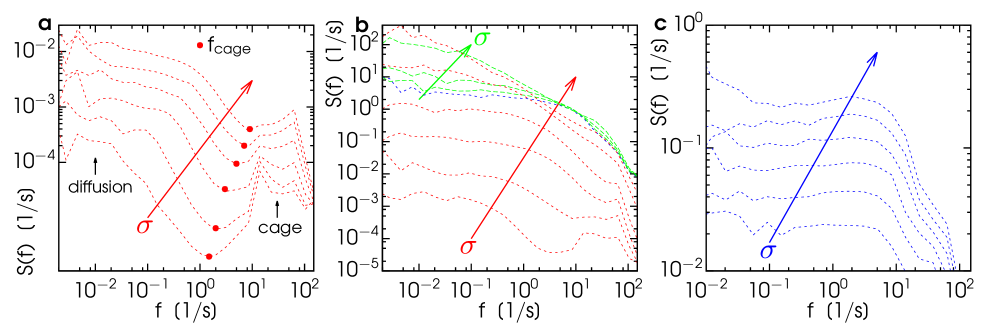
Velocity power density spectra (VPDS) are defined as with the time-length of an experiment ( seconds). Some examples of curves are shown in the Fig. 1 of Supplementary Information (SI). In scalliet15 VPDS in a similar vibro-fluidized experimental setup, without applied torque (), has been investigated. In the dilute or gas-like limit, e.g. low number of spheres at high shaking, the VPDS takes a simple Lorentzian shape , with the asymptotic (long time) diffusivity and the effective viscosity due to granular gas-vane collisions. When the number of particles (density) is increased and/or the intensity of shaking () is reduced, the system approaches a slow liquid regime and the VPDS develops a wide bump (or smooth peak) with a maximum near Hz, which is associated to oscillations of the velocity autocorrelation induced by liquid cages. At much smaller frequencies the VPDS reaches a plateau whose height, , corresponds to diffusivity : indeed the blade is not trapped in a cage forever, eventually it manages to explore a much larger phase space and reaches normal diffusion. From the low frequencies plateau of VPDS we have extracted values of for Figure 3. We have defined the cage-exit frequency as the x-position, in the VPDS plot, of the minimum separating the cage bump from the low-frequency diffusive plateau (see filled circles in Fig. 1 of SI).
Acknowledgements
We thank Giorgio Pontuale for useful discussions and suggestions. We also thank Rachele De Felice and Francisco Vega Reyes for reading the manuscript.
Corresponding author
Correspondence to: Andrea Puglisi, andrea.puglisi@roma1.infn.it
References
- (1)
- (2)
References
S1. Parameters for the fits of rheology curves.
In Table 1 we report the values of the parameters for the fits of experimental data (Fig. 2 of main text) through Eq. (2) of main text (errors are on the last digit). We notice some general trends:
-
•
(relative value of yield stress) decreases with (while its behavior with is not clear);
-
•
and increase with and decrease with ;
-
•
does not exhibit a strong dependence with , while its dependence upon is stronger and non-monotonic;
-
•
slightly decreases with and is non-monotonic with ;
| Pa ( spheres of steel) | ||||||
| 3.40 | 0.040 | 0.001 | 1.2 | 0.95 | ||
| 6.70 | 0.037 | 0.003 | 3.6 | 0.95 | ||
| 11.6 | 0.033 | 0.007 | 7.0 | 1.03 | ||
| 18.3 | 0.030 | 0.015 | 0.0015 | 1.08 | 11.11 | |
| 27.4 | 0.022 | 0.035 | 0.0030 | 1.36 | 10.00 | |
| 38.4 | 0.020 | 0.050 | 0.0032 | 1.44 | 8.33 | |
| Pa ( spheres of steel) | ||||||
| 2.4 | 0.07 | 0.0020 | 4.0 | 0.65 | 0.65 | 2.27 |
| 5.0 | 0.04 | 0.0055 | 5.0 | 0.75 | 0.69 | 2.35 |
| 8.9 | 0.04 | 0.039 | 0.0080 | 0.98 | 0.65 | 2.21 |
| 14.6 | 0.04 | 0.10 | 0.0153 | 1.25 | 0.67 | 1.89 |
| 22.5 | 0.05 | 0.32 | 0.23 | 1.21 | 0.71 | 1.61 |
| 31.9 | 0.04 | 0.50 | 0.50 | 1.25 | 0.80 | 1.59 |
| Pa ( spheres of glass) | ||||||
| 0 | 0.47 | 0.85 | 0.38 | 1.50 | 0.61 | 1.27 |
| 1.1 | 0.29 | 1.1 | 2.1 | 0.66 | 0.53 | 1.29 |
| 8.7 | 0.15 | 0.026 | 0.795 | 0.69 | 0.53 | 1.25 |
| 14.3 | 0.12 | 0.029 | 0.80 | 0.62 | 0.53 | 1.11 |
| 22.1 | 0.17 | 0.045 | 0.80 | 0.55 | 0.67 | 1.02 |
| 32.0 | 0.15 | 0.070 | 0.80 | 0.55 | 0.77 | 0.91 |
| 43.0 | 0.12 | 0.174 | 28.8 | 0.67 | 0.67 | 0.81 |
| Pa ( spheres of steel) | ||||||
| 6.9 | 0.083 | 3.90 | 1.44 | 3.21 | 16.13 | 3.13 |
| 8.6 | 0.062 | 2.35 | 1.36 | 2.59 | 9.09 | 2.78 |
| 10.7 | 0.034 | 2.69 | 1.71 | 3.00 | 10.31 | 2.56 |
| 13.2 | 0.026 | 2.55 | 1.75 | 3.15 | 7.69 | 2.44 |
| 19.2 | 0.022 | 3.50 | 2.66 | 4.40 | 7.14 | 2.35 |
| 26.2 | 0.017 | 4.80 | 4.18 | 6.43 | 7.69 | 2.27 |
S2. Analysis of velocity power density spectra.
In Figure 4 we show some of the power density spectra of the angular velocity time-series measured by the blade in seconds-length experiments. The velocity power density spectrum is defined as
| (6) |
In frame (a), reporting results for the high density/pressure and low velocity experiments, we have marked with “cage” the bump - in the region Hz, associated to fast elastic oscillations related to trapped dynamics. In the same frame, the frequency of cage-exit ( in the main text) is the ascissa of the filled dot. At low frequencies the height of the characteristic plateau, present in all experiments, defines the diffusivity . In all frames the arrow represents the order of growing (shear stress or average applied torque). In the central frame, the green curves represent the values of which decrease when increases (see green triangles in Fig. 2b of main text). The blue curve corresponds to the first point where starts to grow again at large .