Also with ]Coimbra Engineering Institute, Coimbra, PortugalPresent address: ]IFIC, CSIC-Universidad de Valencia, Valencia, SpainXENON Collaboration
Search for Two-Neutrino Double Electron Capture of 124Xe with XENON100
Abstract
Two-neutrino double electron capture is a rare nuclear decay where two electrons are simultaneously captured from the atomic shell. For 124Xe this process has not yet been observed and its detection would provide a new reference for nuclear matrix element calculations. We have conducted a search for two-neutrino double electron capture from the K-shell of 124Xe using 7636 kgd of data from the XENON100 dark matter detector. Using a Bayesian analysis we observed no significant excess above background, leading to a lower 90% credibility limit on the half-life yr. We have also evaluated the sensitivity of the XENON1T experiment, which is currently being commissioned, and found a sensitivity of yr after an exposure of 2 tyr.
I Introduction
Double electron capture is a rare nuclear decay where a nucleus captures two electrons from the atomic shell
| (1) |
The two-neutrino mode (22EC) is allowed in the Standard Model while the existence of the lepton number-violating neutrinoless double electron capture (02EC) would prove the Majorana nature of the neutrino. In 02EC, there is the possibility of a resonant enhancement of the decay rate for decays to excited atomic or nuclear states Sujkowski and Wycech (2004); Krivoruchenko et al. (2011); Suhonen (2013a); Maalampi and Suhonen (2013). Due to low isotopic abundances and longer half-lives Rodríguez and Martínez-Pinedo (2012); Kotila et al. (2014), experimental searches for 02EC are generally not competitive with those for neutrinoless double beta decay (02) to constrain the effective neutrino mass and the neutrino mass hierarchy Povinec et al. (2015). The largest uncertainty in the conversion of the half-life of 02 or 02EC to is introduced by the calculation of nuclear matrix elements. Although the matrix elements for the two-neutrino and neutrinoless modes of the double electron capture differ, they are based on the same nuclear structure models. A measurement of the 22EC half-life would help to test the accuracy of these models.
So far, 22EC has only been observed for 130Ba in geochemical experiments Meshik et al. (2001); Pujol et al. (2009). In addition, there is an indication for 22EC of 78Kr from a low-background proportional counter Gavrilyuk et al. (2013). In natural xenon the isotopes 124Xe ( keV Wang et al. (2012), abundance 0.095% Berglund and Wieser (2011)) and 126Xe ( keV Wang et al. (2012), abundance 0.089% Berglund and Wieser (2011)) can decay via 22EC. However, any signal will be dominated by 124Xe due to the dependence of the phase space Bernabeu et al. (1983). In the case of 124Xe, the theoretically calculated branching ratio that the two electrons are captured from the K-shell (22K) is 76.7% Gavrilyuk et al. (2015a). Filling the vacancies of the daughter atom 124Te leads to the emission of X-rays and Auger electrons with a total energy of approximately 64 keV. There is a wide spread in the predicted half-lives of 22EC for 124Xe, from yr to yr due to different nuclear matrix element calculations Hirsch et al. (1994); Aunola and Suhonen (1996); Rumyantsev and Urin (1998); Suhonen (2013b); Singh et al. (2007); Shukla et al. (2007). Previous searches for 22K of 124Xe have been carried out using a low-background proportional counter with enriched xenon Gavrilyuk et al. (2015b, a) and large-scale liquid xenon detectors Mei et al. (2014); Abe et al. (2016). The current best experimental limit on the half-life, yr (90% confidence level), is set by the XMASS experiment Abe et al. (2016).
A limit of yr (90% confidence level) was derived from previously published XENON100 data Mei et al. (2014). However, the available data was not well suited for a signal search due to the coarse binning. The limit was calculated from the average background rate for the energy region below keV Aprile et al. (2012a), outside the expected 22K signal region and the assumed isotopic abundance of 124Xe did not match the real situation. Here, we improve on this study by using the 224.6 live days of XENON100 data and additional insight into the experimental details.
II The XENON100 Experiment
Located at the Laboratori Nazionali del Gran Sasso (LNGS), the XENON100 experiment Aprile et al. (2012b) utilizes a dual-phase xenon time-projection chamber (TPC) in order to search for dark matter particles in form of Weakly Interacting Massive Particles (WIMPs). The TPC contains a total 62 kg of liquid xenon (LXe) in a cylindrical (30.5 cm height and diameter) volume equipped with 178 radio pure photomultiplier tubes (PMTs) placed in the gaseous phase on top and immersed in the LXe at the bottom. The TPC is fully surrounded by an active LXe veto viewed by 64 additional PMTs. If a particle deposits its energy in the LXe, it creates excited atoms and ions leading to the formation of excimers. The de-excitation of these excimers causes prompt scintillation light (). A fraction of the electrons generated by the ionization process are drifted towards the gas phase by an applied electric field of 530 V/cm. At the liquid-gas interface they are extracted and accelerated by a strong field of 12 kV/cm. This induces a secondary scintillation signal () which is proportional to the number of generated electrons. Three-dimensional event vertex reconstruction is achieved by obtaining the interaction depth from the time difference of the two signals and by deriving the -position from the hit pattern of the signal on the top PMT array. A background-optimized fiducial volume can thus be selected, with a strongly reduced background from external -radiation. A detailed description of the detector can be found in Ref. Aprile et al. (2012b).
III Data Analysis
Data for the 22K-search consists of 224.6 live days collected between February 28, 2011 and March 31, 2012 using a fiducial target mass of 34 kg. This data set has also been analyzed for different purposes in Refs. Aprile et al. (2012a, 2013, 2014a, 2015a, 2015b). The detector was filled with a mixture of natural xenon and xenon depleted in 136Xe and 124Xe, leading to a 124Xe abundance of . This corresponds to an absolute amount of about 29 g of 124Xe in the fiducial volume.
The energy calibration uses the and signals from an Americium-Beryllium (241AmBe) calibration measurement. We employ -lines from neutron-activated xenon isotopes at 40 keV and 320 keV (129Xe), 80 keV (131Xe), 164 keV (131mXe) and 236 keV (129mXe). The energy was obtained by a linear combination of the and signals measured in photoelectrons (PE), exploiting their anti-correlation Aprile et al. (2007); Szydagis et al. (2011)
| (2) |
is the mean energy required to produce a photon or electron and and are detector-specific gain factors. When fixing to 13.7 eV Szydagis et al. (2011), the best-fit values of the gain factors are PE/photon and PE/electron. Although the and signals depend on particle type and vary non-linearly with energy, the combined signal provides a common, linear energy scale for both X-rays and Auger electrons at the relevant energies. The energy resolution was derived from the same -lines and is given by
| (3) |
with and .
Selection cuts were applied in order to ensure data quality and consistency. Every valid event was required to have exactly one S1 and one corresponding S2. In order to avoid dark count contributions, the S1 had to be detected by at least two PMTs. Further cuts address the removal of noisy events using the information on the signal width ( and ) and on the signal distribution between the top and bottom PMT arrays. Events which have a coincident signal in the veto were not considered as this indicates multiple scattering induced by external radiation. The acceptance of each selection cut was calculated analogous to Ref. Aprile et al. (2014b) by determining the fraction of events that passed all selection cuts but the one of interest. The total acceptance in the -region around the expected signal was found to be .
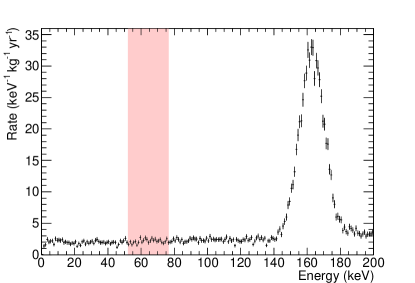
Fig. 1 shows the spectrum after applying all cuts. The peak at 164 keV originates from the de-excitation of the long-lived 131mXe ( d) from the neutron calibration before the run. Apart from this peak, the background is nearly constant with an average rate of events/(keV kg day). This is expected for a background that is dominated by low-energy Compton scatters Aprile et al. (2011).
To determine the expected mean energy and width of the signal, we calculated the energies and emission probabilities of all X-rays and Auger electrons for a single K-shell vacancy in Te using the RELAX code Cullen . The calculation accounts for bound-bound X-rays and electrons which are emitted from transitions within the atomic shell. In addition, it is assumed that the final atom returns to neutrality by filling all remaining vacancies with electrons from the continuum which leads to the emission of free-bound X-rays. The results are summarized in Table 1.
| Energy per | Number of | |
|---|---|---|
| Quantum (eV) | Quanta | |
| bound-bound X-rays | 25950 | |
| bound-bound electrons | 572 | |
| free-bound X-rays | 14 |
The individual quanta emitted in the de-excitation process cannot be resolved due to the limited spatial and timing resolution of the detector. Therefore, the expected signal is a single peak at the sum energy. The RELAX code assumes that the shell binding energies are independent of the ionization of the atom. Therefore, the total emitted energy equals the binding energy of the K-shell of the neutral atom keV Thompson and Vaughan (2001). In 22K the total emitted energy is given by the double-electron hole energy keV Nesterenko et al. (2012) which is very close to two times the K-shell binding energy keV. However, the energies of a small fraction of the emitted quanta are below the xenon excitation threshold of 13.7 eV. According to RELAX, and under the assumption that the quanta emitted in 22K are similar to those generated by two single K-shell vacancies, this leads to an average energy loss of 0.13 keV. Therefore, the 22K peak is expected to be centered at 64.33 keV. To estimate the energy resolution of the signal peak, we take the average energy and number of X-rays and electrons emitted per vacancy as shown in Table 1 but neglect the contribution from free-bound X-rays. Again, assuming the same de-excitation spectrum as for two single K-captures, we arrive at an energy resolution of
| (4) |
where and are the average number of X-rays and Auger electrons and and correspond to their respective energy resolution from Eq. (3). This leads to keV compared to keV for a single energy deposition.
The statistical analysis for the signal search uses the Bayesian Analysis Toolkit Caldwell et al. (2009). The spectrum with a 1 keV binning was fit in the energy range 10–135 keV with a “signal+background” model and a “background-only” model
| (5) | |||||
| (6) |
is the energy, the decay rate, the signal acceptance, the abundance of 124Xe, the exposure, Avogadro’s constant, the molar mass of xenon, is the mean energy and the width of the signal peak. The parameters and represent the slope and constant term of the background spectrum, respectively. The binned likelihood of the fit assumes independent Poisson fluctuations of the bin entries and is defined as
| (7) |
where is the total number of bins. is the expected number of events and the observed number of events in the th bin. Systematic uncertainties were included in the fit by Gaussian priors and are summarized in Table 2. The uncertainty on the cut acceptance is only statistical. For the natural abundance , the uncertainty was calculated from the individual uncertainties on the amounts and abundances of the deployed xenon batches. The uncertainty on the exposure accounts for the uncertainty in the determination of the fiducial volume due to the limited spatial resolution. Regarding the peak position and width , we included the uncertainties derived from the fits to the energy calibration and resolution. In addition, we added systematic uncertainties of 0.2% and 3% for the peak position and energy resolution, respectively, which were determined from the RELAX calculation. Uniform priors were chosen for the remaining free parameters of the fit, , and . All fit parameters were constrained to physically allowed positive values. The significance of a possible signal was evaluated by calculating the Bayes Factor Robert E. Kass (1995)
| (8) |
where is the posterior probability of the model and is the data.
| Parameter | Value |
|---|---|
| acceptance | |
| abundance | |
| exposure | kgd |
| peak position | keV |
| peak width | keV |
IV Results
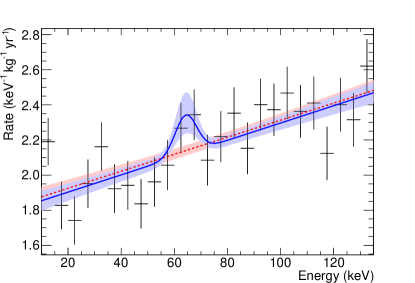
The best fits to the spectrum with and are shown in Fig. 2 and the obtained values can be found in Tab. 3. The p-values of the “signal+background” and “background-only” fit, calculated as described in Ref. Beaujean et al. (2011), are 0.92 and 0.89, respectively. These values show that the data is well described by both fit models. Since the Bayes Factor is
| (9) |
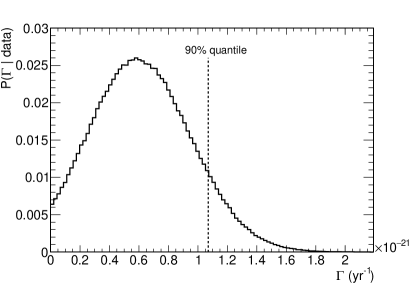
and thus favors the “background-only” model, we calculate a lower limit on the half-life. The 90% credibility limit on the decay rate is defined as the 90% quantile of the marginalized posterior probability distribution shown in Fig. 3. This leads to a 90% credibility limit on the half-life of
| (10) |
The influence of the nuisance parameters on the limit was evaluated by fixing all parameters shown in Table 2 to their mean values, which weakens the limit by 0.5%. While the binning has only a moderate influence (), decreasing the fit range can worsen the half-life limit by up to a factor of . The latter comes from the anti-correlation of the parameters and in Eq. (5). We have checked our result with the Feldman-Cousins procedure Feldman and Cousins (1998) using the approach of a simple counting experiment with known background. The number of observed events was derived from the region of the expected 22K peak, while the number of background events was calculated from the regions left and right of the peak. This gives a lower half-life limit of yr (90% confidence level) which confirms the result of the full Bayesian analysis.
| Parameter fsig | Value |
|---|---|
| decay rate | d-1 |
| acceptance | |
| abundance | |
| exposure | kgd |
| peak position | keV |
| peak width | keV |
| background slope | keV-1 |
| background constant | |
| Parameter fbkg | Value |
| background slope | keV-1 |
| background constant |
A comparison of the current experimental half-life limits is shown in Table 4. Since our analysis is more accurate it supersedes the previous limit given in Ref. Mei et al. (2014) which made use of the publicly available XENON100 data. The larger mass of the XMASS experiment (835 kg) results in better self-shielding capabilities and consequently a lower background, and thus makes the experiment more sensitive to 22K.
| Reference | ( yr) |
|---|---|
| Abe et al. (XMASS) Abe et al. (2016) | |
| Gavrilyuk et al. Gavrilyuk et al. (2015a) | |
| Mei et al. Mei et al. (2014) | |
| this work |
The successor of XENON100, the XENON1T experiment Aprile et al. (2016), is based on the same detector technology but with an increased total target mass of 2 t and a reduced background. It is currently in the commissioning phase. The sensitivity of XENON1T for 22K of 124Xe was investigated using the expected background spectrum in a 1 t fiducial volume Aprile et al. (2016). We assumed the same energy resolution as in XENON100. This assumption is conservative as the energy resolution is related to the light yield, which is expected to be about a factor of two higher in XENON1T Aprile et al. (2016). We used the Bayesian approach for a simple counting experiment with known background to estimate the sensitivity on the half-life in XENON1T. The likelihood is defined as
| (11) |
where is the expected number of counts in the region around the 22K peak, and is the number of signal counts. The first is a function of live-time with an expected value of 4.82 counts per day. For the latter a uniform prior was chosen. The limit on the half-life was calculated as
| (12) |
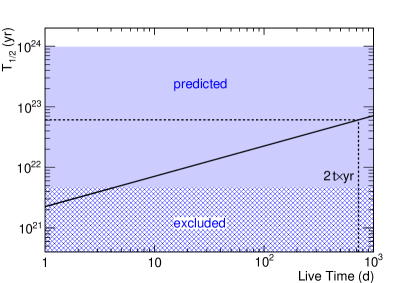
where is the natural abundance of 124Xe and is the 90% quantile of the posterior distribution for . The 90% credibility limit on the half-life as a function of measurement time is shown in Fig. 4 for a 1 t fiducial target. With only five live days of XENON1T, we expect to reach a sensitivity exceeding the current best experimental limit. With an exposure of 2 tyr we expect to reach a half-life limit of yr.
V Conclusions
We have conducted a search for 22K of 124Xe using 7636 kgd of XENON100 data. No significant signal was observed leading to a lower 90% credibility limit on the half-life of yr. This result supersedes the previous limit of yr Mei et al. (2014) from an external analysis of published XENON100 data. We have shown that the XENON1T experiment is expected to probe half-lives up to a value of yr after an exposure of 2 tyr. Since the XENON1T detector was also designed to measure higher energy signals more accurately than XENON100 it offers the possibility to study neutrinoless double electron capture as well as electron capture with positron emission or double positron decay where the main part of the observable energy is above 1 MeV Barros et al. (2014). Moreover, future multi-ton target experiments such as XMASS-II Abe et al. (2016), LZ Mei et al. (2014), XENONnT Aprile et al. (2016) and DARWIN Darwin16 will have the sensitivity to investigate the parameter space even further.
Acknowledgments
We thank Dieter Frekers and Jouni Suhonen for useful discussion. We gratefully acknowledge support from: the National Science Foundation, Swiss National Science Foundation, Deutsche Forschungsgemeinschaft, Max Planck Gesellschaft, Foundation for Fundamental Research on Matter, Weizmann Institute of Science, I-CORE, Initial Training Network Invisibles (Marie Curie Actions, PITNGA-2011-289442), Fundacao para a Ciencia e a Tecnologia, Region des Pays de la Loire, Knut and Alice Wallenberg Foundation, and Istituto Nazionale di Fisica Nucleare. We are grateful to Laboratori Nazionali del Gran Sasso for hosting and supporting the XENON project.
References
- Sujkowski and Wycech (2004) Z. Sujkowski and S. Wycech, Phys. Rev. C 70, 052501 (2004).
- Krivoruchenko et al. (2011) M. I. Krivoruchenko, F. Simkovic, D. Frekers, and A. Faessler, Nucl. Phys. A 859, 140 (2011).
- Suhonen (2013a) J. Suhonen, Rom. J. Phys. 58, 1232 (2013a).
- Maalampi and Suhonen (2013) J. Maalampi and J. Suhonen, Adv. High Energy Phys. 2013, 505874 (2013).
- Rodríguez and Martínez-Pinedo (2012) T. R. Rodríguez and G. Martínez-Pinedo, Phys. Rev. C 85, 044310 (2012).
- Kotila et al. (2014) J. Kotila, J. Barea, and F. Iachello, Phys. Rev. C 89, 064319 (2014).
- Povinec et al. (2015) P. P. Povinec, D. Frekers, and F. S̆imkovic, Proceedings, Matrix Elements for the Double-beta-decay EXperiments (MEDEX’15), AIP Conf. Proc. 1686, 020018 (2015).
- Meshik et al. (2001) A. P. Meshik, C. M. Hohenberg, O. V. Pravdivtseva, and Y. S. Kapusta, Phys. Rev. C 64, 035205 (2001).
- Pujol et al. (2009) M. Pujol, B. Marty, P. Burnard, and P. Philippot, Geochim. Cosmochim. Acta 73, 6834 (2009).
- Gavrilyuk et al. (2013) Y. M. Gavrilyuk, A. M. Gangapshev, V. V. Kazalov, V. V. Kuzminov, S. I. Panasenko, and S. S. Ratkevich, Phys. Rev. C 87, 035501 (2013).
- Wang et al. (2012) M. Wang, G. Audi, A. Wapstra, F. Kondev, M. MacCormick, X. Xu, and B. Pfeiffer, Chin. Phys. C 36, 1603 (2012).
- Berglund and Wieser (2011) M. Berglund and M. E. Wieser, Pure Appl. Chem. 83, 397 (2011).
- Bernabeu et al. (1983) J. Bernabeu, A. De Rujula, and C. Jarlskog, Nucl. Phys. B 223, 15 (1983).
- Gavrilyuk et al. (2015a) Yu. M. Gavrilyuk, A. M. Gangapshev, V. V. Kazalov, V. V. Kuzminov, S. I. Panasenko, S. S. Ratkevich, D. A. Tekueva, and S. P. Yakimenko, in 2nd International Workshop on Prospects of Particle Physics: Neutrino Physics and Astrophysics Valday, Russia, February 1-8, 2015 (2015).
- Hirsch et al. (1994) M. Hirsch, K. Muto, T. Oda, and H. V. Klapdor-Kleingrothaus, Z. Phys. A 347, 151 (1994).
- Aunola and Suhonen (1996) M. Aunola and J. Suhonen, Nucl. Phys. A 602, 133 (1996).
- Rumyantsev and Urin (1998) O. A. Rumyantsev and M. H. Urin, Phys. Lett. B 443, 51 (1998).
- Suhonen (2013b) J. Suhonen, J. Phys. G 40, 075102 (2013b).
- Singh et al. (2007) S. Singh, R. Chandra, P. K. Rath, P. K. Raina, and J. G. Hirsch, Eur. Phys. J. A 33, 375 (2007).
- Shukla et al. (2007) A. Shukla, P. K. Raina, and P. K. Rath, J. Phys. G 33, 549 (2007).
- Gavrilyuk et al. (2015b) Yu. M. Gavrilyuk, A. M. Gangapshev, V. V. Kazalov, V. V. Kuzminov, S. I. Panasenko, S. S. Ratkevich, D. A. Tekueva, and S. P. Yakimenko, Phys. Atom. Nucl. 78, 1563 (2015b), [Yad. Fiz.5,935(2014)].
- Mei et al. (2014) D. M. Mei, I. Marshall, W. Z. Wei, and C. Zhang, Phys. Rev. C 89, 014608 (2014).
- Abe et al. (2016) K. Abe et al. (XMASS), Phys. Lett. B 759, 64 (2016).
- Aprile et al. (2012a) E. Aprile et al. (XENON100), Phys. Rev. Lett. 109, 181301 (2012a).
- Aprile et al. (2012b) E. Aprile et al. (XENON100), Astropart. Phys. 35, 573 (2012b).
- Aprile et al. (2013) E. Aprile et al. (XENON100), Phys. Rev. Lett. 111, 021301 (2013).
- Aprile et al. (2014a) E. Aprile et al. (XENON100), Phys. Rev. D 90, 062009 (2014a).
- Aprile et al. (2015a) E. Aprile et al. (XENON Collaboration), Phys. Rev. Lett. 115, 091302 (2015a).
- Aprile et al. (2015b) E. Aprile et al. (XENON100), Science 349, 851 (2015b).
- Aprile et al. (2007) E. Aprile, K. L. Giboni, P. Majewski, K. Ni, and M. Yamashita, Phys. Rev. B 76, 014115 (2007).
- Szydagis et al. (2011) M. Szydagis, N. Barry, K. Kazkaz, J. Mock, D. Stolp, M. Sweany, M. Tripathi, S. Uvarov, N. Walsh, and M. Woods, JINST 6, P10002 (2011).
- Aprile et al. (2014b) E. Aprile et al. (XENON100), Astropart. Phys. 54, 11 (2014b).
- Aprile et al. (2011) E. Aprile et al. (XENON100), Phys. Rev. D 83, 082001 (2011), [Erratum: Phys. Rev.D85,029904(2012)].
- (34) D. Cullen, Program RELAX: A code designed to calculate atomic relaxation spectra of x-rays and electrons, Tech. Rep. UCRL-ID–110438 (Lawrence Livermore National Laboratory, CA (United States)).
- Thompson and Vaughan (2001) A. C. Thompson and D. Vaughan, eds., X-ray Data Booklet, 2nd ed. (Lawrence Berkeley National Laboratory, University of California, 2001).
- Nesterenko et al. (2012) D. A. Nesterenko et al., Phys. Rev. C 86, 044313 (2012).
- Caldwell et al. (2009) A. Caldwell, D. Kollar, and K. Kroninger, Comput. Phys. Commun. 180, 2197 (2009).
- Robert E. Kass (1995) A. E. R. Robert E. Kass, Journal of the American Statistical Association 90, 773 (1995).
- Beaujean et al. (2011) F. Beaujean, A. Caldwell, D. Kollár, and K. Kröninger, Phys. Rev. D 83, 012004 (2011).
- Feldman and Cousins (1998) G. J. Feldman and R. D. Cousins, Phys. Rev. D 57, 3873 (1998).
- Aprile et al. (2016) E. Aprile et al. (XENON), JCAP 1604, 027 (2016).
- Barros et al. (2014) N. Barros, J. Thurn, and K. Zuber, J. Phys. G 41, 115105 (2014).