On the Relationship of UC H II Regions and Class II Methanol Masers: I. Source Catalogs
Abstract
We conducted VLA C-configuration observations to measure positions and luminosities of Galactic Class II 6.7 GHz methanol masers and their associated ultra-compact H II regions. The spectral resolution was 3.90625 kHz and the continuum sensitivity reached 45 Jy beam-1. We mapped 372 methanol masers with peak flux densities of more than 2 Jy selected from the literature, 367 of them were detected. Absolute positions have nominal uncertainties of 0.3″. In this first paper on the data analysis, we present three catalogs, the first gives information on the strongest feature of 367 methanol maser sources, and the second on all detected maser spots. The third catalog present derived data of the 279 radio continuum sources found in the vicinity of maser sources. Among them, 140 show evidence of physical association with maser sources. Our catalogs list properties including distance, flux density, radial velocity and the distribution of masers on the Galactic plane is then provided as well. We found no significant relationship between luminosities of masers and their associated radio continuum counterparts.
1 Introduction
Although massive stars make up only a few percent of the stellar population in the Milky Way, they play a central role in many astrophysical processes, such as shaping the interstellar medium, regulating star formation and ultimately governing the evolution of their host galaxy (Kennicutt, 2005). However, to date, understanding massive star formation remains a challenge, because of numerous observational problem. Nevertheless, investigations of the natal environment of massive stars provide rich clues for a better understanding of its physical and chemical properties and the star formation process itself.
Massive star forming regions (MSFRs) offer a variety of tracers that can be detected in different wavebands, including massive dense cores (Zinnecker & Yorke, 2007), infrared dark clouds (Kauffmann & Pillai, 2010), mid-infrared sources (Purcell et al., 2013), Extended Green Objects (EGOs, Cyganowski et al., 2008), molecular outflows (Beuther et al., 2002), masers (most common species are hydroxyl, methanol and water; Farmer, 2014), compact and ultra-compact (UC) H II regions (Churchwell, 2002) and others. Understanding what these signposts tell us may help to construct an evolutionary sequence for young massive stars.
Methanol masers at 6.7 GHz were discovered by Menten (1991); they, along with 22.2 GHz H2O masers, are the brightest and most widespread maser species in massive star forming regions (e.g. Caswell et al., 1995; Minier et al., 2003; Xu et al., 2008). These masers may be one of the earliest and ubiquitous tracers of the massive star formation process (Urquhart et al., 2015). Most 6.7 GHz methanol masers have been observed with a variety of telescopes and with differing resolutions. For example, Pandian et al. (2011) observed 57 methanol masers at 6.7 GHz with the Multi-Element Radio-Linked Interferometer Network (MERLIN) with an angular resolution of 60 mas. At this resolution they found a close correspondence between the masers and mid-infrared sources and claimed their results to support the theoretical model that these masers are pumped by infrared dust emission in the vicinity of massive proto-stars.
Compact and ultra-compact (UC) H II regions are clear indicators of sites of massive stars (Hoare, 2005), whose ionizing photons are provided by embedded OB stars in the later stages of massive star formation (Churchwell, 2002). The thermal bremstahlung radiation from the ionized gas makes H II regions directly observable in radio continuum bands. In recent decades, a number of radio survey have identified many hundreds of UC H II regions. For example, Urquhart et al. (2009) observed 659 MSFR candidates with the VLA at 4.9 GHz and an angular resolution of 1.5”, achieving RMS noise levels of mJy beam-1 and detected 391 compact or UC H II regions. Many observations (e.g. Caswell, 2009; Caswell & Breen, 2010; Sanna et al., 2010) have established an association of these H II regions with 6.7 GHz methanol masers. Since compact and UC H II regions present a reliable snapshot of MSFRs withing the last years (Davies et al., 2011; Mottram et al., 2011), a census on this later phase of MSFRs can help us to better understand the evolutionary sequence of massive star formation and their association with different tracers.
In order to study the relationship of 6.7 GHz methanol masers to compact and UC H II regions, we conducted a large survey to simultaneously observe the methanol maser line and C-band continuum emission with the Karl G. Jansky Very Large Array (VLA) in its C-configuration. We mapped 372 class II methanol maser sources at 6.7 GHz, selected from literature with peak fluxes Jy. Absolute positions were established based on phase-referenced observations to astrometric calibrators. Our observations also served as precursor observations for the Bar and Spiral Structure Legacy (BeSSeL) Survey (Brunthaler et al., 2011) to provide high accuracy position of maser sources necessary for VLBA observations.
Our uniform and high angular resolution survey includes the vast majority of known 6.7 GHz methanol masers and their nearby compact or UC H II regions. The survey produced three catalogs: (1) a methanol maser catalog containing accurate positions, radial velocities and flux densities of the brightest spots; (2) a catalog of maser spectra and spot maps; (3) a catalog of H II regions toward the methanol masers.
Compact H II (referring to both compact and UC H II) regions and methanol masers offer a unique opportunity to peer into the deep interior of massive star forming regions at high angular resolution since at centimeter wavelength their natal clouds are optically thin, and the large database should allow statistically meaningful estimates of many characteristics of 6.7 GHz methanol masers and identified H II region counterparts. In combination with other signposts of massive star formations, the catalogs may provide important clues to solve several key issues related to massive star formation, such as whether 6.7 GHz methanol masers are located in accretion disks or in outflow walls (or both), when in the process of star formation these two signposts occur, how MSFRs evolve with time. Some prominent class II methanol masers are found in the dense molecular material associated UC H II regions, W3OH and NGC 7538 being prominent examples (Menten et al., 1988). However, most have no radio continuum emission at the, say, few mJy level, that could be easily detected with the original VLA or the ATCA (e.g. Walsh et al., 1998; Minier et al., 2001). This leaves open the question of whether weaker radio emission could be associated with masers at the level that could be expected from younger, hyper compact H II regions.
In Section 2 we describe the sample and the design of the observations. The data analysis is described in Section 3. The three catalogs mentioned above are presented in Section 4. In Section 5, statistical properties of the 6.7 GHz methanol masers and their associated compact H II regions are discussed. A brief summary is given in Section 6. This paper is the first of a series investigating massive star formation and its evolutionary sequence.
2 Observation Design
2.1 Sample
We selected our sample of 6.7 GHz methanol masers based on the following criteria:
-
1.
Sources should have declination higher than to ensure the visibility from VLA site.
-
2.
Since subsequent VLBA observations for the BeSSeL Survey require high SNR for parallax measurements, we required a peak flux density greater than 2 Jy.
Taking these constraints into account, 372 unique targets were selected from the following methanol maser surveys: the Methanol Multi-Beam catalog (MMB) (Caswell & Breen, 2010; Green et al., 2010, 2012), Arecibo Methanol Maser Galactic Plane Survey (AMGPS) (Pandian et al., 2011), the Torun catalog of 6.7 GHz methanol masers (Szymczak et al., 2012), and other individual observations of known 6.7 GHz methanol masers or massive star forming regions (Caswell et al., 1995; Walsh et al., 1997, 1998; Caswell, 2009; Xu et al., 2008). Green et al. (2009) state that the MMB survey is complete to 80% at 0.8 Jy and % at 1 Jy. At the time we started our observation, MMB had published sources in Galactic longitude range from 186° to 20° , and Galactic latitude range from -2° to 2°. However, most of the MMB Survey covers the Southern Galactic plane and is not visible to the VLA. Our observations included MMB sources in Galactic longitude range from 357° to 20°. With a flux cutoff at 2 Jy, we believe the sample in this area is complete. The AMGPS methanol maser survey uniformly sampled from 35.2° 53.7° with 0.41° and was complete to 0.27 Jy (Pandian et al., 2007). Thus, our catalog is also complete to 2 Jy in the AMGPS area. The completeness of the Torun catalog varies from Galactic longitude, however, Szymczak et al. (2012) conclude that all maser sources brighter than 7.5 Jy in the peak were included. So our survey is not complete to 2 Jy for these sources, nor from sources that were from targeted observation towards individual objects. Most of the masers are located in the first and second quadrant of the Galactic plane.
2.2 Observation Design
The observations were conducted with the VLA in C-configuration using five sessions from 2012 February 28th to April 16th. At the beginning of each observation, a primary flux calibrator111Calibrators used are 3C147, 3C286 and 3C48. Their assumed flux densities are determined by the radio flux calibrators model files delivered with the Common Astronomy Software Applications (CASA). was observed to establish amplitude calibration, followed by observation alternating between phase calibrator and target sources.
We adopted complex gain calibrators from the catalogs of Immer et al. (2011) and the first realization of the International Celestial Reference Frame (ICRF1, Ma, 1997). Phase calibrators were chosen to be within 5° of the targets and were observed at the beginning and end of each block. So a typical cycle consists of a scan of phase calibrator, followed by a group of snapshots of nearby targets, then a revisit of the phase calibrator.
Spectral line data used 2048 channels across 8 MHz, yielding channel spacing of 3.90625 kHz at the central frequency of 6.6685192 GHz, yielding velocity resolution of 0.176 km s-1. The continuum observations employed two 1 GHz sub-bands from 4.9840 GHz to 6.0080 GHz (hereafter, the low band) and from 6.6245 GHz to 7.6485 GHz (hereafter, the high band) and each sub-band was divided in to 16 channels. Snapshot observations of the maser sources achieved about 20 seconds on-source and reached typical noise levels of 45 Jy beam-1 for the continuum maps and 33 mJy beam-1 per channel for the spectral line maps. Technical details of the observations are given in Table 1.
| Dates of observations | 2012 Feb. 28 |
|---|---|
| 2012 Mar. 04 | |
| 2012 Mar. 07 | |
| 2012 Mar. 18 | |
| 2012 Apr. 16 | |
| Configuration | C-configuration |
| Antennae | 27 |
| Digital Sampler | 8-bits |
| Average On Source Time | 20 s |
| Synthesized Beam | |
| field of view | |
| Frequency Coverage | Line: 6664.5 to 6672.5 MHz |
| Cont.: 4984.0 to 6008.0 MHz | |
| and 6.6245 to 7.6485 MHz |
3 Data Reduction
3.1 Methanol Maser Line
Maser data were calibrated through a standard spectral-line data reduction procedure in Astronomical Image Processing System (AIPS). In brief, we first flagged suspicious identified entries by eye, then determined the flux density scale based on the primary flux calibrators. Complex gains of secondary calibrators were then calculated and interpolated to the maser sources. We extracted a scalar averaged spectrum from the visibility data of each target in order to find the peak emission channel. Then we made an image from that channel’s data covering on the sky, and a detection was confirmed by requiring the peak brightness to exceed five times the RMS noise level of the image. We then generated a spectroscopic image cube with typical CLEAN restoring beam size of . The positions of the maser spots were derived from these cubes..
In a small number of cases (33), we failed to detect maser emission, in spite of the fact that maser sources were reported there in the literature. Positions for the centers of these fields are given in Table 2. In all case we made maps of 55 arc min, we suspect that many of these non-detection results from previous catalogs having identified telescope side-lobes from a strong source at a position far removed from the true source. However, for some of the weaker sources, it is possible that time variability could explain our lack of detection ( i.e. about 170 mJy). Repeated observations with longer integration might reveal if variability explains out non-detections.
| Source Name | R.A. | Dec. | Reference |
|---|---|---|---|
| (hh:mm:ss.sss) | (ddd:mm:ss.sss) | ||
| G000.690.04 | 17:47:24.74 | 28:21:43.6 | C10 |
| G000.710.03 | 17:47:25 | 28:21:00 | W97 |
| G002.620.14 | 17:51:12 | 26:37:00 | W97 |
| G010.000.03 | 18:07:52 | 20:18:00 | W97 |
| G010.200.35 | 18:09:28.43 | 20:16:42.5 | G10 |
| G012.860.27 | 18:14:36.42 | 17:54:50.2 | S14 |
| G016.600.04 | 18:21:09 | 14:31:00 | W97 |
| G016.882.15 | 18:29:25 | 15:15:00 | W97 |
| G018.670.03 | 18:24:53.78 | 12:39:20.40 | G10 |
| G019.370.02 | 18:26:24 | 12:03:00 | W97 |
| G023.090.39 | 18:34:45.71 | 08:55:55.2 | S14 |
| G023.450.18 | 18:34:39 | 08:31:00 | W97 |
| G023.460.16 | 18:34:35.95 | 08:29:32.1 | S14 |
| G023.710.19 | 18:35:11 | 08:17:00 | W97 |
| G025.230.29 | 18:36:17.10 | 06:43:11.8 | S14 |
| G025.661.06 | 18:34:20 | 05:59:00 | W97 |
| G025.700.03 | 18:38:05 | 06:25:00 | W97 |
| G025.790.14 | 18:38:52 | 06:25:00 | W97 |
| G025.800.16 | 18:38:56.40 | 06:24:52.7 | SZ12 |
| G025.810.04 | 18:38:32.02 | 06:21:28.6 | S14 |
| G027.560.08 | 18:41:20.26 | 04:44:25.0 | S14 |
| G028.310.37 | 18:44:19 | 04:17:00 | W97 |
| G029.910.05 | 18:46:05.9 | 02:42:27 | X08 |
| G030.520.10 | 18:46:41.37 | 02:06:07.6 | SZ12 |
| G030.790.20 | 18:46:48 | 01:48:46 | W98 |
| G030.820.27 | 18:46:37 | 01:45:00 | W97 |
| G031.280.07 | 18:48:10.02 | 01:26:31.6 | SZ12 |
| G031.420.32 | 18:47:33 | 01:12:00 | W97 |
| G032.770.06 | 18:51:21.60 | 00:10:04.9 | S14 |
| G049.270.34 | 19:23:06.95 | 14:20:10.9 | S14 |
| G049.670.46 | 19:24:19.60 | 14:38:03.9 | SZ12 |
| G189.770.34 | 06:08:32.40 | 20:39:25.3 | SZ12 |
| G358.390.48 | 17:43:37.83 | 30:33:51.1 | C10 |
Note. — Source names and coordinations are taken directly from the references. J2000 coordination are presented in sexagesimal in corresponding units. Accuracy of the coordination varies by different references. Fluxes are the peak values that taken directly from the references. Reference abbreviations are: C10 (Caswell & Breen, 2010); G10 (Green et al., 2010); S14 (Sun et al., 2014); SZ12 (Szymczak et al., 2012); W97 (Walsh et al., 1997); X09 (Xu et al., 2009).
We improved the calibration of the maser sources, using the brightest maser spot to self-calibrate phase and amplitude and then applying these corrections to all channels. For a maser spot with peak flux density 3 Jy, self calibration improved the dynamic range of the maser image cube. To extract maser spots from image cubes, we ran the SAD task on each channel, with a dynamic range cutoff at 10% of the image peak. In some cases, more than one maser source appeared in a field. When the separations exceeded , we labeled them as separate maser sources. The spectrum for each maser source was generated from the SAD output results and has a velocity resolution of 0.176 km s-1.
3.2 Continuum
We processed the continuum data using the Common Astronomy Software Applications (CASA). Our calibration procedure can be summarized as follows: after inspecting and flagging the data set, the flux density scale was set to the primary calibrator; bandpass and antenna based delays were then calculated for the primary calibrator and applied to the secondary calibrators and targets; we then finish the calibration by interpolating the amplitude and phase correction from secondary calibrators to targets; and after some additional flagging, images were produced with pixel size of 0.3″. Most continuum images are of pixels, for some cases larger images are produced to include nearby by strong sources to suppress the interference from them. Since there is considerable radio frequency interference at C-band at the VLA site, we had to manually flag a considerable amount of data. In some cases this significantly increased the noise level in the final image. In addition, the flagging, together with snapshot observing, produced limited (u,v)-coverage, which led to large side-lobes in the final images, especially for sources at low Declination.
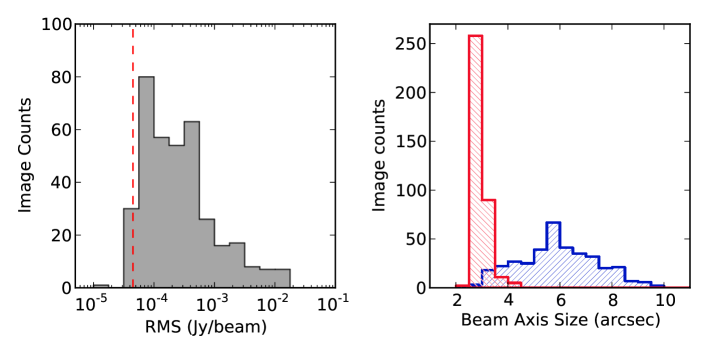
The final maps were made with the CLEAN task in CASA, using the “multi-frequency synthesis” algorithm. Three maps were produced for each source, including those derived separately for the low- and high-band data and a combined map. We excluded channels near the 6.7 GHz maser line when making these maps. Typical noise levels for the combined map were 50 Jy beam-1. The left panel of Figure 1 shows the distribution of RMS noise levels for the combined maps. The peak of the histogram is comparable to the theoretical noise level (45 Jy beam-1) for our observations as calculated by the VLA Exposure Calculator222https://obs.vla.nrao.edu/ect/. For maps that have much greater noise than expected, most were affected by side-lobes of nearby strong sources and complications from strong diffuse background emission.
In order to extract positions of radio continuum sources in the fields, we used the SExtractor algorithm (Bertin & Arnouts, 1996) to automatically find and measure compact radio sources. Although, SExtractor was developed for source extraction in visible or infrared images, it has been already successfully used for radio sources in the past (Thompson et al., 2006; Contreras et al., 2013; Urquhart et al., 2015). The continuum sources identified by SExtractor were filtered before inclusion in our catalog. We required the peak flux to be above of the RMS noise of the integrated map, or above on each of the 3 images (i.e., the integrated image, the high-band image, and low-band image). Under these constraints, 349 continuum sources were identified. For the interest of investigation of maser to continuum source associations, we adopted only continuum source with the smallest angular offset to the strongest maser spot in each maser source, if multiple continuum sources appear in the same field. After all 279 sources are adopted, making up the continuum source catalog.
4 Survey Products
4.1 VLA 6.7 GHz Methanol Maser Catalog
Our VLA 6.7 GHz methanol maser catalog in Table 3 includes 367 methanol maser sources, sorted by Galactic longitude, with accurate J2000 coordinates, peak () and integrated flux () flux densities, LSR velocities () for the strongest spots, the velocity ranges of masers (), and the estimated heliocentric distance and its probability (see Section 5.2 for details). The LSR velocity, and peak and integrated flux densities were estimated by fitting two-dimensional Gaussian brightness distributions of the reference spot.
Positions of the brightest, compact maser spots were determined by phase calibrator observations prior to any self-calibration. The formal precision in determining position is directly proportional to the synthesized beam size and inversely to the signal-to-noise ratio (SNR) (see Reid et al., 1988, Equation 1). For the typical beam size (E-W), (N-S) and SNR value of 50, in our observation, the position precision is mas in the E-W direction and mas in the N-S direction. Thus we list the right ascension of maser spots to 3 decimals in second, and declination to 2 decimals in arc second in the catalog. We’ve taken these values as the formal precision of maser spots position. However, uncompensated atmospheric delays likely make the random error much smaller than the systematic error. Based on experience with snap-shot imaging of OH masers by Argon et al. (2000) and a comparison with maser positions determined from VLBI observation (see Section 5.1 for details), we adopt a realistic total position accuracy which is .
| Source name | R.A. | Dec. | Distance | Prob. | Code | ||||
|---|---|---|---|---|---|---|---|---|---|
| (hh:mm:ss.sss) | (dd:mm:ss.ss) | (km s-1) | (km s-1) | (Jy beam-1) | (Jy) | (kpc) | |||
| G000.5460.851 | 17:50:14.523 | 28:54:31.25 | 15.06 | 8.95 | 90.75 | 1091.44 | 2.70.3 | 0.59 | A |
| G000.6440.042 | 17:47:18.663 | 28:24:24.82 | 49.95 | 6.67 | 55.06 | 497.05 | 10.80.2 | 0.54 | B |
| G000.6470.055 | 17:47:22.052 | 28:24:42.53 | 51.17 | 1.05 | 3.95 | 16.19 | 10.80.2 | 0.58 | B |
| G000.6510.048 | 17:47:21.125 | 28:24:18.12 | 47.92 | 8.96 | 15.45 | 73.89 | 8.30.3 | 0.54 | N |
| G000.6560.040 | 17:47:20.062 | 28:23:46.65 | 52.42 | 5.62 | 6.47 | 35.99 | 10.80.2 | 0.63 | A |
Note. — This is a sample of the 6.7 GHz methanol maser catalog. Source names are based on the Galactic coordinates. J2000 coordinates are presented in sexagesimal terms. is the radial velocity of the strongest spot of the source. and are the peak and integrated fluxes. Distances with uncertainties are presented in kpc. The probabilities evaluate how likely the sources are located on the given distances. See Sec. 5.2 for details. In the last column, code indicates the association between maser source and the continuum emission. “A” means the associated continuum emission is detected and classified as group A, “B” means continuum emission is found in the vicinity of the maser but with no evidence supporting physical relationship between maser and continuum source. “N” represents the absence of continuum emission. Only 5 entries of the catalog are shown here. For the entire machine-readable catalog, please see online material.
4.2 Methanol Maser Spot Catalog
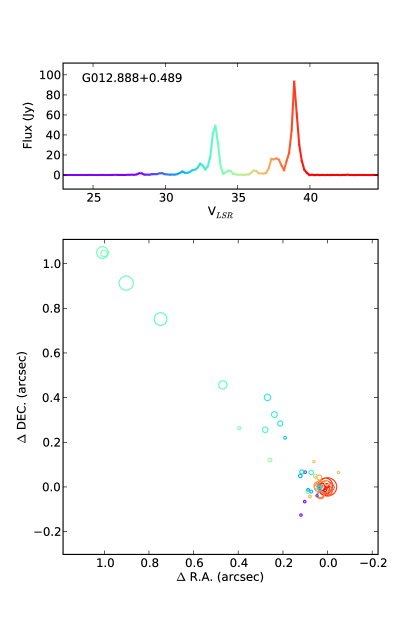
Maser spots extracted from line cubes constitute a second catalog. In order to facilitate the investigation in morphology and kinematics of individual maser source, we present maser spots arranged by the hosting maser source name in Table 4. In this spots catalog, columns in the catalog are maser source name, reference position of each source, LSR velocity, peak flux density, and the offsets of spot from the reference position with their uncertainty. The reference position are determined conventionally close to the strongest maser spot in each source, thus bear no actually physical meaning. One should also notice that, in the catalog the offsets of individual maser spot is provided uniformly by SAD task in AIPS, which are listed to 3 decimals in arc second. However as the SNR of the single channel image varies from channel to channel and source to source, such a presentation may not indicate the actual precision of individual measurement. The nominal precision of maser sources is mas in the E-W direction and mas in the N-S direction (See Section 4.1). From this catalog, we produced a spot map image and a spectrum for each maser source. See Figure 2 for an example. The full-size machine-readable spot catalog and images for 367 sources are available as online material.
| Name | Ref. R.A. | Ref. Dec. | Unc. | Unc. | ||||
|---|---|---|---|---|---|---|---|---|
| (hh:mm:ss.sss) | (dd:mm:ss.ss) | (km s-1) | (Jy beam-1) | (″) | (″) | (″) | (″) | |
| G012.888+0.489 | 18:11:51.392 | 17:31:30.40 | 38.91 | 93.21 | 0.035 | 0.001 | -0.80 | 0.001 |
| G012.888+0.489 | 18:11:51.392 | 17:31:30.40 | 39.08 | 61.47 | 0.045 | 0.001 | -0.80 | 0.002 |
| G012.888+0.489 | 18:11:51.392 | 17:31:30.40 | 33.46 | 55.85 | 0.937 | 0.001 | 0.104 | 0.002 |
| G012.888+0.489 | 18:11:51.392 | 17:31:30.40 | 33.29 | 44.61 | 0.783 | 0.001 | -0.05 | 0.002 |
| G012.888+0.489 | 18:11:51.392 | 17:31:30.40 | 38.73 | 44.40 | 0.042 | 0.001 | -0.81 | 0.002 |
| G012.888+0.489 | 18:11:51.392 | 17:31:30.40 | 33.64 | 38.48 | 1.043 | 0.001 | 0.241 | 0.002 |
| G012.888+0.489 | 18:11:51.392 | 17:31:30.40 | 39.26 | 29.89 | 0.048 | 0.001 | -0.82 | 0.002 |
| G012.888+0.489 | 18:11:51.392 | 17:31:30.40 | 38.56 | 21.94 | 0.033 | 0.001 | -0.82 | 0.003 |
| G012.888+0.489 | 18:11:51.392 | 17:31:30.40 | 33.11 | 18.65 | 0.504 | 0.002 | -0.35 | 0.004 |
| G012.888+0.489 | 18:11:51.392 | 17:31:30.40 | 37.68 | 16.56 | 0.077 | 0.001 | -0.81 | 0.004 |
| G012.888+0.489 | 18:11:51.392 | 17:31:30.40 | 37.33 | 15.86 | 0.079 | 0.002 | -0.80 | 0.004 |
| G012.888+0.489 | 18:11:51.392 | 17:31:30.40 | 37.50 | 15.64 | 0.070 | 0.002 | -0.79 | 0.004 |
| G012.888+0.489 | 18:11:51.392 | 17:31:30.40 | 37.85 | 15.23 | 0.066 | 0.002 | -0.84 | 0.004 |
| G012.888+0.489 | 18:11:51.392 | 17:31:30.40 | 39.44 | 14.13 | 0.057 | 0.002 | -0.80 | 0.004 |
| G012.888+0.489 | 18:11:51.392 | 17:31:30.40 | 38.38 | 13.71 | 0.021 | 0.002 | -0.81 | 0.004 |
| G012.888+0.489 | 18:11:51.392 | 17:31:30.40 | 33.82 | 11.67 | 1.036 | 0.002 | 0.237 | 0.005 |
| G012.888+0.489 | 18:11:51.392 | 17:31:30.40 | 32.41 | 11.33 | 0.304 | 0.002 | -0.40 | 0.005 |
| G012.888+0.489 | 18:11:51.392 | 17:31:30.40 | 38.03 | 9.62 | 0.066 | 0.002 | -0.84 | 0.006 |
| G012.888+0.489 | 18:11:51.392 | 17:31:30.40 | 32.59 | 9.32 | 0.273 | 0.003 | -0.48 | 0.006 |
| G012.888+0.489 | 18:11:51.392 | 17:31:30.40 | 32.94 | 8.50 | 0.314 | 0.003 | -0.55 | 0.006 |
| G012.888+0.489 | 18:11:51.392 | 17:31:30.40 | 32.24 | 7.24 | 0.247 | 0.003 | -0.52 | 0.007 |
| G012.888+0.489 | 18:11:51.392 | 17:31:30.40 | 37.15 | 6.79 | 0.072 | 0.003 | -0.76 | 0.008 |
| G012.888+0.489 | 18:11:51.392 | 17:31:30.40 | 32.76 | 5.54 | 0.108 | 0.004 | -0.74 | 0.009 |
| G012.888+0.489 | 18:11:51.392 | 17:31:30.40 | 32.06 | 5.33 | 0.070 | 0.004 | -0.81 | 0.009 |
| G012.888+0.489 | 18:11:51.392 | 17:31:30.40 | 39.61 | 5.21 | 0.038 | 0.004 | -0.80 | 0.010 |
| G012.888+0.489 | 18:11:51.392 | 17:31:30.40 | 31.88 | 4.83 | 0.150 | 0.004 | -0.74 | 0.010 |
| G012.888+0.489 | 18:11:51.392 | 17:31:30.40 | 38.21 | 4.83 | 0.026 | 0.005 | -0.83 | 0.011 |
| G012.888+0.489 | 18:11:51.392 | 17:31:30.40 | 36.10 | 4.41 | 0.039 | 0.005 | -0.79 | 0.011 |
| G012.888+0.489 | 18:11:51.392 | 17:31:30.40 | 34.34 | 4.34 | 0.123 | 0.005 | -0.83 | 0.011 |
| G012.888+0.489 | 18:11:51.392 | 17:31:30.40 | 36.27 | 4.04 | 0.089 | 0.006 | -0.76 | 0.013 |
| G012.888+0.489 | 18:11:51.392 | 17:31:30.40 | 34.52 | 3.98 | 0.293 | 0.006 | -0.68 | 0.013 |
| G012.888+0.489 | 18:11:51.392 | 17:31:30.40 | 31.18 | 3.46 | 0.157 | 0.006 | -0.76 | 0.015 |
| G012.888+0.489 | 18:11:51.392 | 17:31:30.40 | 31.71 | 3.19 | 0.072 | 0.006 | -0.80 | 0.014 |
| G012.888+0.489 | 18:11:51.392 | 17:31:30.40 | 34.17 | 2.52 | 0.430 | 0.008 | -0.54 | 0.020 |
| G012.888+0.489 | 18:11:51.392 | 17:31:30.40 | 39.79 | 2.24 | 0.046 | 0.009 | -0.82 | 0.021 |
| G012.888+0.489 | 18:11:51.392 | 17:31:30.40 | 31.36 | 2.20 | 0.108 | 0.009 | -0.83 | 0.022 |
| G012.888+0.489 | 18:11:51.392 | 17:31:30.40 | 31.53 | 2.17 | 0.225 | 0.010 | -0.58 | 0.023 |
| G012.888+0.489 | 18:11:51.392 | 17:31:30.40 | 36.98 | 2.12 | 0.114 | 0.010 | -0.85 | 0.022 |
| G012.888+0.489 | 18:11:51.392 | 17:31:30.40 | 31.01 | 2.07 | 0.122 | 0.009 | -0.82 | 0.022 |
| G012.888+0.489 | 18:11:51.392 | 17:31:30.40 | 35.92 | 2.00 | 0.086 | 0.012 | -0.76 | 0.027 |
| G012.888+0.489 | 18:11:51.392 | 17:31:30.40 | 29.78 | 1.81 | 0.135 | 0.012 | -0.74 | 0.028 |
| G012.888+0.489 | 18:11:51.392 | 17:31:30.40 | 36.45 | 1.71 | -0.01 | 0.012 | -0.74 | 0.028 |
| G012.888+0.489 | 18:11:51.392 | 17:31:30.40 | 28.20 | 1.70 | 0.137 | 0.012 | -0.87 | 0.029 |
| G012.888+0.489 | 18:11:51.392 | 17:31:30.40 | 29.60 | 1.61 | 0.082 | 0.012 | -0.84 | 0.030 |
| G012.888+0.489 | 18:11:51.392 | 17:31:30.40 | 28.37 | 1.57 | 0.154 | 0.013 | -0.93 | 0.029 |
| G012.888+0.489 | 18:11:51.392 | 17:31:30.40 | 36.63 | 1.54 | 0.096 | 0.014 | -0.69 | 0.033 |
Note. — This table demonstrates the maser spots in source G012.888+0.489 as an example of the spot catalogs. The name of the source and the reference point are given in the first three columns. In the body of the table, each entry is representing one spot, given the order from brightest to faintest. Radial velocities and peak fluxes from Gaussian fitting result are given in the second and the third column. Column 6 to 9 are the offsets of the spot relative to the reference point in arc second. The full-size methanol maser spots catalog for all sources will be available in machine readable format via online material.
4.3 Continuum Catalog
A catalog of radio continuum sources nearest the masers is presented in Table 5, including the Galactic source name, J2000 coordinates of the peak emission, integrated flux densities, the ratio of integrated flux to peak pixel value, ellipse parameters describing source’s shape, the spatial offset between peak of the continuum source and the corresponding maser, the diameter of continuum source derived directly from the semi-major axis length, and a ”Group” code. The precision of continuum peak position comes from the similar deduction we have made for the maser spots. As the typical SNR value of continuum images is 10, the positional precisions on E-W and N-S direction are mas and mas. The integrated flux density () is derived from 2-D Gaussian fitting of the continuum brightness distribution profile. The ratio of integrated flux to peak pixel value provides a measure of the compactness of the source, which is useful for morphological analysis of the continuum sources. The ellipse parameters , and are the length of the major, minor axes and the positional angle counting East of North, respectively. Elliptical parameters are derived from the 2-D Gaussian fitting that deconvolved from the restoring beam, if the source is resolved on both major and minor axis directions, otherwise, parameters are of the 2-D Gaussian component that convolved with the restoring beam. We regard them as estimates of source’s angular size, and the parameter is used to calculate a spatial diameter using the heliocentric distance of the associated maser. However, our observations are lacking sufficient resolving power to measure the actual size of some extremely compact and distant sources. We indicate unresolved sources with a “” symbol when the formal fitted FWHM was smaller than the CLEAN restoring beam in any direction.
We divide continuum sources into two groups: Group A includes 140 continuum sources that are associated with a methanol maser, whereas 139 Group B sources have no associated maser sources. See Sec 5.3 for more detailed discussion on this issue.
| Source Name | R.A. | Dec. | P.A. | offset | diameter | Group | ||||
|---|---|---|---|---|---|---|---|---|---|---|
| (hh:mm:ss.ss) | (dd:mm:ss.s) | (mJy) | (″) | (″) | (° ) | (pc) | (pc) | |||
| G001.328+0.149 | 17:48:09.95 | -27:43:09.0 | 138.00 | 59.87 | 44.8 | 41.7 | 1.9 | 0.27 | 0.91 | A |
| G002.143+0.009 | 17:50:36.00 | -27:05:47.4 | 5.87 | 1.12 | 2.4 | 1.2 | 14.0 | 0.06 | 0.12 | A |
| G002.535+0.198 | 17:50:51.30 | -26:39:52.5 | 3.79 | 2.59 | 5.8 | 4.1 | 73.0 | 1.34 | 0.12 | B |
| G003.910+0.001 | 17:54:38.77 | -25:34:45.1 | 49.70 | 1.03 | 8.4 | 2.9 | 174.4 | 0.02 | 0.45 | A |
| G004.393+0.078 | 17:55:21.59 | -25:06:12.5 | 124.00 | 28.42 | 52.3 | 26.9 | 139.4 | 6.38 | 3.71 | B |
Note. — The names of the corresponding maser sources are listed in the first column. Given, from the second to fourth column are J2000 coordinates, the integrated flux of the entire continuum source and , the ratio of integrated flux to peak pixel value. The shape of the source is represented by elliptic parameters , and position angle. Offset indicates the displacement between peaks of maser and continuum sources in pc. Diameter column indicates the diameter of the continuum source derived from the major axis and the heliocentric distance of the associated maser. Notice that the values in this column with “” represent the upper limit of the physical diameter of the corresponding continuum source, due to our limited resolving power. The last column implies the association type of the continuum source. Here only 5 entries are given. The full catalog in machine-readable format is available via online material.
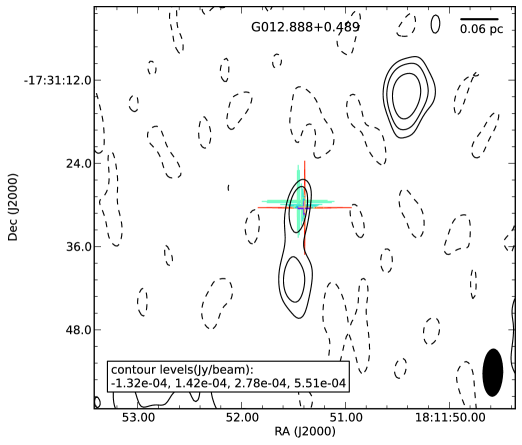
We overlaid the maser spots on the integrated continuum contour map to give a direct illustration of the positional relation of these two kinds of detections. These images can be found in the online material; one example is shown in Figure 3 in which the colored crosses are the maser spots and the black contours indicate the radio continuum emission.
5 Source Properties
5.1 Positions
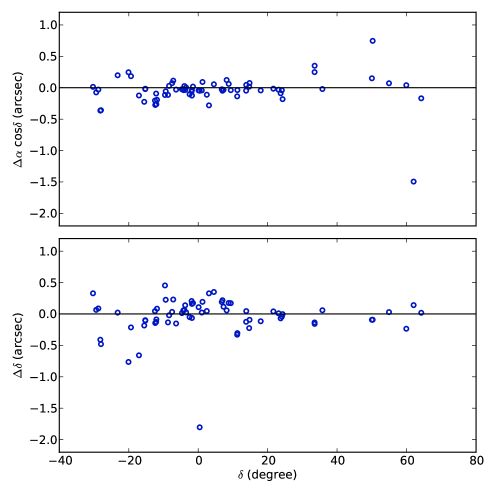
The absolute positions of masers come from the images without self-calibration. We estimate position uncertainty by comparing our result with the VLBI measurement form the first epoch result of BeSSeL Survey333http://bessel.vlbi-astrometry.org/first_epoch observed by VLBA and having better than 10 mas accuracy. Fig. 4 shows the differences between the sources in common to the two surveys, which we attribute to errors in the VLA data. In E-W direction, the RMS errors are about 0.23″, and in the N-S direction they are about 0.30″, and somewhat larger for . The positional uncertainty of masers is mainly limited by atmospheric irregularities that are only partially canceled by the small separation (°) between phase calibrators and targets.
5.2 Distance
Reid et al. (2014) have published a summary of the parallax measurements of masers that are hosted by Galactic MSFRs. For a total of 53 of our sources parallax measurements do exist. While, in principle kinematic distance can be calculated for sources in the Galactic plane, these can be very inaccurate in the general direction of the Galactic center and anti-center directions and within the Solar circle they are multi-valued, i.e., are affected by the “kinematic distance ambiguity”, KDA. In addition, kinematic distance estimates depend on the assumed Galactic rotation curve, as well as the assumption of circular Galactic orbits.
Reid et al. (2016) proposed an alternative approach that leverages VLBI parallax measurements of massive star forming regions from the BeSSeL Survey and the Japanese VERA project to significantly improve the accuracy and reliability of distance estimates to any source known to follow spiral structure. Their Bayesian approach considers the likelihood of a spiral arm assignment, the angular displacement from the Galactic plane, the proximity to individual sources with parallax measurements, as well as kinematic information to estimate a full distance probability density function for each source. Since this method not only synthesizes different approaches of distance determination, but also shows good agreement with results from the H I absorption method when resolving the KDA and can be applied to the full Galactic longitude range, we adopt it to estimate distances (and uncertainties) to the 367 methanol maser sources in our catalog, based on the radio velocity of the reference spot in each source. However, one should notice that the determination of the distances strongly depends on the spiral arm assignment. We simply take the association with the highest probability, so the distances of some sources may be more uncertain than what is claimed by the nominal uncertainty. In the methanol maser catalog the probability of the most likely arm assignment is given. We suggest that one should take special care when dealing with those low probability distances and their subsequent parameters, such as luminosities, spatial sizes, etc.
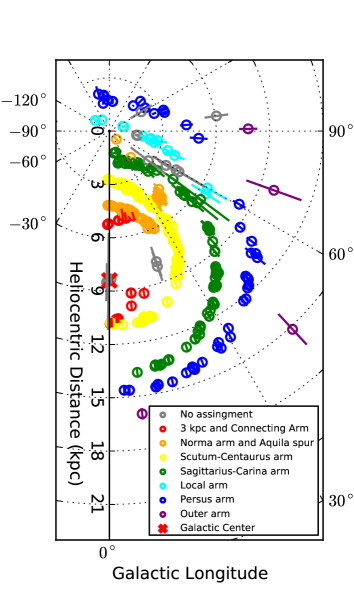
In Figure 5, we show the distribution of all maser sources projected on the Galactic plane. Note, however, that the spiral arm models used to partially constrain distances are assumed to be correct; the accuracy of these models is limited to regions where parallaxes have been measured (see Reid et al., 2016, for the details).
5.3 Association of Masers and Continuum sources
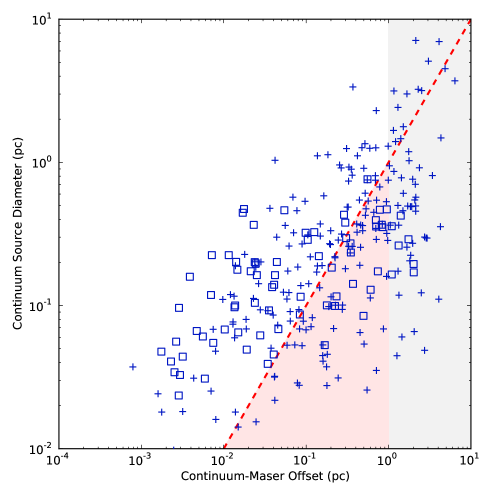
We establish an association between a maser and a continuum source based on their projected separations and the size of the continuum source. Since the two well accepted pumping mechanisms of the class II methanol maser are infrared radiation from the central YSO (Sobolev & Deguchi, 1994) and collision (Cragg et al., 2005), the continuum-associated class II methanol masers can only exist in the natal molecular cloud of the HC/UC H II region. Projected on the sky, the associated maser should appear within or in the vicinity of the area of the continuum source. Thus, we introduce two criteria on the projected spatial distance between peak positions of maser and continuum source when considering their association. First, since the median value of the radii of gas clumps hosting methanol masers is 0.97 pc (Urquhart et al., 2013), we assume the maser source is not physically associated with the continuum, if their projected offset is greater than 1 pc. Second, two objects are considered associated with each other only when the offset is smaller than the semi major axis of the continuum source. In Fig 6, we plot the continuum source diameter versus the offset to the maser reference spot. The gray area in the plot represents the offset larger than 1 pc, while the red dashed-line indicates that the continuum source diameter equals the projected offset to the maser. The markers in gray area are denoting the maser-continuum pairs that do not in the same molecular cloud, and the those in the pink area can be interpreted as the continuum source and the methanol maser trace different massive star formation sites in the same molecular cloud. In other words, maser-continuum pair in these two areas show no possibility of direct physical association. We refer sources in these two area as Group B. In total, 139 sources are found in this group. In contrast, we assign 140 continuum sources in the white area of the plot (i.e. offsets less than either 1 pc or the diameter of continuum source) as physically associated with their counterpart masers and refer to these as Group A. Here we provide a rather rough classification. A more comprehensive diagnose on the association is still in need in the following work, since the relationship of these two signposts will do great importance in the study of the evolutionary stages of HMSFRs.
5.4 Flux Relationship
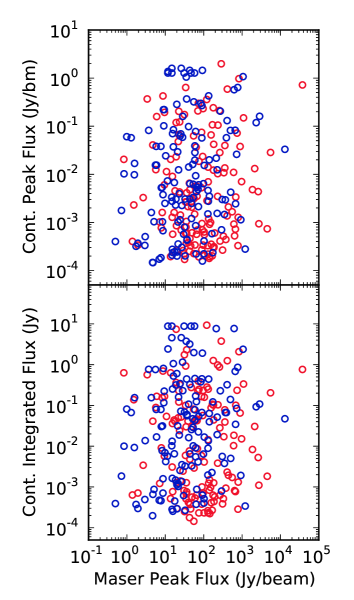
Fig 7 shows the plots of continuum source peak and integrated flux as function of maser peak flux. Within our sample, we found no obvious relationship between flux of methanol masers and continuum sources in both group A and group B. Thus we conclude that methanol maser luminosity is independent from the luminosity of the associated radio continuum source.
6 Summary
We report a survey toward a large sample of Galactic class II 6.7 GHz methanol masers and their C-band radio continuum counterparts. With the VLA in its C-configuration, we observed 372 targets selected from a variety of publications and produced a catalog of 367 methanol masers with sub arc second level positional accuracy, and high resolution radial velocity. We believe our catalog is a uniform and comprehensive collection of class II methanol maser in the first and second Galactic quadrants. High accuracy J2000 coordinates, radial velocities and fluxes are presented. Maser spots detected for each source are reported in 367 individual on-line available files, and we plot spot maps and spectra for each maser source. We also search for compact radio continuum emission toward all masers. This resulted in detections of 279 radio continuum sources, of which 157 are likely to be physically associated with a maser source. Statistical characteristics of various source properties are presented. These three catalogs may aid future investigations of massive star forming and the maser process.
References
- Argon et al. (2000) Argon, A. L., Reid, M. J., & Menten, K. M. 2000, ApJS, 129, 159
- Bertin & Arnouts (1996) Bertin, E., & Arnouts, S. 1996, A&AS, 117, 393
- Beuther et al. (2002) Beuther, H., Schilke, P., Sridharan, T. K., et al. 2002, A&A, 383, 892
- Brunthaler et al. (2011) Brunthaler, A., Reid, M. J., Menten, K. M., et al. 2011, AN, 332, 461
- Caswell (2009) Caswell, J. L. 2009, PASA, 26, 454
- Caswell & Breen (2010) Caswell, J. L., & Breen, S. L. 2010, MNRAS, 407, 2599
- Caswell et al. (1995) Caswell, J. L., Vaile, R. A., Ellingsen, S. P., Whiteoak, J. B., & Norris, R. P. 1995, MNRAS, 272, 96
- Churchwell (2002) Churchwell, E. 2002, ARA&A, 40, 27
- Contreras et al. (2013) Contreras, Y., Schuller, F., Urquhart, J. S., et al. 2013, A&A, 549, A45
- Cragg et al. (2005) Cragg, D. M., Sobolev, A. M., & Godfrey, P. D. 2005, MNRAS, 360, 533
- Cyganowski et al. (2008) Cyganowski, C. J., Whitney, B. A., Holden, E., et al. 2008, AJ, 136, 2391
- Davies et al. (2011) Davies, B., Hoare, M. G., Lumsden, S. L., et al. 2011, MNRAS, 416, 972
- Farmer (2014) Farmer, H. F. 2014, IJAA, 4, 571
- Green et al. (2009) Green, J. A., Caswell, J. L., Fuller, G. A., et al. 2009, MNRAS, 392, 783
- Green et al. (2010) —. 2010, MNRAS, 409, 913
- Green et al. (2012) —. 2012, MNRAS, 420, 3108
- Hoare (2005) Hoare, M. G. 2005, Ultra-Compact H II Regions (Springer), 203
- Immer et al. (2011) Immer, K., Brunthaler, A., Reid, M. J., et al. 2011, ApJS, 194, 25
- Kauffmann & Pillai (2010) Kauffmann, J., & Pillai, T. 2010, ApJ, 723, L7
- Kennicutt (2005) Kennicutt, R. C. 2005, in IAUS, Vol. 227, Massive Star Birth: A Crossroads of Astrophysics, ed. R. Cesaroni, M. Felli, E. Churchwell, & M. Walmsley, 3–11
- Ma (1997) Ma, C. 1997, in BAAS, Vol. 29, AAS, 1236
- Menten (1991) Menten, K. M. 1991, ApJ, 380, L75
- Menten et al. (1988) Menten, K. M., Reid, M. J., Moran, J. M., et al. 1988, ApJ, 333, L83
- Minier et al. (2001) Minier, V., Conway, J. E., & Booth, R. S. 2001, A&A, 369, 278
- Minier et al. (2003) Minier, V., Ellingsen, S. P., Norris, R. P., & Booth, R. S. 2003, A&A, 403, 1095
- Mottram et al. (2011) Mottram, J. C., Hoare, M. G., Davies, B., et al. 2011, ApJ, 730, L33
- Pandian et al. (2007) Pandian, J. D., Goldsmith, P. F., & Deshpande, A. A. 2007, ApJ, 656, 255
- Pandian et al. (2011) Pandian, J. D., Momjian, E., Xu, Y., Menten, K. M., & Goldsmith, P. F. 2011, ApJ, 730, 55
- Purcell et al. (2013) Purcell, C. R., Hoare, M. G., Cotton, W. D., et al. 2013, ApJS, 205, 1
- Reid et al. (2016) Reid, M. J., Dame, T. M., Menten, K. M., & Brunthaler, A. 2016, ApJ, 823, 77
- Reid et al. (1988) Reid, M. J., Schneps, M. H., Moran, J. M., et al. 1988, ApJ, 330, 809
- Reid et al. (2014) Reid, M. J., Menten, K. M., Brunthaler, A., et al. 2014, ApJ, 783, 130
- Sanna et al. (2010) Sanna, A., Moscadelli, L., Cesaroni, R., et al. 2010, A&A, 517, A78
- Sobolev & Deguchi (1994) Sobolev, A. M., & Deguchi, S. 1994, A&A, 291, 569
- Sun et al. (2014) Sun, Y., Xu, Y., Chen, X., et al. 2014, A&A, 563, A130
- Szymczak et al. (2012) Szymczak, M., Wolak, P., Bartkiewicz, A., & Borkowski, K. M. 2012, AN, 333, 634
- Thompson et al. (2006) Thompson, M. A., Hatchell, J., Walsh, A. J., MacDonald, G. H., & Millar, T. J. 2006, A&A, 453, 1003
- Urquhart et al. (2009) Urquhart, J. S., Hoare, M. G., Purcell, C. R., et al. 2009, A&A, 501, 539
- Urquhart et al. (2013) Urquhart, J. S., Thompson, M. A., Moore, T. J. T., et al. 2013, MNRAS, 435, 400
- Urquhart et al. (2015) Urquhart, J. S., Moore, T. J. T., Menten, K. M., et al. 2015, MNRAS, 446, 3461
- Walsh et al. (1998) Walsh, A. J., Burton, M. G., Hyland, A. R., & Robinson, G. 1998, MNRAS, 301, 640
- Walsh et al. (1997) Walsh, A. J., Hyland, A. R., Robinson, G., & Burton, M. G. 1997, MNRAS, 291, 261
- Xu et al. (2008) Xu, Y., Li, J. J., Hachisuka, K., et al. 2008, A&A, 485, 729
- Xu et al. (2009) Xu, Y., Voronkov, M. A., Pandian, J. D., et al. 2009, A&A, 507, 1117
- Zinnecker & Yorke (2007) Zinnecker, H., & Yorke, H. W. 2007, ARA&A, 45, 481