Correlating charge radius with quadrupole deformation and in atomic nuclei
Abstract
A good linear correlation is found between the four-point charge radius relation with that of quadrupole deformation data in even-even nuclei. This results in a further improved charge radius relation that holds in a precision of about 5 fm. The new relation can be generalized to the reduced electric quadrupole transition probability between the first state and the ground state, and the mean lifetime of the first 2+ state. Same correlations are also seen in global nuclear models, their precisions, however, are not enough to be consistent with the experimental data.
pacs:
21.10.Ft, 21.10.Tg, 23.20.-g, 29.87.+gI Introduction
Mass, charge radius, lifetime, electric (magnetic) transition probability, and deformation are among the most fundamental observables for the many-body nuclear system. A systematic analysis of these data have been successful in bringing forth a global picture of the atomic nuclei. For example, experimental binding energies or charge radii for neighboring nuclei do not differ much except at several specified regions like closed shells or onset of shape.
On the other hand, comparing these observables of atomic nuclei, which differ by one or a few neutrons or protons, have yielded many empirical relations or filters for special interaction strengths between the valence nucleons. Of them, the Garvey-Kelson relations for nuclear binding energies are probably one of the best known examples Garvey and Kelson (1966); Gao et al. (2001); Barea et al. (2008); Morales and Frank (2011); He et al. (2013); Tian et al. (2013); Bao et al. (2013); Cheng et al. (2014). The validity of this relation in the nuclear charge radius has also been examined recently Piekarewicz et al. (2010).
The radius of the charge (proton) distribution can be assumed to be equal to that of the nuclear mass distribution, considering the nucleus as a liquid drop with the protons homogeneously distributed over the sphere of the nucleus. Although not accurate in prediction, this simple liquid-drop model can serve as a guide, and the interesting physics can be found in local deviations from the global behavior. In our recent work Sun et al. (2014, 2015) we proposed a set of nuclear charge radius relations ,
| (1) | |||||
where is the root-mean-square (rms) charge radius of the nucleus with neutrons and protons. and are integers. The validity of such relation is a consequence of the smooth transition in the nuclear structure that is often found when going from a nucleus to its neighboring nuclei. Eq. 1 holds precisely over almost the whole nuclear chart except at a few regions characterized by shape transition and shape coexistence at, e.g., , and . These exceptions raise the possibilities that more accurate local systematics may be developed from the experimental data.
One simple case connecting only even-even nuclei is
| (2) | |||||
The term , the so-called isotope shift, involves the variation of the charge distribution when only two neutrons are added to the system. In this sense, is nothing but the difference of isotope shifts for neighboring two isotopic chains. Hereafter we simply rewrite as .
In this work, we aim to examine and quantify the correlation between the local charge radius relations and those of deformation data. The correlation is made from cases that both charge radius and quadrupole deformation data are experimentally availbale. This then leads us to an improved relation by correcting the contribution from quadrupole deformation effect in atomic nuclei. Moreover, this new relation can be naturally extended to the reduced electric quadrupole transition probability between the first state and the ground state, and the mean lifetime of the first 2+ state.
II Shape effect on charge radii
For the system of spherical nuclei, the rms charge radii can be empirically described by
| (3) |
where is the mass number and is fixed to 1.2 fm throughout this paper. Thus for the even-even isotopes is
| (4) |
Numerically it is easy to see that goes down to a few times fm with increasing mass number.
For a deformed nucleus, the charge radius can be simply decoupled to the spherical and deformation part. For the important case of an axially symmetric shape, by neglecting the high-order corrections one can express this approximately as:
| (5) |
where is the rms quadrupole deformation for the nuclide (). As will be described later, it is derived experimentally from the reduced electric quadrupole transition probability . corresponds to the charge radius of a spherical nucleus that the nuclear volume is conserved, and is defined by Eq. 3. Eq. (5) may be generalized to include higher order multipoles or triaxial shape Bohr and Mottelson (1969); Greiner and Maruhn (1996).
Accordingly, the experimental four-point relation can be expressed in terms of two variables representing the spherical equivalent radius and the deformation. This corresponds to a two-parameter model of describing ,
| (6) | |||||
where is defined in Eq. (4), and comes from the variance of deformation in the relevant nuclei,
| (7) | |||||
The approximation of the last term is valid especially for heavier system. Because of the negligible contribution of , the resulting is mostly determined by the terms relevant to nuclear deformation. Although dynamic deformations and higher-order multipoles are not included in this equation, they can be subsumed in principle under the deformation term in which is replaced by .
III Correlation between charge radius and quadrupole deformation
III.1 Experimental data
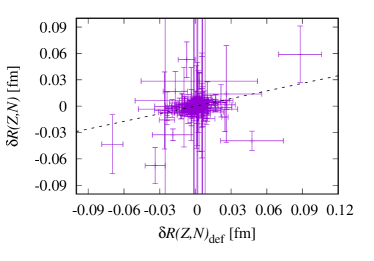
We can now examine the correlation between the experimental and . The resulting correlation plot is shown in Fig. 1. The experimental charge radius and deformation data are from the latest evaluations Angeli and Marinova (2013); Pritychenko et al. (2016). There are in total 149 even-even nuclei from Ne to Cm. It is seen that almost all the data follow a linear trend within 1 standard deviation (). A coefficiency of 0.29(6) is determined with a reduced of 0.8. This indicates that experimental data of charge radii and quadrupole deformation are in well consistency.
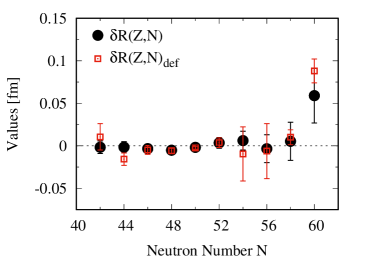
Specifically, this correlation can be seen for the Sr isotopes in Fig. 2. The sudden onset of the shape transition at is reflected distinctly by both and . The deformation parameters for the relevant 4 nuclei, Sr, Sr, Kr and Kr are 0.40(1), 0.175(6), 0.25(3), 0.19(1), resulting in of 0.088(14) fm for 98Sr. Therefore, once considering the deformation correlation, the large value at , the well-known region of phase transitions, can be largely diminished. Similar correlation has been observed at for the Nd isotopes. Unfortunately, it is not possible yet to test the region at due to missing deformation data experimentally.
5 cases at Ne, Ca, Ti, Se, and Kr, show deviations from the linear trend by more than 2. Of them, Ne is the lightest nuclide with available charge radius and deformation data. It is known already that the precision of the charge radius formula deteriorates with decreasing mass number (in particularly for ) Sun et al. (2014). This may be understood in the fact that the collective “deformation” property is more suitable for heavy nuclei in comparision with lighter nuclei. Further check on the mass dependence confirms this argument, where 8 of 10 cases with have deviations from the linear trend by more than 1 . It should be noted that 1 discussed here is even as small as 0.0040 fm.
These few cases may be (partially) related to the various sources of charge radii and deformation, given the different methods of systematic errors associated with different techniques. We noted that a recent analysis Birch et al. (2016) of measurements, from which is derived, concluded that most prevalent methods of measuring values are equivalent. Such comparison is not available yet for charge radius data across the entire chart of nuclides. Anyway, a consistent and equivalent set of nuclear charge radii and data are definitely crucial. A combined analysis of the cases for Ca and Ti shows that increasing the charge radius by 0.3% or decreasing the by about 40% (unlikely) for Ca will result in their values in better agreements with the linear trend. Similar arguments hold also for the cases of Se and Kr. Therefore, the correlation identified here may provide us a very accurate way to investigate the consistence of both the charge radius and deformation surface.
In Ref. Sun et al. (2014), it was found that Eq. (1) is remarkably successful even at nuclei with magic neutron and/or proton numbers. This can be easily understood with the correlation identified. Nuclei with magic number of neutrons and/or protons is mostly in the spherical shape, i.e., their values of less than 0.1, thus leading to naturally a net . This is very different from the counterpart in nuclear mass, the valence proton-neutron interactions Brenner et al. (2006); Cakirli et al. (2005); Chen et al. (2009). It depends strongly on the spatial overlap of the valence orbits and presents a dramatic variation when crossing neutron shell closures.
III.2 Correlations in nuclear models
The knowledge of both experimental data on charge radii and deformation are still very limited. It will be very useful if nuclear models can provide these data either in absolute values or in differential values at a reasonable precision. For example, when one experimental deformation parameter is missing, one can resort to the theoretical predictions in nuclear models. Care should be taken that quantities like refer to the charge (proton) distribution in the nucleus and that in particular is the charge deformation related to this charge distribution. This should be kept in mind when comparing the experimental results to nuclear models.
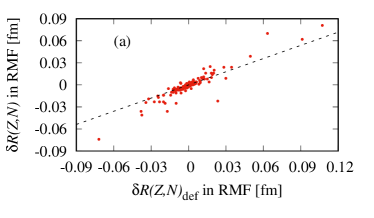
Global nuclear models can provide both charge radius and deformation data self-consistently. We choose Hartree-Fock-Bogoliubov (HFB-24) model Goriely et al. (2013) and the relativistic mean-field (RMF) model Geng et al. (2005) to check the same correlation. As shown in Fig. 3(a), a linear correlation is predicted between and in the RMF. The slope is determined to be 0.60, about a factor two larger than that of experimental data. The difference from the experimental trend should be related to the fact that all nuclei are treated with axially symmetric shapes in the RMF approach. The same correlation has also been found in the HFB-24 but with a different coefficience parameter (0.85).
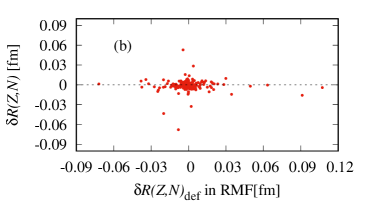
However, such correlation vanish once we use the theoretical values instead of experimental data. As an example, vs. calculated using the in the RMF is shown in Fig. 3(b). This indicates that current nuclear models are not accurate enough yet to reproduce the correlation seen in the experiment.
IV Discussion
IV.1 Improved charge radius formula
As verified in the previous section, the can be quantitatively reproduced with the for the existing data. This leads to the improved charge radius formula as follows:
| (8) |
where C is 0.29(6) determined from Fig. 1. and are given in Eq. (2) and Eq. (7), respectively.
The cases with experimental data are used to the check the accuracy of the relation without/with deformation correction. The weighted mean values of amount to only -8 fm with the weighted standard deviation of 5 fm. This is about 15% improvement in precision comparing with that without correction (i.e., ). The significance is that Eq. (8) can be extended to cases even when sudden variances occur in nuclear shapes.
IV.2 Correlation of charge radius with and
Experimental quadrupole deformation values are derived from the model-independent experimental values of the reduced electric quadrupole transition probability , between the ground state and the first state in even-even nuclides, using the semi-empirical approach,
| (9) |
Here fm and is in units of e2b2. It is assuming a uniform charge distribution out to the distance and zero charge beyond Greiner and Maruhn (1996); RAMAN et al. (2001).
The values are fundamentally important quantities for determining the collectivity in nuclei. Moreover, are related to the mean lifetime of the first state through
| (10) |
where is the excitation energy of the first state (in units of keV), and in ps. The total internal conversion coefficient for a specific is needed for correction.
can be accordingly rewritten in terms of and ,
| (11) | |||||
where all the quantities , , , and in the term are for the four neighboring even-even nuclei. In case of no abrupt shape transition, , and the following relation involving again four neighboring doubly even nuclei should hold well,
| (12) |
For heavy nuclear system, where the difference in can be safely neglected, we can then get the relation
| (13) | |||||
The same relation was proposed independently in Ref. Patnaik et al. (1975). To examine the validity of eq.(13), we use the same data set as in Fig. 1 were used to examine the validity of .
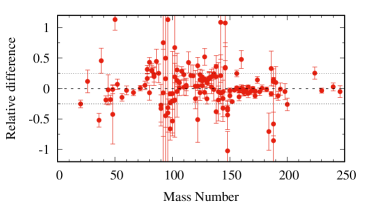
The “theoretical” value of a given nucleus , , is calculated in terms of experimental of its three neighboring nuclei , , . Fig. 4 shows the relative differences of the predictions defined as . It is seen that values can be calculated within an accuracy of 25%, and often better. The large deviations are shown at and 90. It should be aware that the precisions of experimental data are getting worse as well at these regions.
Inserting Eq. (11) into Eq. (8) we get a correlation between four-point charge radius relation with that of or . This new relation, in principle, should be more accurate for predictions of unknown values than Eq. (13), because possible shape transitional effect can be at least partially compensated by the relevant charge radius data. When seven quantities out of eight , e.g., four charge radii and three data, are known, then the last can be calculated. Unfortunately, this will give mostly a too large uncertainty to make meanful predictions. The uncertainty is mainly propagated from the charge radius data and is typically about 1 order of magnitude higher than that from Eq. (13).
V Conclusion
With the available experimental data, a linear correlation has been found between the charge radius relation and the according quadrupole deformation (and thus ) relation . This correlation can provide a consistence check or analysis of experimental data on charge radii and deformation data. In the near future it is also interesting to see whether the linear coefficiency 0.29(6) remains for more exotic nuclei, especially at shape transitional regions.
The large deviation of four-point charge radius relation at shape transitional regions, can be quantitatively reproduced with the when experimental data are available. This in turn gives an improved charge radius formula, and therefore is very useful to make reliable short-range extrapolations of charge radii over the nuclear chart. Same correlation has been found in globle nuclear models, but so far the model itself is not accurate enough to reproduce the experimental data. Moreover, the relation can be generalized to a new relation between charge radius and or . A simple four-point relation can reproduce experimental values within an accuracy of about 25%.
Finally, we would like to mention that a consistent description Wood et al. (1999); Zerguine et al. (2008, 2012); Li et al. (2009a, b); Mei et al. (2012); Li et al. (2013); Zhao et al. (2010) of radius and transition probabilities of atomic nuclei are important to understand their correlation and thus for a better interpretation of experimental results. A recent example is shown in 111-129Cd Yordanov et al. (2016), in which the parabolic behavior of the charge radii is found due to the linear tendency of the quadruple deformation.
VI Acknowledgments
This work has been supported by the NSFC under No. 11235002, 11475014 and National Program on Key Basic Research Project (2016YFA0400502). The authors thank Z. P. Li, Z. M. Niu, P.W. Zhao, and L. H. Zhu for useful comments.
References
- Garvey and Kelson (1966) G. T. Garvey and I. Kelson, Phys. Rev. Lett. 16, 197 (1966), URL http://link.aps.org/doi/10.1103/PhysRevLett.16.197.
- Gao et al. (2001) Z.-C. Gao, Y.-S. Chen, and J. Meng, Chinese Physics Letters 18, 1186 (2001), URL http://stacks.iop.org/0256-307X/18/i=9/a=310.
- Barea et al. (2008) J. Barea, A. Frank, J. G. Hirsch, P. V. Isacker, S. Pittel, and V. Velázquez, Phys. Rev. C 77, 041304 (2008), URL http://link.aps.org/doi/10.1103/PhysRevC.77.041304.
- Morales and Frank (2011) I. O. Morales and A. Frank, Phys. Rev. C 83, 054309 (2011), URL http://link.aps.org/doi/10.1103/PhysRevC.83.054309.
- He et al. (2013) Z. He, M. Bao, Y. M. Zhao, and A. Arima, Phys. Rev. C 87, 057304 (2013), URL http://link.aps.org/doi/10.1103/PhysRevC.87.057304.
- Tian et al. (2013) J. Tian, N. Wang, C. Li, and J. Li, Phys. Rev. C 87, 014313 (2013), URL http://link.aps.org/doi/10.1103/PhysRevC.87.014313.
- Bao et al. (2013) M. Bao, Z. He, Y. Lu, Y. M. Zhao, and A. Arima, Phys. Rev. C 88, 064325 (2013), URL http://link.aps.org/doi/10.1103/PhysRevC.88.064325.
- Cheng et al. (2014) Y. Y. Cheng, Y. M. Zhao, and A. Arima, Phys. Rev. C 89, 061304 (2014), URL http://link.aps.org/doi/10.1103/PhysRevC.89.061304.
- Piekarewicz et al. (2010) J. Piekarewicz, M. Centelles, X. Roca-Maza, and X. Vinas, Eur. Phys. J. A 46, 379 (2010).
- Sun et al. (2014) B. H. Sun, Y. Lu, J. P. Peng, C. Y. Liu, and Y. M. Zhao, Phys. Rev. C 90, 054318 (2014), URL http://link.aps.org/doi/10.1103/PhysRevC.90.054318.
- Sun et al. (2015) B. H. Sun, Y. Lu, J. P. Peng, C. Y. Liu, and Y. M. Zhao, Phys. Rev. C 91, 019902 (2015), URL http://link.aps.org/doi/10.1103/PhysRevC.91.019902.
- Bohr and Mottelson (1969) A. Bohr and B. R. Mottelson, NUCLEAR STRUCTURE Volume I: Single-Particle Motion (W. A. Benjamin, Inc., 1969).
- Greiner and Maruhn (1996) W. Greiner and J. A. Maruhn, Nuclear Models (Spinger-Verlag Berlin Heidelberg, 1996).
- Angeli and Marinova (2013) I. Angeli and K. Marinova, Atomic Data and Nuclear Data Tables 99, 69 (2013), ISSN 0092-640X, URL http://www.sciencedirect.com/science/article/pii/S0092640X12000265.
- Pritychenko et al. (2016) B. Pritychenko, M. Birch, B. Singh, and M. Horoi, Atomic Data and Nuclear Data Tables 107, 1 (2016), ISSN 0092-640X, URL http://www.sciencedirect.com/science/article/pii/S0092640X15000406.
- Birch et al. (2016) M. Birch, B. Pritychenko, and B. Singh, Nuclear Physics A 955, 145 (2016), ISSN 0375-9474, URL http://www.sciencedirect.com/science/article/pii/S0375947416301701.
- Brenner et al. (2006) D. S. Brenner, R. B. Cakirli, and R. F. Casten, Phys. Rev. C 73, 034315 (2006), URL http://link.aps.org/doi/10.1103/PhysRevC.73.034315.
- Cakirli et al. (2005) R. B. Cakirli, D. S. Brenner, R. F. Casten, and E. A. Millman, Phys. Rev. Lett. 94, 092501 (2005), URL http://link.aps.org/doi/10.1103/PhysRevLett.94.092501.
- Chen et al. (2009) L. Chen, Y. A. Litvinov, W. R. Plaß, K. Beckert, P. Beller, F. Bosch, D. Boutin, L. Caceres, R. B. Cakirli, J. J. Carroll, et al., Phys. Rev. Lett. 102, 122503 (2009).
- Goriely et al. (2013) S. Goriely, N. Chamel, and J. M. Pearson, Phys. Rev. C 88, 024308 (2013), URL http://link.aps.org/doi/10.1103/PhysRevC.88.024308.
- Geng et al. (2005) L. Geng, H. Toki, and J. Meng, Progress of Theoretical Physics 113, 785 (2005), eprint http://ptp.oxfordjournals.org/content/113/4/785.full.pdf+html, URL http://ptp.oxfordjournals.org/content/113/4/785.abstract.
- RAMAN et al. (2001) S. RAMAN, C. N. JR., and P. TIKKANEN, Atomic Data and Nuclear Data Tables 78, 1 (2001), ISSN 0092-640X, URL http://www.sciencedirect.com/science/article/pii/S0092640X01908587.
- Patnaik et al. (1975) R. Patnaik, R. Patra, and L. Satpathy, Phys. Rev. C 12, 2038 (1975), URL http://link.aps.org/doi/10.1103/PhysRevC.12.2038.
- Wood et al. (1999) J. L. Wood, E. F. Zganjar, C. De Coster, and K. Heyde, Nucl. Phys. A 651, 323 (1999).
- Zerguine et al. (2008) S. Zerguine, P. Van Isacker, A. Bouldjedri, and S. Heinze, Phys. Rev. Lett. 101, 022502 (2008), URL http://link.aps.org/doi/10.1103/PhysRevLett.101.022502.
- Zerguine et al. (2012) S. Zerguine, P. Van Isacker, and A. Bouldjedri, Phys. Rev. C 85, 034331 (2012), URL http://link.aps.org/doi/10.1103/PhysRevC.85.034331.
- Li et al. (2009a) Z. P. Li, T. Nikšić, D. Vretenar, J. Meng, G. A. Lalazissis, and P. Ring, Phys. Rev. C 79, 054301 (2009a), URL http://link.aps.org/doi/10.1103/PhysRevC.79.054301.
- Li et al. (2009b) Z. P. Li, T. Nikšić, D. Vretenar, and J. Meng, Phys. Rev. C 80, 061301 (2009b), URL http://link.aps.org/doi/10.1103/PhysRevC.80.061301.
- Mei et al. (2012) H. Mei, J. Xiang, J. M. Yao, Z. P. Li, and J. Meng, Phys. Rev. C 85, 034321 (2012), URL http://link.aps.org/doi/10.1103/PhysRevC.85.034321.
- Li et al. (2013) Z. Li, B. Song, J. Yao, D. Vretenar, and J. Meng, Physics Letters B 726, 866 (2013), ISSN 0370-2693, URL http://www.sciencedirect.com/science/article/pii/S0370269313007648.
- Zhao et al. (2010) P. W. Zhao, Z. P. Li, J. M. Yao, and J. Meng, Phys. Rev. C 82, 054319 (2010), URL http://link.aps.org/doi/10.1103/PhysRevC.82.054319.
- Yordanov et al. (2016) D. T. Yordanov, D. L. Balabanski, M. L. Bissell, K. Blaum, I. Budinčević, B. Cheal, K. Flanagan, N. Frömmgen, G. Georgiev, C. Geppert, et al., Phys. Rev. Lett. 116, 032501 (2016), URL http://link.aps.org/doi/10.1103/PhysRevLett.116.032501.