August 4, 2016 \AcceptedSeptember 8, 2016 \Publishedpublication date \SetRunningHeadAstronomical Society of JapanUsage of pasj00.cls
Galaxy: nucleus – galaxies: Seyfert – galaxies: individual (NGC 1068) – submillimeter – techniques: interferometric
A Massive Dense Gas Cloud close to the Nucleus of the Seyfert galaxy NGC 1068
Abstract
Using the ALMA archival data of both 12CO (6–5) line and 689 GHz continuum emission towards the archetypical Seyfert galaxy, NGC 1068, we identified a distinct continuum peak separated by 14 pc from the nuclear radio component S1 in projection. The continuum flux gives a gas mass of and bolometric luminosity of , leading to a star formation rate of 0.1 yr-1. Subsequent analysis on the line data suggest that the gas has a size of pc, yielding to mean H2 number density of cm-3. We therefore refer to the gas as “massive dense gas cloud”: the gas density is high enough to form a “proto starcluster” whose stellar mass of . We found that the gas stands a unique position between galactic and extraglactic clouds in the diagrams of start formation rate (SFR) vs. gas mass proposed by Lada et al. and surface density of gas vs. SFR density by Krumholz and McKee. All the gaseous and star-formation properties may be understood in terms of the turbulence-regulated star formation scenario. Since there are two stellar populations with the ages of 300 Myr and 30 Myr in the 100 pc-scale circumnulear region, we discuss that NGC 1068 has experienced at least three episodic star formation events with a tendency that the inner star-forming region is the younger. Together with several lines of evidence that the dynamics of the nuclear region is decoupled from that of the entire galactic disk, we discuss that the gas inflow towards the nuclear region of NGC 1068 may be driven by a past minor merger.
1 Introduction
NGC 1068 is one of the nearest archetypical Seyfert galaxies in the nearby Universe (Seyfert, 1943; Khachikian & Weedman, 1974), making it an ideal laboratory towards understanding active galactic nuclei (AGNs) (Antonucci & Miller, 1985); the distance of 15.9 Mpc (Kormendy & Ho, 2013) is adopted throughout this paper. Therefore, a number of observational studies at various wavelengths have been made to understand the nature of AGN phenomena in NGC 1068 [e.g., Cecil et al. (2002); Storchi-Bergamnn et al. (2012); Mezcua et al. (2015); Lopez-Rodriguez et al. (2016); Wang et al. (2012)].
Another important issue is the so-called starburst-AGN connection since a number of Seyfert galaxies have an intense circumnuclear ( pc scale) star forming region around its AGN [e.g., Simkin et al. (1980); Wilson et al. (1991); Storchi-Bergamnn et al. (1996) and references therein]. Although there is no general consensus for this issue, both the nuclear ( pc scale) starburst and the AGN activity commonly needs efficient gas inflow to the circumnuclear and nuclear regions. Therefore, it is expected that intense star formation events around the nucleus of an AGN-hosting galaxy will provide us useful hints to understand the triggering mechanism of AGNs. This issue is also important when we investigate the coevolution between galaxies and super massive black holes (SMBHs); i.e., the positive correlation between the spheroidal and SMBH masses in galaxies (Kormendy & Ho, 2013; Heckman & Best, 2014).
Since NGC 1068 has intense circumnuclear star forming regions around its AGN, it also provides us an important laboratory for this issue. It has been suggested that NGC 1068 has two stellar populations in the 100 pc-scale circumnuclear region; around the nucleus (Storchi-Bergamnn et al., 2012); one is the relatively young stellar population with an age of 300 Myr extending over the 100-pc scale circumnuclear region, and the second one is the ring-like structure at 100 pc from the nucleus with an age of 30 Myr. Since the inner 35 pc region is dominated by an old stellar population with an age of 2 Gyr, it is suggested that the two episodic intense star formation events occurred in the circumnuclear region of NGC 1068 although their origins have not yet been understood. At the western part in the ring, molecular Hydrogen emission, H2 S(1), is detected with a shell-like structure (Schinnerer et al., 2000; Vale et al., 2012). Since this emission often probes the shock-heated gas, either a super-bubble or an AGN feedback effect or both have been discussed as its origin to date (Storchi-Bergamnn et al., 2012; García-Burillo et al., 2014a, b), In either case, a certain asymmetric perturbation could drive the intense star formation event 30 Myr ago.
If there is a certain physical relationship between circumnuclear and nuclear star formation events and the triggering AGN, it is intriguing to investigate the star formation activity in much inner region in NGC 1068. For this purpose, it is essential to attain high spatial resolution down to pc-scale both at dust continuum emission and thermal molecular lines, which allow us to diagnose not only gas kinematics but also gas physics. In this context, Atacama Large Millimeter/Submillimeter Array (ALMA) has been extensively used to study atomic and molecular gas and dust properties of NGC 1068 in detail (García-Burillo et al., 2014a, b, 2016; Imanishi et al., 2016; Izumi et al., 2016).
Among these brand-new ALMA observations, we emphasize potential importance of the newly detected 689 GHz continuum source located close to the central engine of NGC 1068 observed by García-Burillo et al. (2014a) (project-ID: 2011.0.00083.S), although it was not identified as an independent source by the authors (see their Figure 3). In addition, the continuum source has not been separately identified as an object in their CO (6–5) map either. García-Burillo et al. (2014a) interpreted that the molecular gas associated with the continuum source represents a portion of the circumnuclear region rather than an independent source; see their Figure 4c. Taking account of the proximity to the nucleus [the nuclear radio component S1 (Gallimore et al., 2004)], we consider that this source must be playing an import role to form the observed complicated properties of the nuclear region of NGC 1068. In order to address the nature of the continuum source and its role in the dynamics of the nuclear region, we analyzed their ALMA data.
2 Data
The ALMA data analyzed here were originally taken by Garcia-Burillo et al.; see details of their observations in García-Burillo et al. (2014a). We retrieved their image data from the data archive system of the Japanese Virtual Observatory111Japanese Virtual Observatory (JVO) is operated by National Astronomical Observatory of Japan (NAOJ).. We obtained the data set whose IDs are ALMA01001360 (the original file name of NGC1068.B9.spw0.avg33chan.fits) for the ALMA Band 9 CO (6–5) line image cube data, and ALMA01001362 (NGC1068.B9.continuum.fits) for the Band 9 689 GHz continuum image, which was obtained from concatenating four 1.875 GHz bandwidth spectral windows by García-Burillo et al. (2014a).
We used the task imhead in the CASA package to set rest-frequency () of the CO transition to be GHz. To increase signal-to-noise (S/N) ratio of the line emission, we smoothed the line data along the velocity axis every 2 channels using task imrebin by keeping the original frame of “LSRK” for the velocity axis. The resultant CO data have 58 channels with a resolution of 13.97 km s-1. After completing this minimum data processing, we exported the CASA-formatted data into FITS files, and imported them into GILDAS package for scientific analysis.
Using our own scripts running on GILDAS package used in previous works, e.g., Furuya et al. (2014), we shifted the origins of all the images to that of the previously known AGN; the nuclear radio component S1 (Gallimore et al., 2004). Subsequently we evaluate RMS noise levels of the images by calculating statistics for arbitrary selected emission-free area in the 3-dimensional cube data. Iterating such analyses by changing areas, we found that RMS noise levels calculated in each velocity channel was fairly uniform with uncertainty of 28%. We end up with the mean of the image noise levels of 1 16.8 mJy beam-1 in specific intensity per 14 km s-1 resolution for the CO (6–5) line, and 1.67 mJy beam-1 for the 689 GHz continuum image. Both the line and continuum images have the the same pixel size of \timeform0.05”. The synthesized beam size of the images which we retrieved from the archive (\timeform0.33”\timeform0.22” in FWHM at PA\timeform81D) slightly differs from that in García-Burillo et al. (2014a) (\timeform0.4”\timeform0.2” at PA\timeform50D). We consider that such a difference would be caused by those in the visibility data flagging and parameters used when Fourier-transformed into the image plane.
3 Results
3.1 The Nuclear 689 GHz Continuum Peak
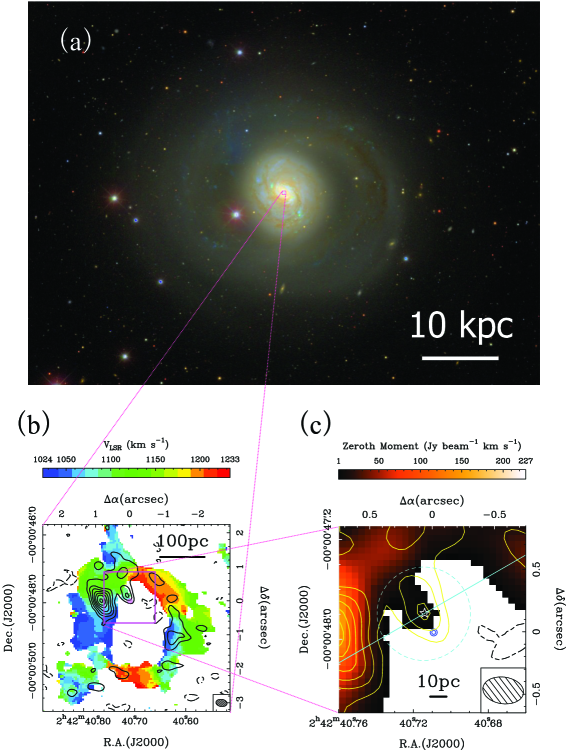
Here we focus our attention on a nuclear 689 GHz continuum peak close to the nucleus. In order to show the presence and the location of this continuum peak in the nucleus region of NGC 1068, we present Figure 1 where overall morphology is shown by the optical image [panel (a)] whereas the complicated morphology by the submm ALMA images [panels (b) and (c)]. We stress that the complexity of the central region is clearly recognized in both (b) the velocity centroid map, which is produced from the CO (6–5) line, and (c) 689 GHz continuum map. Here, the velocity centroid map in unit of km s-1 is obtained as an intensity-weighted mean velocity map through dividing the first order momentum map by the zeroth order one. These moment maps are calculated by using the data shown in Figure 2 with the task moments over velocity range of 1020 km s-1 (LSR) km s-1. This velocity range is selected by comparing the velocity channel maps (Figure 2) and the spectrum (Figure 3).
Figure 1c presents the spatial distribution of 689 GHz emission in the central region of the galaxy. Comparing Figure 1c and the lower panel of Figure 3 in García-Burillo et al. (2014a), one immediately notices that there exists a local peak of the continuum emission, but its position does not coincident with that of the known AGN, S1. Although this continuum peak is readily recognized in Figure 3 of García-Burillo et al. (2014a), these authors did not identify it as a distinct object and any discussion was not given in their paper.
This 689 GHz continuum local maximum has the peak intensity of 16.2 mJy beam-1, corresponding to 0.60 K in the mean brightness temperature over the synthesized beam, . We obtained its flux density of 9.5 mJy integrated over the beam centered on the peak. This peak is located at RA (J2000) and DEC (J2000) \timeform-0D0’47.79”, which is \timeform0.18” NNE from the position of the nuclear component S1 identified by the 8.4 GHz continuum imaging (Gallimore et al., 2004) at RA (J2000) and DEC (J2000) \timeform-0D0’47.9449” which is adopted in García-Burillo et al. (2016) (see caption of their Figure 1). The position of S1 reported in Gallimore et al. (2004) was obtained through astrometry between the 8.4 GHz continuum image taken by VLBA and that of the H2O masers observed by VLA, yielding absolute position accuracy of mas [see Figure 7 in Gallimore et al. (2004)]. On the other hand, it is not trivial to evaluate absolute position accuracy of the 689 GHz continuum peak, which should be primarily determined by accuracies of the baseline vectors, angular separation(s) to the calibrator(s), and their absolute position accuracies. We therefore arbitrary assume the widely accepted idea that absolute position accuracy of a point source imaged by a connected-type interferometer is typically better than a fraction of its synthesized beam size. Namely we employ an absolute position accuracy to be as a fiducial value. Notice that the accuracy is identical to the pixel field of view (§2). Taking all the above into account, the angular separation of \timeform0.18” between the S1 and the 689 GHz continuum peak is believed to be real, as clearly recognized in Figure 3 of García-Burillo et al. (2014a). Last, the angular separation corresponds to the projected separation of 14 pc.
3.2 Molecular Gas Associated with the 689 GHz Continuum Peak
In order to elucidate the origin of the 689 GHz continuum source, we investigate molecular gas properties associated with this source.
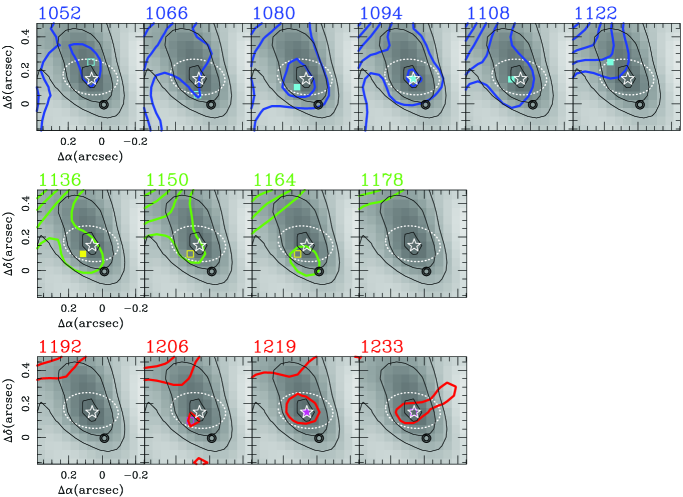
First, we compare velocity channel maps of the CO (6–5) line emission by overlaying on the continuum emission map in Figure 2. We note that the CO emission around the continuum peak appears to be contaminated with the gas associated with the circumnuclear ring (Schinnerer et al., 2000), as seen towards the top-left corner in each panel.
Second, we present CO (6–5) line spectral profile towards the continuum peak after subtracting the continuum emission (Figure 3). The spectrum was made by integrating the CO (6–5) emission inside the dotted-ellipse shown in Figure 2. The ellipse, i.e., the adopted aperture, is centered on the 689 GHz continuum peak and the area is identical to that of the synthesized beam size. The systemic velocity of the entire galaxy, (LSR) 1126 km s-1, falls between the blue and green bars in the spectrum, yielding asymmetry of the blue- and red components with respect to the systemic velocity, . We thus believe that the local gas associated with the continuum is decoupled from the galaxy-wide motion of the gas. Therefore we arbitrary assume that the green-coded component seen in the velocity range of (LSR) = 1140– 1160 km s-1 represents the bulk motion of the local gas. This assumption would not be affected by the results from the higher angular resolution new observations by García-Burillo et al. (2016) because the source of our interests appears to be resolved out by the extended array configuration observations. The blueshifted component is seen in (LSR) = 1050 – 1120 km s-1, whereas the red one at (LSR) = 1200 – 1230 km s-1. Namely, both the blue- and redshifted components have almost same velocity shifts with respect to that of the bulk gas, i.e., 65 km s-1.
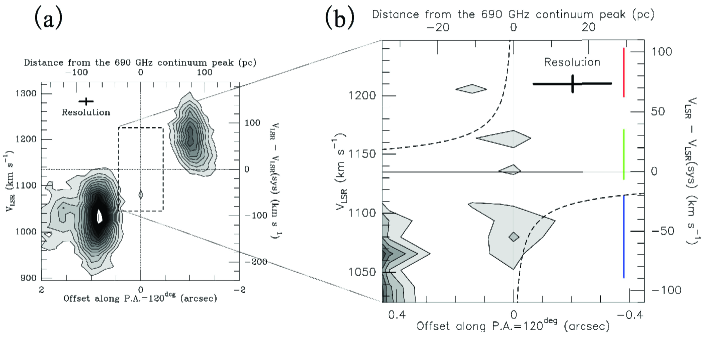
Third, in Figure 4, we show the position-velocity (PV) maps where we adopted the line with PA \timeform120D passing at the 689 GHz continuum peak as a slicing line (the solid line in Figure 1b). The direction of the line is perpendicular to the line connecting the 689 GHz continuum peak with the nucleus, S1 (PA\timeform30D). We also point out that the 689 GHz continuum is elongated towards the north-northeast (PA\timeform30D); see Figure 1b. Despite inadequate spatial resolution, the PV diagram in the panel b demonstrates that multiple velocity components of the gas coexists within the compact region which cannot be resolved by the beam size of the data analyzed in this work.
Last, we do not completely rule out an alternative hypothesis that an opaque “static” single-velocity component gas is responsible for the multiple velocity features in Figures 3 and 4. In this interpretation, the spectral profile is considered as self-absorption of the line because of high optical depth (; described in §4.2). However, this single gas hypothesis has a caveat that one should observe a double-peaked spectral profile whose absorption dip appears around the LSR-velocity of the static bulk gas. Contrary to this expectation, we detected the weak emission labeled with green bar (Figure 3). We therefore stick on the inference from Figure 4 that there exist multiple components of the gas having different velocities along the line of sight.
4 Analysis
4.1 Dynamical Properties
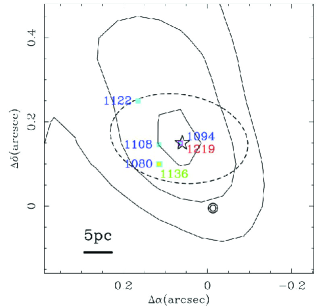
Subsequent questions are how compact the gas cloud is and what is the origin of the multiple velocity components. An estimate of the size may be obtained from effective radius () of the beam size, i.e., the geometrical mean of the major and minor axes of elliptical beam of 21 pc. Although the beam size does not suffice to resolve the gas “condensation”, we attempt to give a better constraint on the radius as follows. At each velocity channel, we search for a peak pixel within the aperture where we made the spectrum. Figure 5 compares the peak pixel positions obtained from each velocity channel shown in Figure 2. To produce the figure, we limited to plot the peak pixel positions which have S/N-ratio of higher than 4. Assessing scatter of their positions, we obtained a stronger constraint that the spatial extent of gas is at most 2\timeform0.07”, corresponding to 25 pc in effective diameter (see Figure 5). Here we excluded the (LSR) km s-1 component which seems to represent a local maxima of the gas contaminated with that associated with the circumnuclear ring rather than the gas of our interests.
Taking account of both the symmetry of velocity ranges where signals were detected and the spatio-velocity structure recognized in Figure 4b, one may consider that the blue- and redshifted gas are associated with a rotating structure around the central object. If we adopt a rotating radius 3 pc, an upper limit of the enclosed mass is calculated to be where we set . However, we argue that the gas is not in equilibrium by a pure rotation. This is because its specific angular momentum of is significantly higher than that expected from the correlation between and (Bodenheimer, 1995) where is angular velocity of s-1 for this object. Note that a typical GMC has of the order of s-1 (Bodenheimer, 1995). We therefore return to the most naíve hypothesis: there are multiple components of gas having different velocities along the line of sight.
4.2 Star Formation and Gas Properties
Another clue to shed light on the nature of the gas condensation is obtained from analysis of the continuum flux. Following the spectral energy distribution (SED) analysis in García-Burillo et al. (2014a), we attempted to explain the observed 689 GHz continuum flux by thermal emission from dust grains, which can be approximated by a single temperature grey body emission. Adopting a range for dust temperature () of 50 –70 K, frequency-index of emissivity of dusts () of 1.7 (Klaas et al., 2001), dust mass absorption coefficient () at reference frequency ( GHz) of 0.005 cm g-1 (Preibisch et al., 1993; André et al., 1996) and the value, we found that the gas plus dust mass of is required to reproduce the observed value. For a simplicity of the analysis, we kept the hypothesis that the thermal emission from dust grains can be approximated as if it is emanated from a single component gas [e.g., Klaas et al. (2001)], regardless of the possible multiple ones (§3.2). Notice that the adopted value is a typical one for interstellar medium whose spectral energy distribution often shows [e.g., Beckwith et al. (2000)], (Klaas et al., 2001), and 1.78 (Planck Collaboration et al., 2011b). It should be also noticed that the above value is not for dusts alone, but for whole the interstellar medium, therefore so-called dust-to-mass ratio is not needed to be multiplied.
The inferred and yield mean molecular hydrogen number density of cm-3, which is comparable to the critical density of CO (6–5) transition. Because of such a high density, we refer to the continuum source as “massive dense gas cloud”, which would be a scaled-up version of the galactic high-mass star-forming hot molecular cores (HMCs) [see e.g., Kurtz et al. (2000); Beltrán et al. (2005); Furuya et al. (2011)].
Furthermore, the value leads the mean column density of of cm-2, yielding mean optical depth of of the order of 0.01 – 0.1. Since bolometric luminosity of optically thin dust emission is given by where denotes Riemann’s zeta function and gamma function, we estimate that would range (0.4 – 4) . If the widely accepted conversion factor between infrared luminosity () and star formation rate (SFR) given by Eq.(4) in Kennicutt (1998) can be applied to the gas, we calculated SFR to be 0.1 yr-1 with another assumption of . Hereafter we summarize derived properties in Table 6.
Given the resultant value and a fractional abundance of [12C16O]/[H2] (Dickman, 1978), and assuming that the gas and dust are well-coupled, i.e., gas temperature () is represented by the of 50–70 K, we obtained radiation temperature () for the CO (6–5) transition to be 35–52 K and optical depth of the line of using non-LTE radiative transfer code of RADEX (van der Tak et al., 2007) for the most intense blueshifted component (Figure 3). In this calculations, we keep the practical approximation of the single-gas hypothesis, and adopted that the blue component has velocity width () of km s-1 in FWHM and the volume density estimated above. We also measured that it has the peak flux density of 70 mJy (Figure 3), which corresponds to K. The ratio of gives an estimate of beam-filling factor () for an optical thick line. From the definition, is calculated by where is the desired radius of the gas, we obtain pc by solving . Repeating the same analysis for the red, we obtained pc. Regardless of such a robust assessment, we confirmed that the inferred pc has a reasonable consistency with the estimate of 25 pc which is independently obtained from Figure 5 (§4.1). We confirmed that the number density of the gas, , inferred in the second paragraph of this subsection remains the same within a factor of 2–3. even if we calculate with the revised .
The and a 3D velocity dispersion of yield an “effective” virial mass which includes both thermal and non-thermal contributions to support the gas against self-gravity, of . Because of , the gas must be on the verge of star formation. Moreover it is fairly reasonable to conclude that formation of a star or a star cluster has already commenced in the gas because such a gas would gravitationally collapse within a few times of free-fall time of or within a dissipation time scale of turbulence of . Notice that our SED analysis adopts an implicit assumption that the 689 GHz continuum emission is purely due to reprocessed thermal emission from dust grains heated by internal sources. On the basis of the value, which is comparable to those of galactic giant molecular clouds, and the fact of , we further discuss that the putative heating source which is deeply embedded in the “massive dense gas cloud” is a “proto starcluster”.
5 Discussion
5.1 Nature of the Massive Dense Gas Cloud
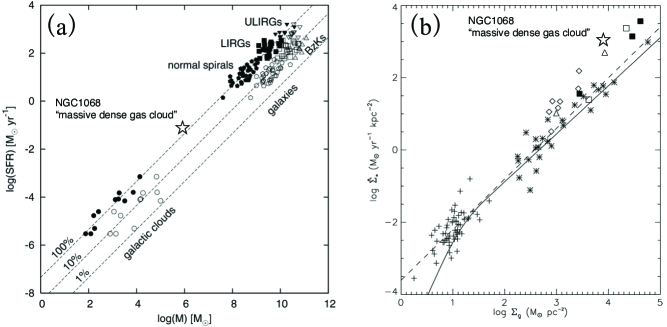
It is interesting to compare physical properties of “the massive dense gas cloud” in the vicinity of the nucleus of NGC 1068 with those in our Galaxy and other galaxies because it provides us with a crucial hint on its origin. For this purpose, we present a plot of SFR vs. in Figure 6a which is taken from Lada et al. (2012). Clearly, the estimated SFR with an order of 0.1 yr-1 and the gas mass of (Table 6) make the “massive dense gas cloud” unique in the diagram located at almost middle between the galactic star-forming clouds and in extra-galaxies. Moreover we point out that dense gas fraction of the cloud, , is almost 100%, as expected from the high value described above. The is comparable not only to those of intense star-forming gas clouds observed in ultraluminous infrared galaxies (ULIRGs) such as Arp 220, but also those of active star-forming gas clouds in our Galaxy.
Next, we investigate properties of the gas with the relationship between the SFR surface density, in unit of yr-1 kpc-2, and the surface gas density, in pc-2 (Figure 6b), which is originally produced by Krumholz & McKee (2005). The dashed line in the plot indicates the best-fit curve for the observed data (Kennicutt, 1998), and the solid one is the analytical prediction from the turbulence-regulated star formation model by Krumholz & McKee (2005) which adopts the following three assumptions; (1) star formation occurs in molecular clouds that are in supersonic turbulent state, (2) the density distribution within these clouds is lognormal, and (3) stars form in any subregion of a cloud that is so overdense that its gravitational potential energy exceeds the energy in turbulent motions. We argue that the “massive dense gas cloud” satisfies the three assumptions. First, the results of indicates the commence of star formation, which is suggested presumably to be under a turbulent status. Here is a virial mass that can be supported by sole thermal motion of for the 50–70 K gas where is a mean molecular weight (2.33 for [He] = 0.1 [H]). This leads a ratio of (Mach number)2 to be an order of (Table 6), suggestive of highly turbulent status. Here and are non-thermal and thermal velocity dispersions, respectively. The second assumption is not readily proven without a detailed analysis e.g., Figure 12a in Furuya et al. (2014), but the above will allow us to hypothesize it. The third one is supported by the multiple velocity components of the gas (§4.1).
Although we need to have higher resolution observations with higher sensitivity to assess physical properties of the gas on more firm ground, its star formation activity may be explained in terms of the turbulence-regulated star formation scenario. Last, it is interesting that the location of the massive dense gas in the plane is close to those of SSCs in ULIRGs.
5.2 Origin of the Massive Dense Gas Cloud
We investigated physical and star-formation properties of the “massive dense gas cloud” in NGC 1068. Now, we briefly address how such a star cluster is formed in the very nuclear region of the galaxy. A straightforward interpretation is that the “massive dense gas cloud” was formed through a shock compression of clouds via cloud-cloud collision (Habe & Ohta, 1992; Hasegawa et al., 1994; Inoue & Fukui, 2013) in the nuclear region. If this is the case, a question arises as how such a cloud collision was induced in the very nuclear region of NGC 1068.
Here we remind again that NGC 1068 has two distinct star forming regions around the nucleus; one is the so-called circumnuclear star forming region whose star formation activity has an age of 300 Myr, and the second one is the ring-like structure at 100 pc from the nucleus with an age of 30 Myr (Storchi-Bergamnn et al., 1996). This means that NGC 1068 experienced a couple of episodic star formation events in their circumnuclear regions. If we assume that NGC 1068 experienced a minor merger in the past, recurrent star formation events induced by cloud-cloud collision can be naturally understood because they are induced by the orbital sinking motion of a satellite galaxy to be merged (Mihos & Hernquist, 1994; Taniguchi & Wada, 1996). Before adopting such interpretation, a caution must be used because recent 3D magnetohydrodynamics simulations pointed out that a galaxy itself can form such massive dense gas clouds by means of collision of filamentary clouds threaded by magnetic fields (Inoue & Fukui, 2013) or by multiple compressions (Inutsuka et al., 2015) without merging of galaxies.
However, in the case of NGC 1068, some observational properties suggest a past minor merger, although any disturbed structures cannot be recognized around the galaxy (see Figure 1a). First, kpc-scale narrow line regions are distributed along an axis which is far from the rotational axis of the galactic disk (Cecil et al., 1990, 2002). Second, the molecular torus (0.1 – 1 pc scale) probed by H2O masers is observed as almost the edge-on geometry (Greenhill et al., 1996; Gallimore et al., 1996b, 2001), whereas the overall galactic disk is observed to be a nearly face-on geometry222 The observed optical minor-to-major axis ratio of 0.85 nominally gives the viewing angle toward the galactic disk of NGC 1068 to be \timeform32D (de Vaucouleurs et al., 1991). . Third, circumnuclear molecular gas clouds (100 pc scale) also show highly asymmetric structures (García-Burillo et al., 2014a). All these lines of evidence can be interpreted as that the dynamics of the nuclear region would be decoupled from that of the entire galactic disk. These characteristic properties would not be readily explained if the gas inflow in NGC 1068 were due to gradual angular momentum loss driven by such as spiral arms and a bar structure in the galactic disk. Therefore, the gas fueling driven by minor-merger seems to be the most natural mechanism for the case of NGC 1068 [see for a review of Taniguchi (1999)]. It should be noticed that a minor merger would occur by taking an inclined orbit with respect to the galactic disk of a host galaxy, making both circumnuclear and nuclear structures decoupled from the dynamics of the galactic disk. It is also reminded that the orbital period becomes shorter as the separation between the satellite and the host galaxy becomes smaller. Namely, the satellite galaxy is anticipated to interact or collide with the galactic disk more often over a certain period whose time scale becomes shorter as the merger stage proceeds (Mihos & Hernquist, 1994; Taniguchi & Wada, 1996). This explains the observed nature of episodic star formation events in NGC 1068. Considering the well-defined overall symmetric morphology of the outer disk, we propose a picture that NGC 1068 is experiencing the final stage of a minor merger. In this context, we argue that the newly found “massive dense gas cloud” having SFR of the order of 0.1 yr-1 may be formed by past gas collision(s) between/among nuclear gas clouds in the putative minor merger event.
Another merit of the minor merger scenario is that star clusters can be formed in the central region of a merger remnant (Mihos & Hernquist, 1994; Taniguchi & Wada, 1996). From an observational ground, massive star clusters known as super star clusters (SSCs) often form in the interacting regions of major mergers such as in luminous infrared galaxies (LIRGs) [e.g., Whitmore et al. (1993); Mulia et al. (2016)] and ULIRGs [e.g., Shaya (1994); Shioya (2001)]. In the case of Arp 220, some SSCs in the central region tend to be massive (e.g., ) than those located in the circumnuclear zone [e.g., : Shioya (2001)]. On the other hand, in the case of NGC 3256, one of luminous infrared galaxies (LIRGs), the typical mass of the nuclear star clusters is also (Mulia et al., 2016). On the other hand, as for minor mergers, such observations have not yet been made to date. In general, it is difficult to identify galaxies in a late phase of a minor merger because tidal features in the outer part of the galaxy were easily smeared out after several rotations of the galactic disk [e.g., Khan et al. (2012)]. Clearly, it requires to conduct systematic surveys for minor mergers in Seyfert galaxies, and then carry out high-resolution optical imaging to search for nuclear star clusters in these system.
It is important to note that the “massive dense gas cloud” appears to be associated with the nucleus of NGC 1068 at a projected separation of 14 pc. Since the nucleus, i.e., a SMBH, has a mass of (Kormendy & Ho, 2013), the SMBH system with accompanying the “massive dense gas cloud” is expected to behave as a binary with this SMBH, yielding an asymmetric gravitational potential. It is possible that this explains the complicated observational properties in the nuclear region of NGC 1068.
It is also worthwhile to note that the H2O maser disk (or ring) around the SMBH at the nuclear radio component S1 in NGC 1068 does not exhibit pure Keplerian rotation (Greenhill et al., 1996; Gallimore et al., 1996b, 2001; Murayama & Taniguchi, 1997), whereas that of NGC 4258 is explained almost perfectly by a Keplerian rotation (Miyoshi et al., 1995). As also discussed in (García-Burillo et al., 2016), the observed non-Keplerian motion could be a signature the so-called Papaloizou-Pringle instability (Papaloizou & Pringle, 1984), although it still remains possible that the non-Keplerian rotation may be attributed to the dynamical interaction with the star cluster.
AGNs are thought to be powered by the gravitational energy release through the gas accretion (i.e., the gas fueling) onto a SMBH resided in the nucleus of galaxies (Rees, 1984). Among several physical mechanisms for such efficient gas fueling, galaxy major mergers appear to be the most efficient mechanism to explain the triggering AGN phenomena (Sanders & Mirabel, 1996; Hopkins et al., 2008). If low-luminosity AGNs such as Seyfert galaxies can be powered by minor mergers with a satellite galaxy, it is possible to have a unified triggering mechanism for all types of AGNs (Taniguchi, 1999, 2013). Such future studies will provide us with unique opportunity to test our knowledge of star formation, which is established in the galactic “quiescent” clouds, in the extreme environments, such as in the nucleus of Seyfert galaxies and merging galaxies.
6 Concluding Remarks
To shed light on the nature of both circumnuclear and nuclear star formation in conjunction with the AGN activity, we analyzed ALMA archival data on both CO (6—5) line and 689 GHz continuum emission towards the archetypical nearby Seyfert galaxy NGC 1068 ( =15.9 Mpc). The ALMA data were originally taken by Garcia-Burillo and colleagues [see details of their observations in García-Burillo et al. (2014a)]. In this work, we focused on the 689 GHz local continuum peak in the vicinity of the nucleus, located at 14 pc (\timeform0.18”) NNE from the nucleus. Although the continuum peak of our interests was already found in the analysis by García-Burillo et al. (2014a), no discussion was given in their paper. Since a near-nuclear gas condensation such as the newly identified “massive dense gas cloud” is generally expected to physically affect the nuclear activity of a galaxy, we thoroughly investigated the physical properties of the source. Our findings can be summarized as follows.
-
1.
The 689 GHz continuum flux gives a gas mass and bolometric luminosity (see Table 6 for the values), allowing us to estimate to a SFR of 0.1 yr-1. We estimated size of the gas to be pc in diameter by means of two methods (§4.1 and §4.2). Because both results have a reasonable consistency, we obtained a mean H2 number density of cm-3. Therefore, this continuum peak can be identified as a “massive dense gas cloud”.
-
2.
The gas density is high enough to form a “proto starcluster” with a total stellar mass of . We argue that this gas cloud will evolve to a nuclear star cluster around the nucleus of NGC 1068.
-
3.
The gas cloud is identified as a missing link between galactic and extragalactic gas clouds in the previously known scaling relations of [a] SFR vs. gas mass proposed by Lada et al. (2012), and [b] surface density of gas vs. SFR density by Krumholz & McKee (2005). All the gaseous and star-formation properties (Table 6 and Figure 6) may be understood in terms of the turbulence-regulated star formation scenario proposed by Krumholz & McKee (2005).
-
4.
Since there are two stellar populations with the ages of 300 Myr and 30 Myr in the 100 pc-scale circumnulear region, we discuss that NGC 1068 has experienced at least three episodic star formation events with a tendency that inner star-forming region is young in its age of star formation. Given the evidence for the gas dynamics in the nuclear region, the nuclear region of NGC 1068 is suggested to be decoupled from that of the entire galactic disk. We propose that the gas inflow towards the nuclear region of the galaxy may be driven by a past minor merger.
We sincerely acknowledge the anonymous referee whose comments significantly helped to improve quality of our analysis and discussion. The authors sincerely acknowledge Charles Lada, Mark Krumholz, and the Copyright & Permissions Team of the AAS journal for their kind permission to use their figures in this work (Figure 6). We would also like to thank Michael R. Blanton for providing us with his SDSS color composite image of NGC 1068 shown in Figure 1a and Fumi Egusa for her generous support in handling the CO (6–5) image data. This work was financially supported in part by JSPS (YT; 23244041 and 16H02166). This paper makes use of the ALMA data of ADS/JAO.ALMA2011.0.00083.S. ALMA is a partnership of ESO (representing its member states), NSF (USA) and NINS (Japan), together with NRC (Canada), NSC and ASIAA (Taiwan), and KASI (Republic of Korea), in cooperation with the Republic of Chile. The Joint ALMA Observatory is operated by ESO, AUI/NRAO and NAOJ.

Properties of the “massive dense gas cloud” in the nuclear region of NGC 1068 Property Symbol Value Unit Section R.A. 02:42:40.714 h:m:s 3.1 Decl. :00:47.79 \timeformD: \timeform’: \timeform” 3.1 Size 2 pc 4.1, 4.2 Temperature∗*∗*footnotemark: 50 – 70 K 4.2 Gas plus dust mass 4.2 Column density cm-2 4.2 Surface gas density pc-2 5.1 Volume density cm-3 4.2 Bolometric luminosity (0.4 – 4) 4.2 Stellar mass a few 4.2 Star formation rate SFR (0.4 – 3.2) yr-1 4.2 Star formation rate density yr-1 kpc-2 5.1 (Mach number)2 (2 – 3) 4.2, 5.2 {tabnote} ∗*∗*footnotemark: Assumption.
References
- André et al. (1996) André, P., Ward-Thompson, D., & Motte, F. 1996, A&A, 314, 625
- Antonucci & Miller (1985) Antonucci, R. R. J., & Miller, J. S. 1985, ApJ, 297, 621
- Beckwith et al. (2000) Beckwith, S. V. W., Henning, T., & Nakagawa, Y. 2000, Protostars and Planets IV, 533
- Beltrán et al. (2005) Beltrán, M. T., Cesaroni, R., Neri, R., et al. 2005, A&A, 435, 901
- Bodenheimer (1995) Bodenheimer, P. 1995, ARA&A, 33, 199
- Cecil et al. (1990) Cecil, G., Bland, J., & Tully, R. B. 1990, ApJ, 355, 70
- Cecil et al. (2002) Cecil, G., et al. 12002, ApJ, 568, 627
- Crutcher (2012) Crutcher, R. M. 2012, ARA&A, 50, 29
- de Vaucouleurs et al. (1991) de Vaucouleurs, G., de Vaucouleurs, A., Corwin, H. G., Jr., et al. 1991, Third Reference Catalogue of Bright Galaxies. Volume I: Explanations and references. Volume II: Data for galaxies between 0h and 12h. Volume III: Data for galaxies between 12h and 24h., by de Vaucouleurs, G.; de Vaucouleurs, A.; Corwin, H. G., Jr.; Buta, R. J.; Paturel, G.; Fouqué, P.. Springer, New York, NY (USA), 1991, 2091 p., ISBN 0-387-97552-7, Price US 198.00. ISBN 3-540-97552-7, Price DM 448.00. ISBN 0-387-97549-7 (Vol. I), ISBN 0-387-97550-0 (Vol. II), ISBN 0-387-97551-9 (Vol. III)., I,
- Dickman (1978) Dickman, R. L. 1978, ApJS, 37, 407
- Furuya et al. (2009) Furuya, R. S., Kitamura, Y., & Shinnaga, H. 2009, ApJ, 692, L96
- Furuya et al. (2011) Furuya, R. S., Cesaroni, R., & Shinnaga, H. 2011, A&A, 525, A72
- Furuya et al. (2014) Furuya, R. S., Kitamura, Y., & Shinnaga, H. 2014, ApJ, 793, 94
- Gallimore et al. (1996a) Gallimore, J. F., Baum, S. A., O’Dea, C. P., & Pedlar, A. 1996a, ApJ, 458, 136
- Gallimore et al. (1996b) Gallimore, J. F., Baum, S. A., O’Dea, C. P., Brinks, E., & Pedlar, A. 1996b, ApJ, 462, 740
- Gallimore et al. (1996c) Gallimore, J. F., Baum, S. A., O’Dea, C. P., & Pedlar, A. 1996c, ApJ, 458, 136
- Gallimore et al. (2001) Gallimore, J. F., Henkel, C., Baum, S. A., et al. 2001, ApJ, 556, 694
- Gallimore et al. (2004) Gallimore, J. F., Baum, S. A., & O’Dea, C. P. 2004, ApJ, 613, 794
- García-Burillo et al. (2014a) García-Burillo, S., Combes, F., Usero, A., et al. 2014, A&A, 567, A125
- García-Burillo et al. (2014b) García-Burillo, S., Fuente, A., Hunt, L. K., et al. 2014, A&A, 570, A28
- García-Burillo et al. (2016) García-Burillo, S., Combes, F., Ramos, A., et al. 2016, ApJ, 823, L12
- Greenhill et al. (1996) Greenhill, L. J., Gwinn, C. R., Antonucci, R., & Barvainis, R. 1996, ApJ, 472, L21
- Habe & Ohta (1992) Habe, A., & Ohta, K. 1992, PASJ, 44, 203
- Hasegawa et al. (1994) Hasegawa, T., Sato, F., Whiteoak, J. B., & Miyawaki, R. 1994, ApJ, 429, L77
- Heckman & Best (2014) Heckman, T., & Best, P. 2014, ARA&A, 52, 589
- Hopkins et al. (2008) Hopkins, P. F., Hernquist, L., Cox, T. J., & Kereš, D. 2008, ApJS, 175, 356
- Imanishi et al. (2016) Imanishi, M., Nakanishi, K., & Izumi, T. 2016, ApJ, 822, L10
- Inoue & Fukui (2013) Inoue, T., & Fukui, Y. 2013, ApJ, 774, L31
- Inutsuka et al. (2015) Inutsuka, S.-i., Inoue, T., Iwasaki, K., & Hosokawa, T. 2015, A&A, 580, A49
- Izumi et al. (2016) Izumi, T., Nakanishi, K., Imanishi, M., & Kohno, K. 2016, MNRAS, 459, 3629
- Kennicutt (1998) Kennicutt, R. C., Jr. 1998, ARA&A, 36, 189
- Kennicutt & Evans (2012) Kennicutt, R. C., & Evans, N. J. 2012, ARA&A, 50, 531
- Khan et al. (2012) Khan, F. M., Preto, M., Berczik, P., et al. 2012, ApJ, 749, 147
- Khachikian & Weedman (1974) Khachikian, E. Y., & Weedman, D. W. D.1974, ApJ, 192, 581
- Klaas et al. (2001) Klaas, U., Haas, M., Müller, S. A. H., et al. 2001, A&A, 379, 823
- Kormendy & Ho (2013) Kormendy, J., & Ho, L. C. 2013, ARA&A, 51, 511
- Krumholz & McKee (2005) Krumholz, M. R., & McKee, C. F. 2005, ApJ, 630, 250
- Kurtz et al. (2000) Kurtz, S., Cesaroni, R., Churchwell, E., Hofner, P., & Walmsley, C. M. 2000, Protostars and Planets IV, 299
- Kulier et al. (2015) Kulier, A., Ostriker, J. P., Natarajan, P., Lackner, C. N., & Cen, R. 2015, ApJ, 799, 178
- Lada et al. (2012) Lada, C. J., Forbrich, J., Lombardi, M., & Alves, J. F. 2012, ApJ, 745, 190
- Liu et al. (2016) Liu, J., Eracleous, M., & Halpern, J. P. 2016, ApJ, 817, 42
- Lopez-Rodriguez et al. (2016) Lopez-Rodriguez, E., Packham, C., Roche, P. F., et al. 2016, MNRAS, 458, 3851
- Mezcua et al. (2015) Mezcua, M., Prieto, M. A., Fernández-Ontiveros, J. A., et al. 2015, MNRAS, 452, 4128
- Miyoshi et al. (1995) Miyoshi, M., Moran, J., Herrnstein, J., et al. 1995, Nature, 373, 127
- Mihos & Hernquist (1994) Mihos, C. J., & Hernquist, L. 1994, ApJ, 425, L13
- Mulia et al. (2016) Mulia, A. J.,Rupali, C., & Whitmorei, B. C. 2016, arXiv:1607.03577
- Murayama & Taniguchi (1997) Murayama, T., & Taniguchi, Y. 1997, PASJ, 49, L13
- Papaloizou & Pringle (1984) Papaloizou, J. C. B., , & Pringle, J. E. 1984, MNRAS, 208, 721
- Planck Collaboration et al. (2011b) Planck Collaboration, Abergel, A., Ade, P. A. R., et al. 2011, A&A, 536, A25
- Preibisch et al. (1993) Preibisch, T., Ossenkopf, V., Yorke, H. W., & Henning, T. 1993, A&A, 279, 577
- Rees (1984) Rees, M. J. 1984, ARA&A, 22, 471
- Sanders & Mirabel (1996) Sanders, D. B., & Mirabel, I. F. 1996, ARA&A, 34, 749
- Seyfert (1943) Seyfert, C. K. 1943, ApJ, 97, 28
- Shaya (1994) Shaya, E. J., et al. 1994, ApJ, 107, 1675
- Shioya (2001) Shioya, Y., Taniguchi, Y., & Trentham, N. 2001, MNRAS, 321, 11
- Schinnerer et al. (2000) Schinnerer, E., Eckart, A., Tacconi, L. J., Genzel, R., & Downes, D. 2000, ApJ, 533, 850
- Simkin et al. (1980) Simkin, S. M., Su, H. J., & Schwarz.M. P. 1980, ApJ,237. 404
- Storchi-Bergamnn et al. (1996) Storchi-Bergamnn, T. et al. 1996, ApJ, 472, 83
- Storchi-Bergamnn et al. (2012) Storchi-Bergamnn, T., et al. 2012, ApJ, 755, 87
- Taniguchi & Wada (1996) Taniguchi, Y., & Wada, K. 1996, ApJ, 469, 581
- Taniguchi (1999) Taniguchi, Y. 1999, ApJ, 524, 65
- Taniguchi (2013) Taniguchi, Y. 2013, Galaxy Mergers in an Evolving Universe, 477, 265
- van der Tak et al. (2007) van der Tak, F. F. S., Black, J. H., Schöier, F. L., Jansen, D. J., & van Dishoeck, E. F. 2007, A&A, 468, 627
- Vale et al. (2012) Vale, T. B., Storchi-Bergmann, T., & Barbosa, F. K. B. 2012, AGN Winds in Charleston, 460, 164
- Wang et al. (2012) Wang, J., Fabbiano, G., Karovska, M., Elvis, M., & Risaliti, G. 2012, ApJ, 756, 180
- Whitmore et al. (1993) Whitmore, B. C., et al. 1993, AJ, 106, 1354
- Wilson et al. (1991) Wilson, A. S., ,Helfer, T. T., Haniff, C. A. & Ward, M. J. 1993, ApJ, 381, 79
- Zhou et al. (1993) Zhou, S., Evans, N. J., II, Koempe, C., & Walmsley, C. M. 1993, ApJ, 404, 232