Detection of Possible Quasi-periodic Oscillations
in the Long-term Optical Light Curve of the BL Lac Object OJ 287
Abstract
Detection of periodicity in the broad-band non-thermal emission of blazars has so far been proven to be elusive. However, there are a number of scenarios which could lead to quasi-periodic variations in blazar light curves. For example, orbital or thermal/viscous period of accreting matter around central supermassive black holes could, in principle, be imprinted in the multi-wavelength emission of small-scale blazar jets, carrying as such crucial information about plasma conditions within the jet launching regions. In this paper, we present the results of our time series analysis of year-long, and exceptionally well-sampled optical light curve of the BL Lac OJ 287. The study primarily uses the data from our own observations performed at the Mt. Suhora and Kraków Observatories in Poland, and at the Athens Observatory in Greece. Additionally, SMARTS observations were used to fill in some of the gaps in the data. The Lomb-Scargle Periodogram and the Weighted Wavelet Z-transform methods were employed to search for the possible QPOs in the resulting optical light curve of the source. Both the methods consistently yielded possible quasi-periodic signal around the periods of and days, the former one with a significance (over the underlying colored noise) of . A number of likely explanations for such are discussed, with a preference given to a modulation of the jet production efficiency by highly magnetized accretion disks. This supports the previous findings and the interpretation reported recently in the literature for OJ 287 and other blazar sources.
Subject headings:
accretion, accretion disks — radiation mechanisms: non-thermal — galaxies: active — BL Lacertae objects: individual (OJ 287) — galaxies: jets1. Introduction
Quasi-periodic oscillations (QPOs) are routinely found in the X-ray light curves of Galactic binary systems (e.g., Remillard & McClintock, 2006, for a review). In radio-quiet AGN, the first detection of short ( h) X-ray QPOs was reported by Gierliński et al. (2008) for the narrow-line Seyfert 1 galaxy REJ 1034+396, followed by subsequent discoveries (e.g., Alston et al., 2015). In the optical domain, 5.2 yr periodicity has recently been found in the light curve of the radio-quiet quasar PG 1302-102 (Graham et al., 2015a), and some other analogous candidates have been identified (Graham et al. 2015b; see also Liu et al. 2015 for the case of the high-redshift radio-loud quasar PSO J334.2028+01.4075, and Zheng et al. 2016 for the radio-quiet quasar SDSS J0159+0105).
Short time scale quasi-periodic oscillations in optical or X-ray blazar light curves — with characteristic timescales of the orders of hours or even minutes — have been claimed in the past in several cases (e.g., Lachowicz et al. 2009 for PKS 2155-304; e.g. Rani et al. 2010 for S5 0716+714); these results have not been confirmed for the other periods in the same sources. On the other hand, analogous findings regarding quasi-periodicity in blazar light curves on longer timescales of months or years seem more robust, as summarized below.
At radio frequencies, harmonics with periods ranging from about one year up to several years or a decade have been reported for AO 0235 (Liu et al. 2006; see also Raiteri et al. 2001), PKS 1510-089 (Xie et al., 2008), NRAO 530 (An et al., 2013), and PKS 1156+295 (Wang et al. 2014, who confirmed the previous analyses by Hovatta et al. 2007, 2008). Also, King et al. (2013) reported persistent days periodicity in the 15 GHz light curve of J1359+ 4011. Similar results have been reported in the optical domain, including Sandrinelli et al. (2014, 2016), who confirmed the days period in the light curve of PKS 2155-304 claimed previously by Zhang et al. (2014), or Sandrinelli et al. (2015, 2016) who found marginally significant () periodicity in PKS 0537-441, OJ 287, 3C 279, PKS 1510-089 and PKS 2005-489, on timescales ranging from tens of days up to a few years (often in harmonic relations).
In the X-ray domain, Rani et al. (2009) found the days and days quasi-periodicity in AO 0235+164 and 1ES 2321+419, respectively. In the high-energy -ray regime, Sandrinelli et al. (2014) first detected the day period in the light curve of PKS 2155-304, most likely in a harmonic relation with the QPO found in the source at optical frequencies. More recently, Ackermann et al. (2015) reported a periodic behavior of the blazar PG 1553+113 with the characteristic timescale of 2.2 yr (similar to the one found at optical frequencies, but not in the radio domain).
BL Lac object OJ 287 (RA=08h 54m 48.87s, Dec= +20d 06m 30.64s and ) is by now one of the best studied blazars in the history. Sparsely monitored for more than a century, and intensely observed during the last years, it has become the most famous case of a blazar periodicity, with its double optical outbursts repeating every yr (Sillanpää et al., 1988; Hudec et al., 2013). Besides this, a number of authors have also claimed the presence of QPOs in the source at various timescales: a days quasi-periodicity for the source has been claimed at radio frequencies by Wu et al. (2006), and at optical frequencies by Pihajoki et al. (2013). Also Sandrinelli et al. (2016) reported to have found a marginally-significant () signal in the optical light curve of OJ 287 with the period of days, in addition to a much less significant one of 203 days.
In this paper, we present our analysis and results of a search for quasi-periodical oscillations in the year-long and exceptionally densely-sampled optical light curve of the blazar OJ 287, utilizing several widely-used statistical methods, including the Lomb-Scargle Periodogram, and Weighted Wavelet Z-transform. The results of the analysis are given below.
2. Observations and Data Reduction
We started optical monitoring of the blazar OJ 287 in September 2006 at three sites: Mt. Suhora Observatory of the Pedagogical University in Krakow (SUH), the Astronomical Observatory of the Jagiellonian University (KRK) and the Astronomical Observatory of the University of Athens (GR).
Here we report the data taken until the end of the 2014/2015 observing season. Most of the observations were gathered by taking a series of about 10 frames each night from which nightly averages were calculated. We obtained 562 points at SUH, 164 at GR and 123 at KRK. All three sites are equipped with CCD cameras and sets of wide band filters (Bessell, 1990). We took most of the data in the filter, occasionally also measuring the target colours at SUH and KRK. After calibrating images for bias, dark and flat-field (usually taken on the dusk or dawn sky) with IRAF, we extracted magnitudes with the C-Munipack (Hroch, 1998; Motl, 2004) software. All scientific images have been visually inspected. We used GSC 1400-222 () as the comparison star, for which the constancy was checked against the nearby star GSC 1400-444.
To fill some of the gaps in our observations, optical observations in the filter from the Small and Moderate Aperture Research Telescope System (SMARTS) were also included; the details of data acquisition and reduction procedures are discussed in Bonning et al. (2012). To match our observations with those from SMARTS, a small offset of 0.02 magnitude, comparable to instrumental errors, was subtracted from the SMARTS data. Further, the magnitudes were converted into flux units by using the zero points for the filter R given in Bessell et al. (1998).
3. Analysis and Results
3.1. The Light Curve
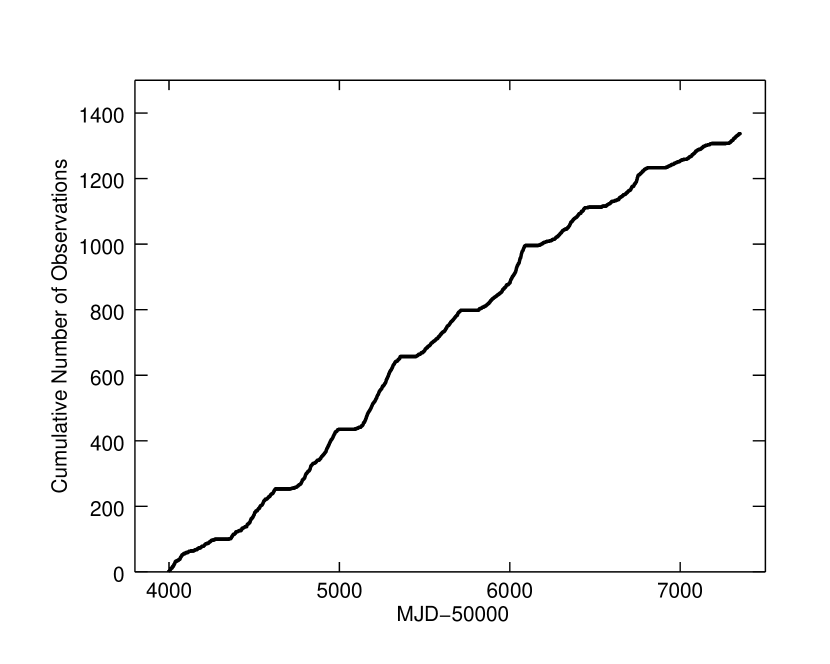
The analyzed optical light curve of the source spans about 9.2 years, from 2006 till 2015 (53997.590–57352.578 MJD), with a total of 1338 high quality observations. The mean brightness and the standard deviation during the observation period are 14.47 and 0.48 magnitudes, respectively. Excluding 9 summer gaps (for a total of 799 days) due to the source visibility, the average data sampling rate is 1.92/day. The data acquisition rate indicated by the cumulative number of observations along with the location of the summer gaps are shown in Figure 1. The observed nearly-linear increase in the cumulative number of observations with time, except for a few shorter time intervals manifesting in the graph as flat plateaus, is clearly an indicator of the highly regularly-sampled data collected for the whole observation epoch.
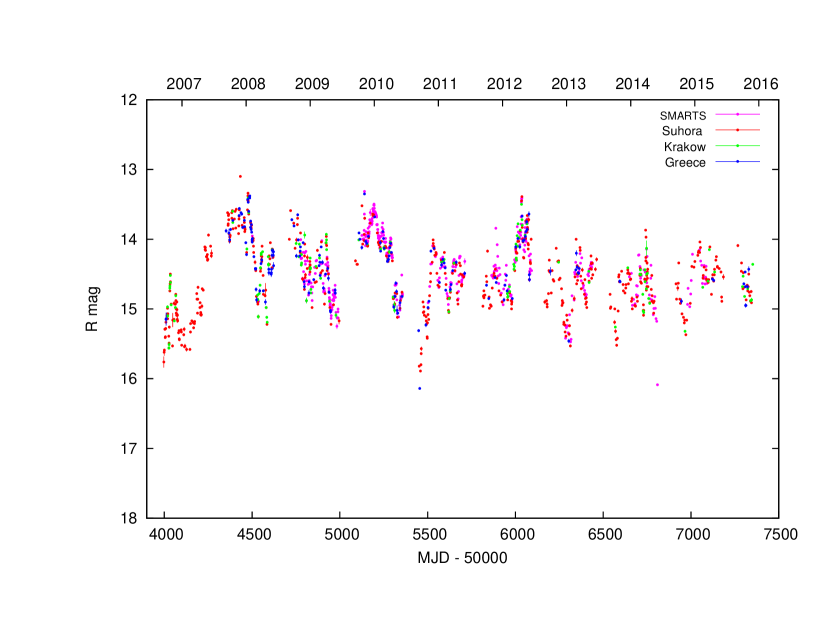
As revealed by the resulting source light curve presented in Figure 2, the blazar exhibits considerable variability during the period: the amplitude of peak-to-peak oscillations (Heidt & Wagner, 1996) is calculated to be 3.00 mag, while the fractional variability (Vaughan et al., 2003; Edelson et al., 2002) is %.
3.2. Periodicity Search
3.2.1 Lomb-Scargle Periodogram
The Lomb-Scargle Periodogram (LSP), one of the most widely used methods in the QPO analysis, modifies the periodogram such that the least-square fitting of sine waves of the form is minimized (Lomb, 1976; Scargle, 1982). The modified periodogram is expressed as
| (1) |
where is given by
| (2) |
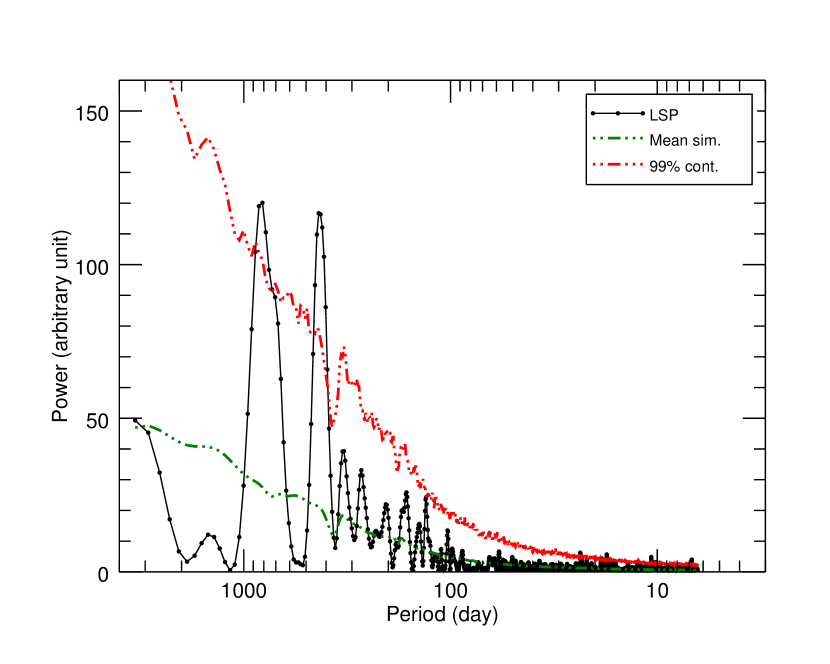
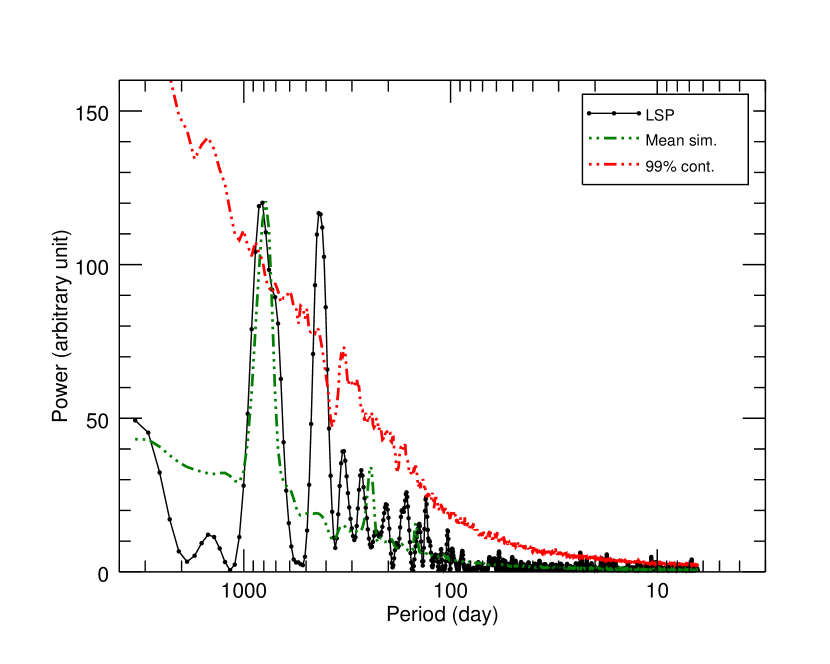
This weights the data-points and hence accounts for the problem with unevenly spaced dataset. The calculated LSP of the source light curve in the band is presented in Figure 3, which clearly shows two prominent features around the periods of and days. The associated uncertainties are the half-widths at half-maxima (HWHM) of Gaussian fits to the corresponding periodogram peaks after subtracting the mean periodogram due the colored noise determined from the Monte Carlo simulations, as explained in detail in section 4.
3.2.2 Weighted Wavelet Z-transform
Although the LSP method accounts for irregular spacing in a time series, the method does not take into account time fluctuations in the periodic signal information. In real astronomical systems, quasi-periodic oscillations may develop and evolve in frequency and amplitude over time. In such cases, the wavelet transform method proves to be a more useful tool, and indeed it is frequently employed in the analysis of blazar sources (e.g., Bhatta et al., 2013; Hovatta et al., 2008).
 |
 |
 |
 |
The method attempts to fit sinusoidal waves localized in both time and frequency domains, which can be scaled in frequency and shifted in time (Torrence & Compo, 1998). However, for unevenly spaced data the method still may not yield reliable results due to the fluctuations of the local number density of the data-points, an important parameter in the transform. As a result, a false time evolution of the characteristic frequency may be recovered. In this context, Foster (1996) suggested that the problem can be handled efficiently by rescaling of the wavelet functions such that they can be viewed as weighted projections on the trial functions , , and by the weight given as , where acts as a fine tuning parameter usually chosen around . This modified approach is known as the weighted wavelet Z-transform (WWZ). With and as weighted variations of the data and the model function, respectively, the WWZ power can be written as,
| (3) |
where is the effective number of the data points (for further details see Foster, 1996).
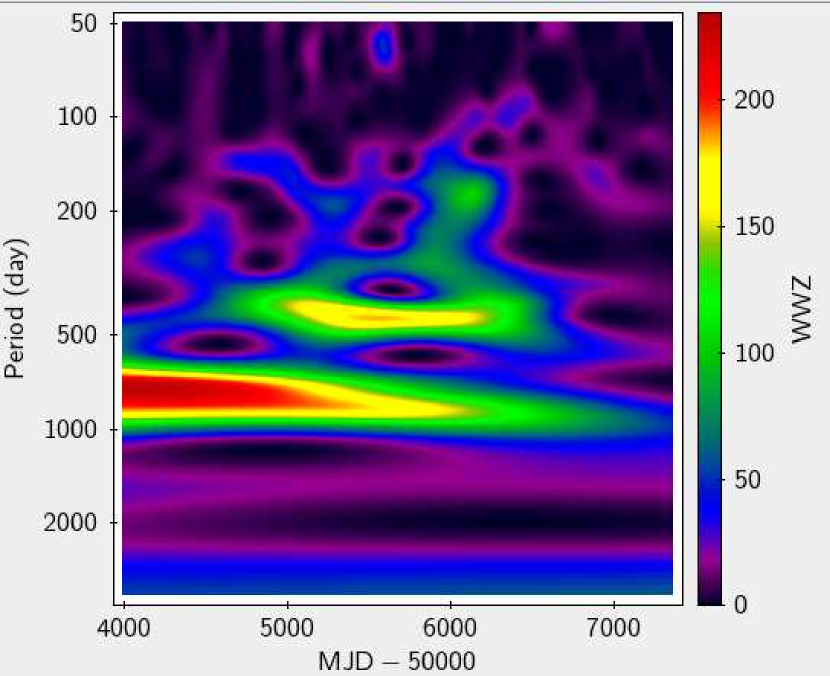
We computed the WWZ power of the band flux of OJ 287 as a function of time and characteristic period, with the conventional value , by using the WWZ software available at American Association of Variable Stars Observers (AAVSO)111https://www.aavso.org/software-directory. The top panel in Figure 4 presents the color-scaled WWZ power of the source in the time-period plane. The figure indicates that the power for the characteristic periods centered at days and days is highly significant, confirming the result obtained using the LSP. The uncertainties given here for the periods are evaluated as the means of the HWHMs of the Gaussian fits centered around a maximum power along the time () axis; these uncertainties are relatively large because the maximum powers “meander” along .
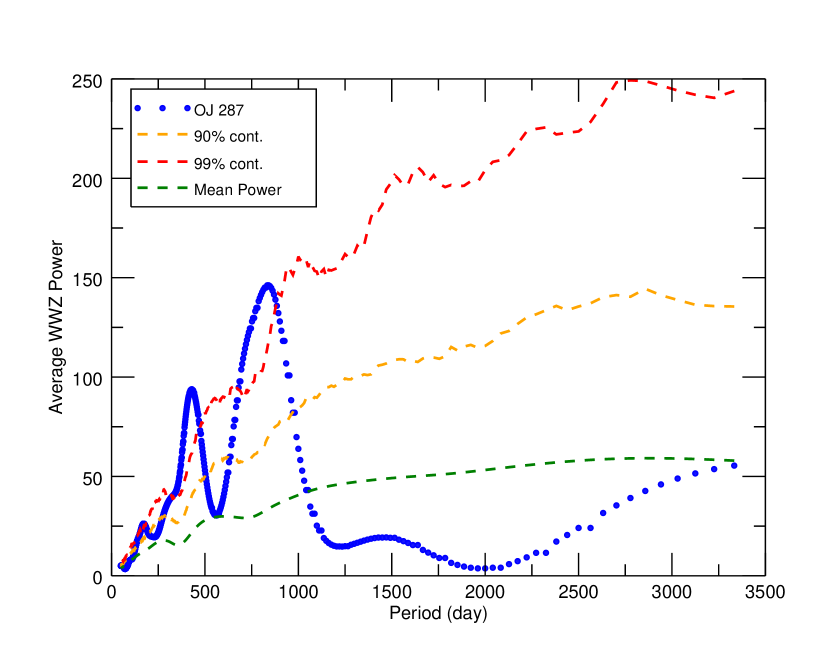
The QPO corresponding to the period of days starts from the beginning of the observing epoch and gradually dies out towards the end of the observations, although we note that the high power at the beginning could have been affected to some extent by the edge effects. On the other hand, a QPO behavior around the period of days shows up a little further from the start of the campaign, and decays well before the end of observations. The bottom panel of Figure 4 presents the average oscillation power at a given period. As shown, while in the lower frequency domain the signal seemed weaker and transitory, at higher frequencies the signal becomes more coherent and persistent.
4. Significance and Uncertainty Estimation
Although the above described LSP and WWZ methods are widely used in the time series analysis in astrophysics, the effects related to uneven sampling of a light curve — which can sometimes produce spurious peaks in the periodogram that can be mistaken for a real signal — should be analyzed in detail, especially when searching for QPO oscillations. In addition, there is a pitfall that blazar variability is, in general, of a colored noise type, with larger amplitude fluctuations at longer variability timescales; with such, high amplitude peaks in the lower frequency region of the periodograms can sometimes pose as QPO features (see in this context Press et al., 1978). Hence, in order to establish a robust significance of the potential QPO oscillations revealed by both the LSP and WWZ methods in OJ 287, both the uneven sampling of the source light curve and the colored noise-type behaviour of the blazar, have to be addressed carefully. This can be done by means of Monte Carlo (MC) simulations of a large number of red-noise light curves of the source, obtained by randomizing both the amplitude and the phase of the Fourier components, following Timmer & Koenig (1995).
First, in order to characterize the exact form of the underlying colored noise of the source (needed as an input for simulating the source light curves), we followed the power response method (PSRESP; see Uttley et al., 2002), which is widely used in modeling the AGN power spectra (e.g., Chatterjee et al., 2008; Edelson et al., 2014; Kapanadze et al., 2016; Stone et al., 2016; Bhatta et al., 2016). In short, the method attempts to fit the binned periodogram with a model PSD which maximizes the probability that the given model PSD can be accepted.
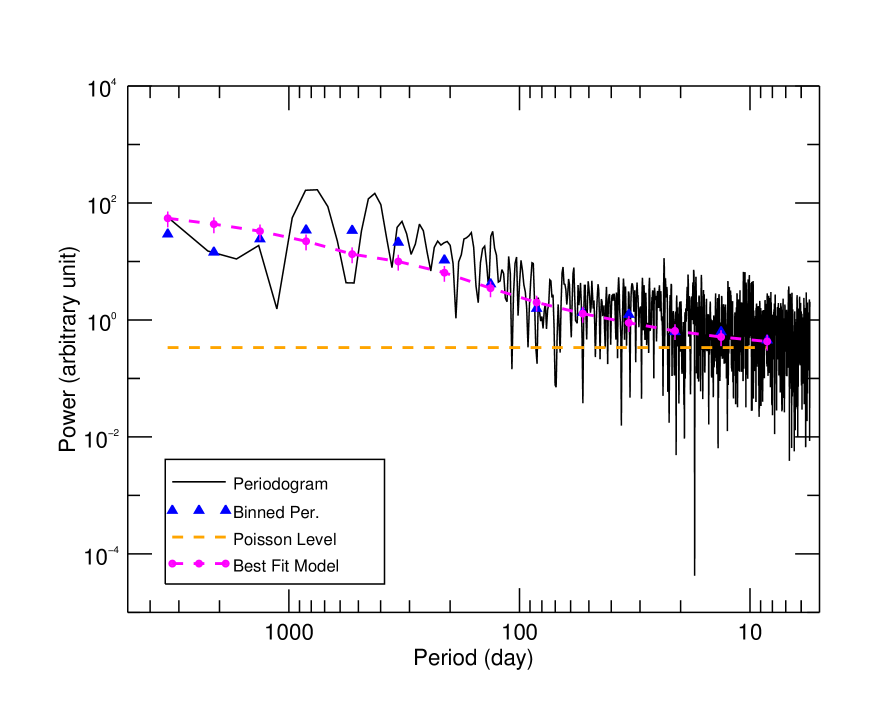
The discrete Fourier periodogram (DFP) of the light curve and the periodogran binned in logarithm frequency to reduce the scatter, are both presented in the left panel of Figure 5; the horizontal orange dashed line marks the Poisson noise level. We attempted to model the periodogram with a broken power-law of the form , where and correspond to the spectral slope and the break frequency, respectively. This particular “knee” model is designed to suppress the excess power at long variability timescales, given the fact that the power in the lower frequency domain of the periodogram cannot increase indefinitely, in accord with the analysis of the long-term optical light curve of PKS 2155+304 presented by Kastendieck et al. (2011), who found the characteristic break timescale in the blazar of the order of a few years.
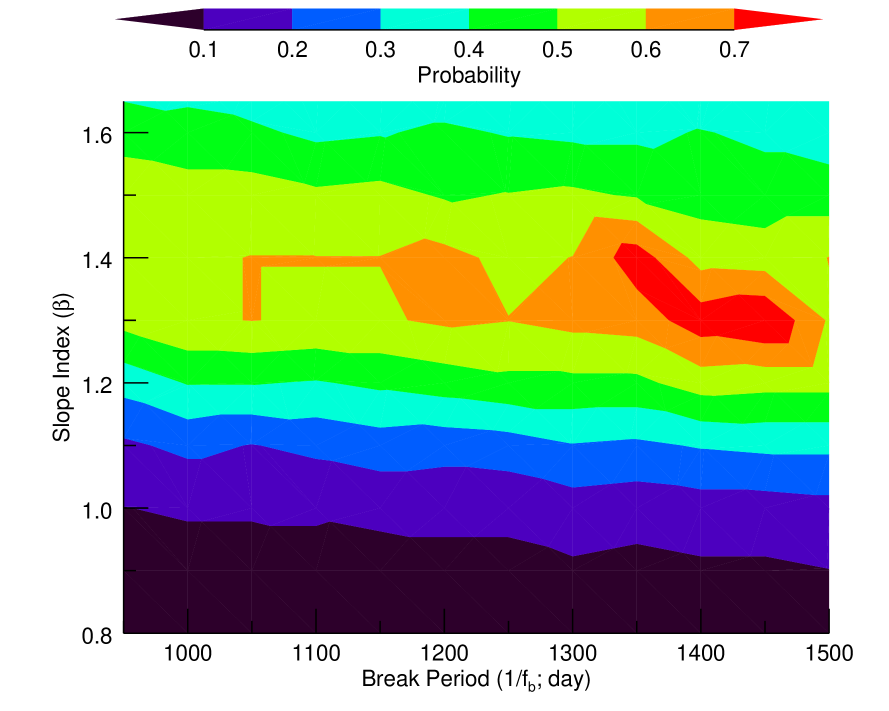
In order to determine the best fit PSD model, the observed binned discrete Fourier periodogram (blue triangles in the left panel of Figure 5) was compared with the mean periodogram of 1,000 simulated light curves for each pair of trial values of and . In particular, as a measure of a goodness of the fit, we calculated the probabilities of a model being accepted for 10 trial s ranging from 0.8 to 1.7 with the interval of 0.2, and 7 trial s ranging from 900 to 1500 days with the interval of 100 days (a total of simulated light curves). The resulting distribution of the probabilities for the corresponding trial break periods and PSD slopes are presented in the the color-coded contour plot in the right panel of Figure 5. The resulting best-fit model (the highest probability of 0.73), corresponding to days and , is represented by the magenta points connected by the dashed line in the left panel of Figure 5. The uncertainties associated with the slope and the break period were calculated here by taking the half the vertical and horizontal ranges of the highest probability () region denoted in the right panel of Figure 5 in red.
|
|
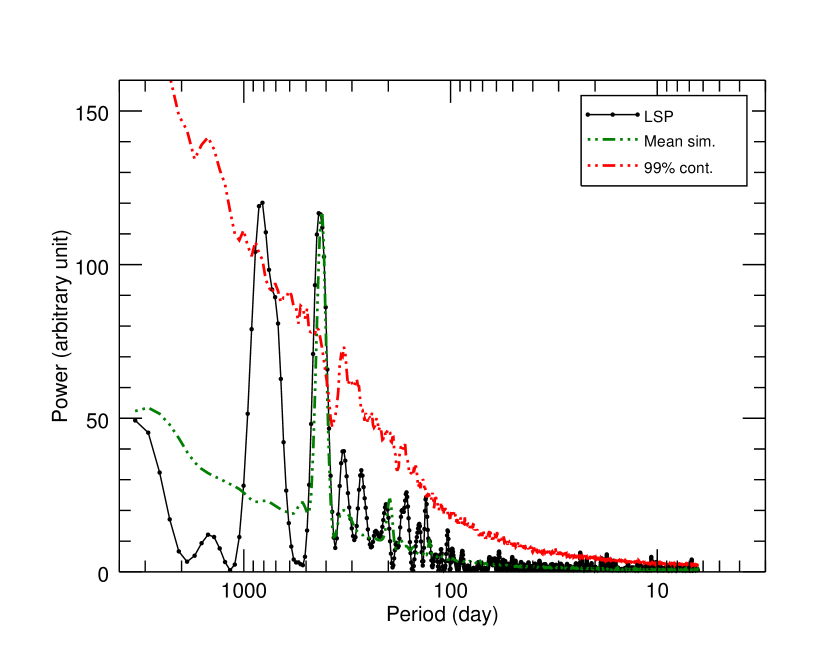
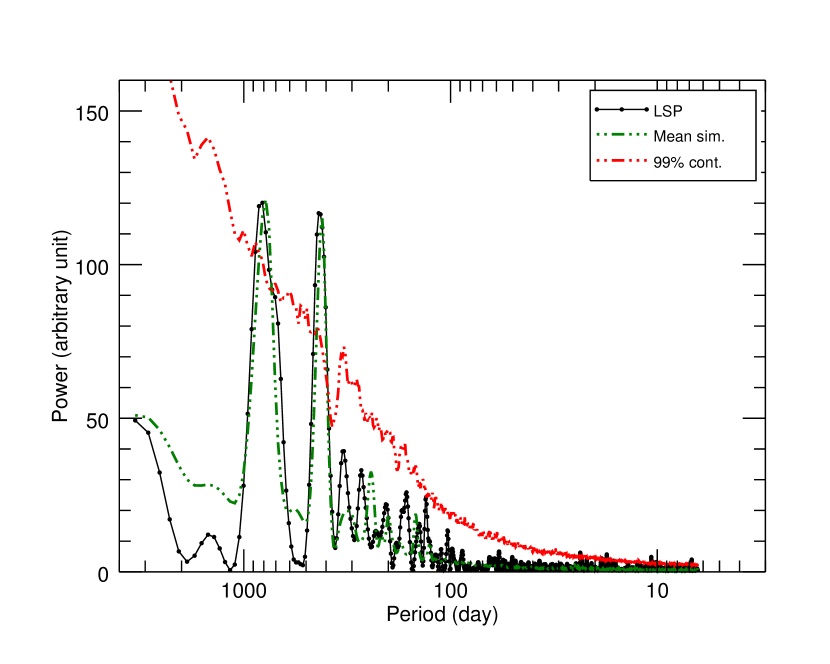
The best-fit PSD model described above was next used to simulate numerous light curves of the source, which were re-sampled according to the observed light curve. The distribution of such 1,000 light curves was studied to establish the significance of the peaks seen in the observed LSP; in particular the 99% significance contour was determined by the 99th percentile of a distribution of the power in the periodogram of the simulated light-curves. As given in Figure 3 (top-left panel), this significance turns out to be 99.8% and 99.3% for the peak around and days, respectively. In order to validate further the QPO detection, sinusoidal oscillations with days and day periods and a small amplitude () were superimposed on the previously generated light curves. The corresponding average periodograms resulting from simulations are given by green curves in Figure 3: 410 -day period only in the top-right panel, 780 -day period only in the bottom-left panel, and both periods together in the bottom-right panel.
Similarly, in order to establish the significance of the observed WWZ power of the light curve, the WWZ analysis were carried out on the 1,000 simulated light curves from the above described reference PSD model, and their distribution of WWZ power averaged over (time; day) in the considered frequency-space (alternatively period-space) were studied for the significance estimates. In particular, the observed average WWZ power was compared against the and confidence contour (th and th percentile at a given frequency) from the distribution of the -averaged WWZ power for the simulated light curves represented in the lower panel of the Figure 4 by the orange and red dashed-curves, respectively. The significance of the of the peaks centered around and were in this way evaluated as 99.7% and 99.0%, respectively.
5. Discussion and Conclusion
Periodicity in the light curves of blazar sources (and, more generally, of other types of AGN), may be related to the period of a perturbing object in a binary black hole system (eg Lehto & Valtonen, 1996; Graham et al., 2015a), or a jet precession caused by either closely orbiting binary black holes or warped accretion disks (see the discussion in, e.g., Graham et al., 2015b; Sandrinelli et al., 2016). Moreover, coherent helical/non-ballistic motions of relativistic blobs within blazar jets could be responsible for quasi-periodicity of blazar sources (e.g., Camenzind & Krockenberger, 1992; Mohan & Mangalam, 2015). Finally, jet modulation by various instabilities developing within the innermost parts of accretion disks, in principle, could result in quasi-periodic modulation of the observed jet emission (see the discussion in Liu et al., 2006; Wang et al., 2014).
In the specific context of OJ 287, previous claims of the detection of (quasi-)periodic oscillations on year-like timescales — besides the 60-year modulation advocated by Valtonen et al. (2006) and the 12-year cycle discussed by Sillanpää et al. (1988) — have been made by a number authors. For example, Hughes et al. (1998) identified a persistent oscillation in the radio light curve of the source, with a characteristic timescale of about days. This result was supported by the wavelet analysis attempted by Hovatta et al. (2008). More recently, using the data for the partly overlapping observing epoch considered in this paper, Sandrinelli et al. (2016) claimed to have detected d and d period in the NIR-optical and -ray light curve of the blazar, respectively. The detection of the same signal in more than one band — radio, optical, and -rays — enforce the physical relevance of the findings. It is therefore interesting to indicate at this point a possible analogy between a year-like periodicity we see in OJ 287 and the low frequency ‘C-type’ QPOs commonly found in Galactic X-ray binaries. These QPOs come in harmonic peaks sticking out of a power spectrum at frequencies just above/around the transition from the “white noise” to the “pink/red noise” segments of the PSDs, and are typically linked to the Lense-Thirring precession of the innermost parts of accretion disks (see, e.g., Stella & Vietri, 1998; Motta et al., 2011).
Considering a possible explanation for the observed QPOs in OJ 287, we note that since binary black holes have been claimed to shape the 12 yr periodicity of the optical light curve in the source (Valtonen et al. 2008; but see also Villforth et al. 2010 for a critical review), the same scenario could not account for the d period found in our analysis. Jet precession due to warped accretion disk, on the other hand, as well as a “grand-design” helical magnetic field in the OJ 287 jet, seem both in conflict with the erratic jet wobbling observed on parsec scales by Agudo et al. (2012) in the high-frequency radio domain at the time of our monitoring program. Hence we conclude that the likely explanation for the d period in the blazar (with the possibly accompanying d harmonic) could be a jet modulation by the innermost parts of the accretion disk. Interestingly, in the case of magnetically-arrested disks, the characteristic timescale of quasi-periodic oscillations in jet the production efficiency set by the rotating and unstable (“chocking”) magnetic field accumulated at the saturation level around the horizon of a spinning black holes, as seen in recent MHD simulations (Tchekhovskoy et al., 2011; McKinney et al., 2012), corresponds to tens/hundreds of the gravitational radius light-crossing times, s. This is of the correct order of magnitude assuming suggested by Valtonen et al. (2008) for OJ 287. Even so, in such a case the year-like periodicity claimed for radio and optical light-curves of other blazars (most likely hosting smaller black holes) would remain a puzzle, unless lower black hole spins are considered, allowing to accommodate longer timescales for smaller black hole masses.
References
- Ackermann et al. (2015) Ackermann, M., Ajello, M., Albert, A., et al. 2015, ApJ, 813, L41
- Agudo et al. (2012) Agudo, I., Marscher, A. P., Jorstad, S. G., et al. 2012, ApJ, 747, 63
- Alston et al. (2015) Alston, W. N., Parker, M. L., Markeviciute, J., et al. 2015, MNRAS, 449, 467
- An et al. (2013) An, T., Baan, W. A., Wang, J.-Y., Wang, Y., & Hong, X.-Y. 2013, MNRAS, 434, 3487
- Bessell (1990) Bessell, M. S. 1990, PASP, 102, 1181
- Bessell et al. (1998) Bessell, M. S., Castelli, F., & Plez, B. 1998, A&A, 333, 231
- Bhatta et al. (2013) Bhatta, G., Webb, J. R., Hollingsworth, H., et al. 2013, A&A, 558, A92
- Bhatta et al. (2016) Bhatta, G., Stawarz, Ł., Ostrowski, M., et al. 2016, ApJ, in press, arXiv:1608.03531
- Bonning et al. (2012) Bonning E., et al., 2012, ApJ, 756, 13
- Camenzind & Krockenberger (1992) Camenzind M., Krockenberger M., 1992, A&A, 255, 59
- Chatfield (2009) Chatfield C., 2009, The Analysis of Time Series: Sixth Edition
- Chatterjee et al. (2008) Chatterjee, R., Jorstad, S. G., Marscher, A. P., et al. 2008, ApJ, 689, 79
- Edelson et al. (2002) Edelson, R., Turner, T. J., Pounds, K., et al. 2002, ApJ, 568, 610
- Edelson et al. (2014) Edelson, R., Vaughan, S., Malkan, M., et al. 2014, ApJ, 795, 2
- Foster (1996) Foster G., 1996, AJ, 112, 1709
- Gierliński et al. (2008) Gierliński, M., Middleton, M., Ward, M., & Done, C. 2008, Nature, 455, 369
- Graham et al. (2015a) Graham, M. J., Djorgovski, S. G., Stern, D., et al. 2015a, Nature, 518, 74
- Graham et al. (2015b) Graham, M. J., Djorgovski, S. G., Stern, D., et al. 2015b, MNRAS, 453, 1562
- Heidt & Wagner (1996) Heidt J., Wagner S. J., 1996, A&A, 305, 42
- Hovatta et al. (2007) Hovatta, T., Tornikoski, M., Lainela, M., et al. 2007, A&A, 469, 899
- Hovatta et al. (2008) Hovatta T., Lehto H. J., Tornikoski M., 2008, A&A, 488,
- Hroch (1998) Hroch F., 1998, Proceedings of the 29th Conference on Variable Star Research, 30
- Hudec et al. (2013) Hudec, R., Bašta, M., Pihajoki, P., & Valtonen, M. 2013, A&A, 559, A20
- Hughes et al. (1998) Hughes P. A., Aller H. D., Aller M. F., 1998, ApJ, 503, 662
- King et al. (2013) King, O. G., Hovatta, T., Max-Moerbeck, W., et al. 2013, MNRAS, 436, L114
- Kapanadze et al. (2016) Kapanadze, B., Romano, P., Vercellone, S., et al. 2016, MNRAS, 457, 704
- Kastendieck et al. (2011) Kastendieck, M. A., Ashley, M. C. B., & Horns, D. 2011, A&A, 531, A123
- Lachowicz et al. (2009) Lachowicz, P., Gupta, A. C., Gaur, H., & Wiita, P. J. 2009, A&A, 506, L17
- Lehto & Valtonen (1996) Lehto, H. J., & Valtonen, M. J. 1996, ApJ, 460, 207
- Liu et al. (2006) Liu, F. K., Zhao, G., & Wu, X.-B. 2006, ApJ, 650, 749
- Liu et al. (2015) Liu, T., Gezari, S., Heinis, S., et al. 2015, ApJ, 803, L16
- Lomb (1976) Lomb, N. R. 1976, Ap& SS, 39, 447
- McKinney et al. (2012) McKinney, J. C., Tchekhovskoy, A., & Blandford, R. D. 2012, MNRAS, 423, 3083
- Mohan & Mangalam (2015) Mohan, P., & Mangalam, A. 2015, ApJ, 805, 91
- Motl (2004) Motl D., 2004, C-MUNIPACK, http://c-munipack.sourceforge.net/
- Motta et al. (2011) Motta, S.; Muñoz-Darias, T.; Casella, P.; Belloni, T.; Homan, J., 2011 MNRAS, 418, 2292M
- Pihajoki et al. (2013) Pihajoki, P., Valtonen, M., & Ciprini, S. 2013, MNRAS, 434, 3122
- Press et al. (1978) Press, W. H. 1978, Comments Astrophys., 7, 103
- Raiteri et al. (2001) Raiteri, C. M., Villata, M., Aller, H. D., et al. 2001, A&A, 377, 396
- Rani et al. (2009) Rani, B., Wiita, P. J., & Gupta, A. C. 2009, ApJ, 696, 2170
- Rani et al. (2010) Rani, B., Gupta, A. C., Joshi, U. C., Ganesh, S., & Wiita, P. J. 2010, ApJ, 719, L153
- Remillard & McClintock (2006) Remillard, R. A., & McClintock, J. E. 2006, ARA&A, 44, 49
- Sandrinelli et al. (2014) Sandrinelli, A., Covino, S., & Treves, A. 2014, ApJ, 793, L1
- Sandrinelli et al. (2015) Sandrinelli, A., Covino, S., & Treves, A. 2015, arXiv:1512.08801
- Sandrinelli et al. (2016) Sandrinelli, A., Covino, S., Dotti, M., & Treves, A. 2016, AJ, 151, 54
- Scargle (1982) Scargle, J. D. 1982, ApJ, 263, 835
- Sillanpää et al. (1988) Sillanpää A., Haarala S., Valtonen M. J., Sundelius B., Byrd G. G., 1988, ApJ, 325, 628
- Stella & Vietri (1998) Stella L., Vietri M., 1998, ApJ, 492, L59
- Stone et al. (2016) Stone, J. M., Marrone, D. P., Dowell, C. D., et al. 2016, ApJ, 825, 32
- Tchekhovskoy et al. (2011) Tchekhovskoy, A., Narayan, R., & McKinney, J. C. 2011, MNRAS, 418, L79
- Timmer & Koenig (1995) Timmer, J., & Koenig, M. 1995, A& A, 300, 707
- Torrence & Compo (1998) Torrence C. & Compo G. P., 1998, Bulletin of the American Meteorological Society, 79, 61
- Uttley et al. (2002) Uttley, P., McHardy, I. M., & Papadakis, I. E. 2002, MNRAS, 332, 231
- Valtonen et al. (2006) Valtonen M. J. et al., 2006, ApJ, 646, 36
- Valtonen et al. (2008) Valtonen, M. J., Lehto, H. J., Nilsson, K., et al. 2008, Nature, 452, 851
- Vaughan et al. (2003) Vaughan, S., Edelson, R., Warwick, R. S., & Uttley, P., 2003, MNRAS, 345, 1271
- Villforth et al. (2010) Villforth, C., Nilsson, K., Heidt, J., et al. 2010, MNRAS, 402, 2087
- Wang et al. (2014) Wang, J.-Y., An, T., Baan, W. A., & Lu, X.-L. 2014, MNRAS, 443, 58
- Wu et al. (2006) Wu, J., Zhou, X., Wu, X.-B., et al. 2006, AJ, 132, 1256
- Xie et al. (2008) Xie, G. Z., Yi, T. F., Li, H. Z., Zhou, S. B., & Chen, L. E. 2008, AJ, 135, 2212
- Zhang et al. (2014) Zhang, B.-K., Zhao, X.-Y., Wang, C.-X., & Dai, B.-Z. 2014, Research in Astronomy and Astrophysics, 14, 933-941
- Zheng et al. (2016) Zheng Z.-Y., Butler N. R., Shen Y. et al., 2016, ApJ, 827, 56