Stellar nuclei and inner polar disks in lenticular galaxies
Abstract
I analyze statistics of the stellar population properties for stellar nuclei and bulges of nearby lenticular galaxies in different environments by using panoramic spectral data of the integral-field spectrograph SAURON retrieved from the open archive of Isaac Newton Group. I estimate also the fraction of nearby lenticular galaxies having inner polar gaseous disks by exploring the volume-limited sample of early-type galaxies of the ATLAS-3D survey. By inspecting the two-dimensional velocity fields of the stellar and gaseous components with running tilted-ring technique, I have found 7 new cases of the inner polar disks. Together with those, the frequency of inner polar disks in nearby S0 galaxies reaches 10% that is much higher than the frequency of large-scale polar rings. Interestingly, the properties of the nuclear stellar populations in the inner polar ring hosts are statistically the same as those in the whole S0 sample implying similar histories of multiple gas accretion events from various directions.
1 Introduction
The outer gas accretion is now recognized as a main driver of disk galaxy evolution: neither prolonged star formation observed in disks of spiral galaxies, nor observed chemical abundances in their stars can be explained without continuous gas supply from outside. Indeed, the gas depletion time in nearby spirals is found to concentrate tightly around the value of only 2–3 Gyr (Bigiel et al., 2011) while the solar abundance ratios of the disk stellar populations imply the duration of the continuous star formation of more than 3 Gyr. The ‘G-dwarf paradox’ and the absence of the age-metallicity correlation in the thin stellar disk of our own Galaxy (Tosi, 1988; Chiosi, 1980) as well as the lowered effective oxygen yield in the disks of other spiral galaxies (Pilyugin et al., 2004; Dalcanton, 2007) require such accretion. However, direct observational findings of outer-gas accretion signatures are rather rare despite we expect these events to happen daily. Perhaps, it would be easier to search for consequences of outer gas accretion in early-type disk galaxies, namely, in S0s, where own gas of the galaxies, usually absent, does not prevent rather long-lived kinematical misalignments between the stellar disks and the accreted gaseous subsystems.
One of the most bright phenomena betraying the outer-gas accretion events are inner polar rings/disks of ionized gas which are embedded deeply into the bulge-dominated area. The presence of some minor species with a decoupled momentum can be explained only by such accretion. The first finding of the inner polar disk was noted by Bettoni et al. (1990) in SB0-galaxy NGC 2217 from the multiple long-slit cross-sections of this barred galaxy; the complex gas kinematics was explained by a strong warp of the gas rotation plane in the center of the galaxy, such that the central gas rotation proceeded in the plane orthogonal to the stellar rotation plane and also to the bar major axis. After the rise of the era of integral-field spectroscopy, the inner polar disks were found also in many unbarred galaxies, in particular: in Sb-galaxy NGC 2841 (Sil’chenko et al., 1997), in Sb galaxy NGC 7742 (Sil’chenko & Moiseev, 2006), and in isolated Sa-galaxy NGC 7217 (Sil’chenko & Afanasiev, 2000). They were detected exclusively through the kinematical analysis: the integral-field spectroscopy allowed to determine spatial orientations of the rotation axes both for the stellar and ionized-gas components, and if these rotation axes appeared to be mutually orthogonal, the presence of the inner polar disk could be claimed. Sometimes inner polar rings of the ionized gas could be seen as dust lanes aligned along the minor axes of the isophotes – in such a way we found 8 inner polar disks in lenticular galaxies whose high-resolution images were provided by the Hubble Space Telescope (HST) (Sil’chenko & Afanasiev, 2004). The first list of 17 galaxies which were claimed to possess inner polar disks was presented by Corsini et al. (2003).
Now a few dozen of the inner polar gaseous disks are already known, and the time for their statistics has come. Moiseev (2012) has assembled a list of 47 inner polar disks reported by various authors before 2012, and has presented some general properties of the inner polar disks and their host galaxies. Firstly, these disks are indeed polar: though all the gaseous rings whose rotation axes are inclined to the stellar rotation axes by more than 50 deg have been considered, the distribution of the mutual inclinations peaks strongly at 90 deg. Secondly, they can be met mostly in early-type galaxies: more than the half of all known inner polar disks belong to (mostly) lenticular and elliptical galaxies; however a few ones belonging to very late-type dwarfs are also known. Typical radii of the inner polar disks range from 0.2 to 2.0 kpc; the outer boundary is quite real betraying the relation of the inner polar disks to bulge-dominated areas, while the inner limit results from finite spatial resolution of the ground-based integral-field spectroscopy.
However, the review by Moiseev (2012) operated with a very heterogeneous sample of casual observational findings. A particular question remains unanswered: what is a frequency of the inner polar disks/rings in the whole ensemble of nearby lenticular galaxies? The answer would help to specify the geometry of the outer-gas accretion and so to identify its sources. In the case of isotropic accretion we would be able to estimate the theoretical fraction of inner polar rings by taking into account their dynamical evolution – precession and sinking to the main symmetry planes. If the theoretical estimates diverge with the observational statistics, it may be a hint to anisotropic accretion-source distribution – e.g. accretion from a single neighbor galaxy or multiple minor mergers from the satellite plane. I have undertaken a further attempt to increase the number of the known inner polar disks by using the possibility provided by the integral-field spectral data for a sample of early-type galaxies which have been obtained with the IFU SAURON (Bacon et al., 2001) in the frame of the ATLAS-3D survey (Cappellari et al., 2011a). The ATLAS-3D sample was volume-limited and complete above the absolute magnitude of , so I hoped to estimate reliably the frequency of inner polar disks in nearby lenticular galaxies from these data. The data of the ATLAS-3D survey are free for retrieving from the Isaac Newton Group (ING) Archive (CASU Astronomical Data Centre at the Institute of Astronomy, Cambridge) after the end of the proprietary period, and I have retrieved the raw data for about 150 lenticular galaxies, to analyze the kinematics of the stellar and ionized-gas components in the central parts of these galaxies and to search for new cases of the inner polar disks.
2 The data of the ATLAS-3D survey
The integral-field spectrograph SAURON was operating at the 4.2m William Herschel Telescope belonging to the Isaac Newton Group (ING) of telescopes on La Palma. It worked in so called ‘TIGER-mode’ giving about 1500 spectra simultaneously, each for a square element (‘spaxel’) from a (central) part of a galaxy. A total set of spectra covers the area of . The spectral range of the unit is rather narrow, 4800–5350 Å, and its spectral resolution is fixed since 2007 at about 4.3 Å.
There were two surveys of nearby early-type galaxies with the SAURON. The first one which started in 1999 and finished in 2004, involved 72 galaxies, among those 48 early-type ones and 24 spirals (de Zeeuw et al., 2002), The second one undertaken in 2007–2008 has added more early-type galaxies, including dwarfs, to complete the volume-limited ( Mpc) sample (Cappellari et al., 2011a). The total sample of early-type galaxies investigated in these two surveys includes 260 objects, and 200 of them are lenticular galaxies. For my analysis I have selected a subsample of 143 S0 galaxies which have been observed in 2007–2008, because the design of the SAURON has been successfully modified just before 2007. Due to a new volume-phase grating, the last data show much less shift of the spectral range over the field of view, and the problems of the first SAURON survey with the absorption lines H and Fe I5270 which are at the edges of the spectral range exposed (de Zeeuw et al., 2002; Kuntschner et al., 2006) are now overcome.
3 Analysis of the data
The raw data, both scientific frames and calibration frames, have been retrieved for these 143 S0 galaxies from the ING Archive and reduced in our manner which is described in my paper by Sil’chenko (2005). The spectra of a few dozen stars, mostly F–K giants, from the Lick standard list (Worthey et al., 1994) have been also reduced and used, firstly, for cross-correlation with the galactic spectra, to derive stellar line-of-sight (LOS) velocity fields and stellar velocity dispersion fields, and secondly, to establish a system of the Lick indices (Worthey et al., 1994) used for diagnostics of the stellar population properties. The Lick index system was checked for every observational run separately; an example of such calibration for the second half of the April-2007 observational run can be seen in Fig. 1. The intrinsic scatter of the stars around the calibration lines is about 0.2–0.3 Å, which is consistent with the declared accuracy of the standard star measurements in Worthey et al. (1994); our internal accuracy of the index measurements estimated from the repeatitive observations of the same stars is better than 0.05 Å. As one can see, the spectral range of the observations in 2007 was optimal to measure the indices H, Mgb, and Fe5270; and even Fe5335 for the zero redshift is calibrated appropriately though cannot be used in galaxies with non-zero redshifts. After subtracting stellar continuum, I extracted also emission-line spectra which were used to calculate LOS velocities of the ionized gas by measuring baricenter positions of the strongest emission line in this spectral range, [O III]5007 Å.

These LOS-velocity maps, both for the stellar () and ionized-gas () components, have been analyzed in the frame of tilted-ring approach in a particular modification by Alexei Moiseev (Moiseev et al., 2004, the DETKA software). This technique allows to estimate parameters of the spatial orientation of the rotation planes for both components, namely, the inclinations of the rotation planes and the position angles of lines of nodes, . After that, the mutual inclinations of the stellar and gaseous rotation planes have been calculated by using the following formula (Moiseev, 2012):
The equation has two solutions because typically we do not know which side of a galactic disk is closer to us. If for the regularly rotating stellar and gaseous components I obtain both possible mutual inclinations deg, I consider the circumnuclear ionized-gas component to be an inner polar disk. Please note that to determine the mutual inclination of two rotation planes, one needs to know not only kinematical misalignment, , but also inclinations of the planes to the sky plane, and . Only in the case when both planes are seen nearly edge-on, the term with is dominant; alternatively, if one of the planes is close to face-on, the kinematical misalignment does not take any part in the mutual inclination determination. It is just why I can state that the ATLAS-3D team (Krajnovic et al., 2011; Davis et al., 2011) has not established the presence of inner polar disks in the galaxies of their sample: they have measured only kinematical misalignment by applying the kinemetry approach, and only the statistics of this misalignment has been considered (Davis et al., 2011); while to determine the intrinsic orientations of the rotation planes, a full tilted-ring approach is needed. It is made in the present work.
 |
 |
 |
 |
Also the maps of the Lick indices H, Mgb, and Fe5270 calibrated into the standard Lick system and corrected for the stellar velocity dispersion broadening as described in Sil’chenko (2005), have been calculated for all the S0s without too strong emission lines in the centers – Å. If the emission lines were less strong, I have rectified the H indices by applying an approach proposed by Trager et al. (2000a): a correction of was added to the measured value of the H index to take into account contamination by ionized-hydrogen emission. As I have found earlier by studying a sample of S0 galaxies with the spectra in the full optical range (Sil’chenko, 2006), under this condition, Å, the H correction for the emission contamination is the same being calculated either through the empirical relation with [O III] or through the Balmer decrement applied to the H emission-line measurements. When emission lines are strong – Å, – the correction through [O III] works poorly. However, for a few galaxies with rather strong emission lines we have our own long-slit spectra covering the red spectral range – for NGC 3599 (Sil’chenko et al., 2010), for NGC 7743 (Katkov et al., 2011), and for IC 560 (Proshina et al., 2016). It makes possible to identify gas excitation mechanism by using the BPT-diagrams (Baldwin et al., 1981) and to determine the H correction for the emission through the H emission-line equivalent width estimates by applying a model Balmer decrement suitable for the particular excitation mechanism. If the gas is fully excited by young stars, the model from Burgess (1958) is used, and if LINER- or shock-like excitation is added, we apply the correction – the empirical Balmer decrement found by Stasinska & Sodré (2001) for a large sample of disk galaxies which corresponds to the mixed gas excitation.
After obtaining the corrected index maps, for the further analysis of the data, radial profiles of the Lick indices were derived by averaging indices over the rings with the width of one spaxel for the galaxies moderately inclined to the line of sight (with the isophote axis ratio less than 1.5), or by superimposing a digital slit with a width of (a compromise between the spatial resolution defined by the seeing and a necessity of sufficient signal-to-noise ratio) to derive major-axis index profiles for the strongly inclined galaxies. Since some brighter members of the sample have been already studied as concerning their Lick index distributions, I can compare the measurements of the Lick indices from the SAURON data with some well-calibrated long-slit spectral data. Figure 2 shows the comparison of the major-axis index profiles for two galaxies, NGC 5422 and NGC 6798, observed by us earlier with the reducer SCORPIO (Afanasiev & Moiseev, 2011) of the Russian 6m telescope and published elsewhere (Katkov et al., 2014b; Sil’chenko, 2013). Figure 3 shows the comparison of two variants of the Lick index profiles derived from the SAURON maps – ones averaged over full-azimuth rings for NGC 3412 and the others cut by the digital slit along the equator () for the edge-on galaxy NGC 4026 – with the long-slit data by Fisher et al. (1996). One can see an overall agreement of the profiles; so I conclude that I have succeeded to measure the Lick indices in the SAURON data without noticeable systematic shifts.
4 The characteristics of the nuclear and bulge stellar populations
In this section I present two separate sets of the data – the Lick indices for the nuclei, , and the Lick indices for the bulges taken over one-spaxel rings fixed at for slightly inclined galaxies, , or at the distance of from the nuclei along the minor axes for nearly edge-on galaxies. Mean (close to luminosity-weighted) parameters of the stellar populations were calculated in the frame of the evolutionary synthesis models of Simple Stellar Populations (SSP). The SSP-equivalent ages, metallicities, and magnesium-to-iron ratios were determined by confronting Mgb vs Fe5270 and H vs [MgFe52]; I confronted my index measurements to the SSP-models by Thomas et al. (2003) which are calculated for a set of the magnesium-to-iron ratios. The results – the Lick indices and the SSP-equivalent ages and metallicities – are given in the Tables 1 and 2. The typical internal (statistical) accuracy of the indices in the Tables 1 and 2 is around 0.1 Å; subsequently, the internal accuracy of the ages is 0.5 Gyr for young populations, Gyr, 1 Gyr for intermediate ages, Gyr, and 3 Gyr for older ones. The accuracy of the metallicities is about 0.1 dex.
| GalaxyaaGalaxy ID – N=NGC, U=UGC, I=IC, P=PGC | Eq. width of [OIII]5007,Å | H | Mgb | Fe5270 | T, Gyr | [Z/H], dex |
|---|---|---|---|---|---|---|
| N448 | 0.19 | 1.83 | 4.42 | 3.06 | 4 | +0.5 |
| N502 | 0.12 | 1.96 | 4.80 | 3.40 | 3 | +0.8 |
| N509 | 0.84 | 3.37 | 2.38 | 2.32 | 1 | +0.4 |
| N516 | 0.68 | 2.25 | 2.90 | 2.82 | 2 | +0.2 |
| N525 | 0.24 | 2.18 | 3.38 | 2.53 | 3 | +0.1 |
| N1121 | 0 | 1.59 | 4.98 | 2.71 | 14 | 0.0 |
| N1248 | 0.29 | 2.40 | 3.49 | 2.84 | 1.5 | +0.5 |
| N1289 | 0.73 | 1.92 | 3.70 | 2.86 | 2 | +0.4 |
| N1665 | 0.30 | 2.31 | 3.84 | 3.18 | 2 | +0.7 |
| N2481 | 0.41 | 1.55 | 4.39 | 3.04 | 5 | +0.4 |
| N2577 | 0.27 | 1.48 | 5.02 | 2.88 | 8 | +0.3 |
| N2592 | 0 | 1.49 | 5.11 | 2.82 | 12 | +0.2 |
| N2697 | 0.52 | 1.94 | 3.62 | 3.13 | 2 | +0.5 |
| N2698 | 0 | 1.84 | 4.93 | 2.77 | 5 | +0.4 |
| N2824 | 1.25 | 1.00 | 3.36 | 2.36 | 11 | -0.2 |
| N2852 | 0.96 | 1.31 | 5.20 | 2.56 | 5 | +0.3 |
| N2859 | 0.31 | 1.59 | 4.73 | 3.24 | 5 | +0.5 |
| N2880 | 0.28 | 2.20 | 4.08 | 3.06 | 2 | +0.7 |
| N2950 | 0.14 | 2.14 | 4.66 | 3.08 | 2 | +0.7 |
| N2962 | 0.80 | 1.37 | 5.23 | 3.24 | 4 | +0.7 |
| N3098 | 0.24 | 1.88 | 3.16 | 2.64 | 5 | -0.1 |
| N3182 | 3.67 | 1.56 | 4.88 | 3.36 | 3 | +0.8 |
| N3230 | 0.10 | 1.42 | 5.04 | 2.92 | 12 | +0.2 |
| N3245 | 0.62 | 0.24 | 4.73 | 2.66 | 15 | +0.0 |
| N3248 | 0.64 | 2.51 | 3.78 | 3.03 | 1 | +1.0 |
| N3301 | 0.44 | 2.10 | 3.45 | 2.48 | 3 | +0.1 |
| N3400 | 0.39 | 2.08 | 3.65 | 3.17 | 2 | +0.7 |
| N3412 | 0.18 | 2.15 | 3.58 | 2.90 | 2 | +0.4 |
| N3457 | 0.64 | 2.18 | 3.24 | 2.43 | 2 | +0.1 |
| N3458 | 0 | 1.59 | 4.53 | 2.95 | 11 | +0.2 |
| N3499 | 0.32 | 2.18 | 3.61 | 3.10 | 2 | +0.5 |
| N3530 | 0.17 | 1.79 | 3.56 | 2.77 | 6 | 0.0 |
| N3595 | 0.54 | 1.80 | 4.28 | 2.75 | 3 | +0.4 |
| N3599 | 2.93 | 1.95 | 3.37 | 2.89 | 2 | +0.4 |
| N3607 | 0.34 | 1.24 | 5.01 | 3.03 | 12 | +0.3 |
| N3610 | 0.34 | 2.10 | 4.32 | 2.83 | 2 | +0.7 |
| N3613 | 0 | 1.70 | 4.82 | 2.99 | 7 | +0.4 |
| N3619 | 1.19 | 1.49 | 4.56 | 3.18 | 3 | +0.7 |
| N3626 | 0.53 | 2.76 | 3.31 | 2.72 | 1 | +0.8 |
| N3630 | 0 | 1.77 | 4.61 | 3.22 | 5 | +0.5 |
| N3648 | 0.81 | 1.04 | 5.75 | 3.18 | 7 | +0.6 |
| N3658 | 0.10 | 2.03 | 4.65 | 3.47 | 3 | +0.8 |
| N3665 | 0.28 | 1.16 | 4.86 | 3.26 | 15 | +0.3 |
| N3674 | 0 | 1.57 | 4.94 | 2.97 | 10 | +0.3 |
| N3694 | 1.73 | 0.74 | 3.36 | 2.20 | 12 | -0.3 |
| N3757 | 0.35 | 1.70 | 3.65 | 2.90 | 5 | +0.15 |
| N3796 | 0.38 | 2.91 | 2.68 | 2.22 | 1.5 | +0.1 |
| N3838 | 0.17 | 2.02 | 3.90 | 2.68 | 3.5 | +0.2 |
| N3941 | 0.50 | 1.90 | 4.81 | 3.36 | 2 | +0.8 |
| N3945 | 0.50 | 1.45 | 5.35 | 3.44 | 4 | +0.8 |
| N4026 | 0.19 | 1.80 | 4.26 | 2.98 | 4 | +0.3 |
| N4036 | 1.42 | 0.16 | 5.42 | 2.87 | 15 | +0.2 |
| N4078 | 0.10 | 1.69 | 4.41 | 2.78 | 8 | +0.15 |
| N4111 | 0.58 | 2.11 | 4.09 | 2.91 | 2 | +0.7 |
| N4124 | 0.48 | 2.84 | 2.67 | 2.23 | 1.5 | +0.1 |
| N4143 | 0.62 | 0.85 | 5.60 | 3.04 | 15 | +0.3 |
| N4179 | 0.10 | 2.26 | 4.63 | 3.21 | 2 | +0.8 |
| N4191 | 0.71 | 1.79 | 4.32 | 3.01 | 2 | +0.7 |
| N4215 | 0.18 | 2.26 | 4.07 | 2.75 | 2 | +0.5 |
| N4233 | 0.84 | 1.69 | 5.30 | 3.32 | 3 | +1.0 |
| N4249 | 0.40 | 2.07 | 4.00 | 3.01 | 2 | +0.7 |
| N4251 | 0.20 | 2.03 | 4.15 | 2.99 | 3 | +0.5 |
| N4255 | 0.40 | 1.52 | 4.40 | 2.77 | 8 | +0.15 |
| N4259 | 0.38 | 1.83 | 4.12 | 2.80 | 4 | +0.3 |
| N4264 | 0.26 | 2.15 | 4.10 | 3.20 | 2 | +0.8 |
| N4267 | 0 | 1.60 | 5.09 | 2.95 | 9 | +0.4 |
| N4281 | 0.08 | 1.81 | 4.92 | 3.15 | 4 | +0.6 |
| N4324 | 1.33 | 1.83 | 4.00 | 3.23 | 5 | +0.4 |
| N4340 | 0.28 | 2.19 | 4.11 | 3.61 | 2 | +1.0 |
| N4342 | 0 | 1.42 | 5.53 | 2.97 | 12 | +0.4 |
| N4346 | 0.18 | 1.96 | 4.03 | 3.14 | 3 | +0.5 |
| N4350 | 0.13 | 1.37 | 4.66 | 3.19 | 12 | +0.3 |
| N4371 | 0.24 | 1.69 | 4.33 | 3.06 | 5 | +0.4 |
| N4377 | 0 | 1.86 | 4.31 | 2.77 | 6 | +0.2 |
| N4417 | 0.15 | 1.73 | 4.19 | 2.95 | 6 | +0.2 |
| N4429 | 0.38 | 1.75 | 4.75 | 3.04 | 3 | +0.6 |
| N4434 | 0.17 | 1.79 | 4.77 | 3.14 | 3 | +0.6 |
| N4442 | 0.35 | 1.59 | 5.58 | 3.35 | 4 | +0.8 |
| N4452 | 0.29 | 1.88 | 3.15 | 2.69 | 5 | 0.0 |
| N4461 | 0.11 | 1.95 | 5.10 | 3.56 | 3 | +1.0 |
| N4474 | 0.30 | 2.13 | 3.65 | 2.61 | 4 | +0.1 |
| N4476 | 0.35 | 2.40 | 2.75 | 2.23 | 2 | -0.05 |
| N4483 | 0.33 | 2.08 | 4.36 | 2.89 | 2 | +0.7 |
| N4503 | 0.15 | 1.92 | 4.99 | 3.57 | 3 | +1.0 |
| N4521 | 0.47 | 1.38 | 5.03 | 3.35 | 5 | +0.5 |
| N4528 | 0.32 | 2.13 | 3.73 | 2.45 | 3 | +0.2 |
| N4578 | 0.20 | 1.87 | 4.94 | 2.95 | 3 | +0.7 |
| N4596 | 0.15 | 1.37 | 4.66 | 3.19 | 12 | +0.3 |
| N4608 | 0.12 | 1.74 | 4.29 | 2.84 | 7 | +0.2 |
| N4612 | 0.44 | 2.77 | 3.41 | 3.01 | 1 | +1.0 |
| N4623 | 0.22 | 2.15 | 3.70 | 2.97 | 2 | +0.5 |
| N4624 | 0.27 | 1.58 | 4.74 | 3.12 | 5 | +0.4 |
| N4638 | 0.20 | 2.15 | 4.45 | 3.29 | 2 | +1.0 |
| N4643 | 0.36 | 1.97 | 4.50 | 3.02 | 3 | +0.7 |
| N4690 | 0.40 | 1.78 | 2.55 | 3.49 | 6 | 0.0 |
| N4710 | 0.78 | -0.27 | 3.02 | 2.11 | 1 | +0.8 |
| N4733 | 0.21 | 2.51 | 3.33 | 3.06 | 1.5 | +0.7 |
| N4753 | 0.21 | 1.98 | 4.23 | 3.51 | 3 | +0.8 |
| N4754 | 0.10 | 1.59 | 5.21 | 3.45 | 5 | +0.7 |
| N4762 | 0.26 | 0.75 | 4.90 | 3.02 | 3 | +0.6 |
| N5103 | 0.47 | 1.90 | 4.24 | 3.11 | 3 | +0.7 |
| N5342 | 0.16 | 1.19 | 4.96 | 2.70 | 15 | +0.1 |
| N5353 | 0.28 | 0.98 | 5.53 | 3.14 | 15 | +0.3 |
| N5355 | 0.33 | 5.23 | 2.26 | 2.14 | 1 | +0.7 |
| N5358 | 0.33 | 2.02 | 3.46 | 2.77 | 3 | +0.2 |
| N5422 | 0.60 | 1.29 | 4.80 | 3.16 | 7 | +0.4 |
| N5473 | 0 | 1.89 | 4.50 | 3.06 | 4 | +0.4 |
| N5485 | 0.23 | 1.61 | 4.84 | 2.93 | 6 | +0.4 |
| N5493 | 0.20 | 2.06 | 3.25 | 2.62 | 4 | 0.0 |
| N5507 | 0.53 | 1.11 | 6.04 | 3.04 | 9 | +0.5 |
| N5574 | 0.37 | 3.94 | 2.48 | 2.52 | 1 | +0.8 |
| N5611 | 0.28 | 1.94 | 4.03 | 2.70 | 4 | +0.2 |
| N5631 | 0.44 | 1.79 | 4.74 | 3.23 | 3 | +0.8 |
| N5687 | 0.15 | 1.77 | 4.85 | 3.50 | 4 | +0.8 |
| N5770 | 0.27 | 2.19 | 4.15 | 3.14 | 2 | +0.8 |
| N5839 | 0.13 | 1.52 | 5.02 | 3.32 | 6 | +0.5 |
| N5854 | 0.21 | 2.41 | 2.98 | 2.58 | 2 | +0.1 |
| N5864 | 0.22 | 1.95 | 3.80 | 3.10 | 3 | +0.5 |
| N5869 | 0 | 1.70 | 5.19 | 3.18 | 5 | +0.5 |
| N6010 | 0.29 | 2.09 | 4.54 | 3.07 | 2 | +0.7 |
| N6017 | 1.13 | 1.83 | 3.56 | 2.60 | 2 | +0.4 |
| N6149 | 1.06 | 1.63 | 3.98 | 2.16 | 3 | +0.1 |
| N6278 | 0.56 | 1.06 | 4.91 | 3.10 | 14 | +0.2 |
| N6703 | 0.23 | 1.58 | 4.88 | 3.26 | 5 | +0.5 |
| N6798 | 1.25 | 1.59 | 4.65 | 3.49 | 2 | +1.0 |
| N7693 | 0.19 | 4.71 | 1.89 | 2.18 | 1 | +0.8 |
| N7710 | 0.69 | 1.52 | 3.43 | 2.89 | 5 | +0.1 |
| N7743 | 5.5 | 2.03 | 3.30 | 2.54 | 1 | +1.0 |
| I560 | 3.17 | 1.97 | 2.48 | 2.22 | 1 | +0.2 |
| I598 | 0.54 | 2.65 | 2.59 | 2.35 | 1.7 | +0.1 |
| I719 | 0.39 | 1.68 | 3.45 | 2.77 | 6 | 0.0 |
| I782 | 0.35 | 2.92 | 3.11 | 2.44 | 1 | +0.7 |
| U4551 | 0.23 | 1.65 | 4.16 | 2.86 | 8 | +0.15 |
| U6062 | 0.25 | 1.50 | 4.45 | 3.22 | 8 | +0.3 |
| U8876 | 0.11 | 1.73 | 3.98 | 2.64 | 9 | 0.0 |
| U9519 | 0.38 | 3.04 | 2.77 | 2.36 | 1 | +0.3 |
| P28887 | 0.43 | 1.42 | 4.24 | 2.32 | 12 | -0.15 |
| P35754 | 0.78 | 1.97 | 3.75 | 2.32 | 2 | +0.2 |
| P42549 | 1.31 | 2.31 | 3.11 | 2.84 | 1 | +0.8 |
| P44433 | 0.34 | 1.92 | 4.13 | 2.76 | 3 | +0.3 |
| P50395 | 0.39 | 2.34 | 3.32 | 2.54 | 2 | +0.15 |
| P51753 | 0.88 | 1.65 | 3.52 | 2.59 | 4 | +0.1 |
| P54452 | 0.39 | 2.10 | 3.50 | 3.25 | 2 | +0.5 |
| GalaxyaaGalaxy ID – N=NGC, U=UGC, P=PGC, I=IC | (bul), ′′ | Its sourcebbThe sources of the are numerated as follows:
1 – Laurikainen et al. (2010) 2 – Laurikainen et al. (2005) 3 – Salo et al. (2015) 4 – Krajnovic et al. (2013) 5 – Méndez-Abreu et al. (2008) 6 – D’Onofrio (2001) 7 – Baggett et al. (1998) 8 – Il’ina & Sil’chenko (2012) |
Eq. width of [OIII]5007 | H | Mgb | Fe5270 | T, Gyr | [Z/H], dex | [Mg/Fe] |
|---|---|---|---|---|---|---|---|---|---|
| N448 | 4.7 | 4 | 0.10 | 1.72 | 3.10 | 2.54 | 10 | -0.2 | +0.1 |
| N502 | 3.5 | 8 | 0.20 | 1.62 | 3.79 | 2.91 | 8 | +0.1 | +0.1 |
| N509 | 2.9 | 8 | 0.55 | 2.08 | 2.50 | 2.48 | 3 | -0.1 | 0.0 |
| N516 | 2.9 | 8 | 0.41 | 1.83 | 2.84 | 2.65 | 5 | -0.1 | 0.0 |
| N525 | 3.7 | 4 | 0.25 | 1.96 | 3.15 | 2.11 | 6 | -0.2 | +0.3 |
| N2577 | 4.0 | 4 | 0 | 1.55 | 3.99 | 2.63 | 14 | -0.1 | +0.3 |
| N2698 | 2.2 | 4 | 0.10 | 1.72 | 4.53 | 2.89 | 8 | +0.2 | +0.3 |
| N2852 | 5.2 | 4 | 0.61 | 1.51 | 3.39 | 2.02 | 9 | -0.3 | +0.4 |
| N2859 | 4.7 | 3 | 0.33 | 1.51 | 4.13 | 2.82 | 10 | +0.1 | +0.2 |
| N2880 | 6.4 | 1 | 0.16 | 1.86 | 3.35 | 2.57 | 7 | -0.1 | +0.15 |
| N2950 | 5.1 | 1 | 0.50 | 1.76 | 3.28 | 2.57 | 4 | 0.0 | +0.1 |
| N2962 | 3,7 | 0.63 | 1.22 | 4.21 | 2.72 | 12 | 0.0 | +0.3 | |
| N3230 | 4.2 | 5 | 0.13 | 1.20 | 4.11 | 2.64 | 15 | -0.1 | +0.3 |
| N3245 | 1,5 | 0.15 | 1.42 | 3.88 | 2.65 | 15 | -0.15 | +0.2 | |
| N3248 | 4.4 | 3 | 1.03 | 1.84 | 2.76 | 2.37 | 3 | -0.05 | +0.1 |
| N3301 | 3,7 | 0.38 | 1.88 | 2.81 | 2.56 | 5 | -0.2 | 0.0 | |
| N3412 | 8.1 | 7 | 0.22 | 1.85 | 3.03 | 2.50 | 6 | -0.15 | +0.1 |
| N3599 | 3.4 | 3 | 1.35 | 1.88 | 2.72 | 2.64 | 2 | +0.1 | 0.0 |
| N3607 | 1,5 | 0.43 | 1.27 | 4.04 | 2.64 | 15 | -0.1 | +0.3 | |
| N3610 | 3.9 | 4 | 0.37 | 1.97 | 3.40 | 2.57 | 4 | +0.05 | +0.15 |
| N3613 | 7.6 | 4 | 0.12 | 1.67 | 4.08 | 2.64 | 9 | 0.0 | +0.3 |
| N3626 | 3,5 | 0.40 | 2.53 | 2.43 | 2.37 | 2 | 0.0 | 0.0 | |
| N3630 | 4,7 | 0.14 | 1.66 | 3.74 | 2.68 | 10 | -0.1 | +0.15 | |
| N3665 | 14.4 | 1 | 0.16 | 1.68 | 3.49 | 2.35 | 10 | -0.2 | +0.3 |
| N3674 | 2.9 | 4 | 0.41 | 1.40 | 3.88 | 2.53 | 13 | -0.2 | +0.3 |
| N3757 | 2.1 | 3 | 0.17 | 1.78 | 3.62 | 2.70 | 7 | 0.0 | +0.15 |
| N3838 | 2.1 | 4 | 0.34 | 1.98 | 3.41 | 2.52 | 4 | 0.0 | +0.2 |
| N3941 | 2,3 | 0.69 | 1.50 | 3.77 | 2.79 | 5 | +0.1 | +0.15 | |
| N3945 | 8.5 | 1 | 0.33 | 1.32 | 3.99 | 2.80 | 14 | -0.1 | +0.15 |
| N4036 | 8.9 | 5 | 0.47 | 1.37 | 3.86 | 2.64 | 12 | -0.1 | +0.2 |
| N4111 | 3.0 | 3 | 0.40 | 1.68 | 3.55 | 2.74 | 5 | +0.1 | +0.1 |
| N4124 | 8.0 | 4 | 0.42 | 2.60 | 2.62 | 2.39 | 1.5 | +0.1 | 0.0 |
| N4179 | 8.1 | 4 | 0.18 | 1.81 | 3.48 | 2.52 | 7 | -0.1 | +0.2 |
| N4233 | 4,5 | 0.54 | 1.01 | 4.06 | 2.58 | 15 | -0.1 | +0.3 | |
| N4267 | 4.4 | 1 | 0.12 | 1.55 | 4.21 | 2.65 | 12 | 0.0 | +0.3 |
| N4324 | 7.8 | 3 | 1.07 | 1.49 | 3.06 | 2.59 | 4 | 0.0 | 0.0 |
| N4340 | 4.4 | 2 | 0.23 | 1.72 | 3.33 | 2.99 | 7 | 0.0 | 0.0 |
| N4342 | 2.6 | 6 | 0.1 | 1.37 | 4.69 | 2.90 | 15 | +0.1 | +0.3 |
| N4346 | 3,4 | 0.34 | 1.90 | 3.38 | 2.70 | 4 | +0.1 | +0.1 | |
| N4350 | 3.0 | 4 | 0.12 | 1.32 | 4.62 | 2.87 | 15 | +0.1 | +0.3 |
| N4371 | 7.5 | 3 | 0.13 | 1.61 | 3.83 | 2.63 | 11 | -0.1 | +0.2 |
| N4377 | 5,7 | 0.12 | 1.65 | 3.35 | 2.51 | 11 | -0.2 | +0.15 | |
| N4417 | 5.3 | 4 | 0.17 | 1.64 | 3.48 | 2.44 | 11 | -0.2 | +0.2 |
| N4429 | 10.7 | 5 | 0.13 | 1.74 | 4.40 | 2.62 | 7 | +0.1 | +0.3 |
| N4434 | 4.7 | 4 | 0.24 | 1.59 | 3.36 | 2.59 | 10 | -0.15 | +0.1 |
| N4442 | 9.2 | 3 | 0.10 | 1.36 | 4.23 | 2.65 | 15 | -0.1 | +0.3 |
| N4461 | 4.4 | 3 | 0.19 | 1.69 | 3.91 | 2.77 | 7 | +0.1 | +0.15 |
| N4474 | 3.5 | 4 | 0.16 | 1.92 | 3.32 | 2.52 | 5 | -0.1 | +0.15 |
| N4476 | 8.2 | 6 | 0.52 | 2.02 | 2.12 | 1.72 | 5 | -0.4 | +0.15 |
| N4483 | 3.7 | 7 | 0.17 | 1.93 | 3.53 | 2.50 | 6 | -0.05 | +0.2 |
| N4503 | 9.7 | 3 | 0.21 | 1.60 | 3.94 | 2.67 | 10 | 0.0 | +0.2 |
| N4528 | 3.7 | 5 | 0.16 | 1.97 | 2.96 | 2.19 | 7 | -0.25 | +0.2 |
| N4578 | 4,5 | 0.42 | 1.94 | 3.36 | 2.49 | 4 | 0.0 | +0.15 | |
| N4596 | 2.8 | 2 | 0.31 | 1.17 | 4.23 | 2.80 | 15 | -0.05 | +0.2 |
| N4608 | 3.3 | 2 | 0.15 | 1.64 | 3.85 | 2.69 | 10 | 0.0 | +0.2 |
| N4623 | 11.9 | 4 | 0.26 | 2.02 | 3.00 | 2.49 | 4 | -0.1 | +0.1 |
| N4643 | 2,3 | 0.26 | 1.45 | 3.86 | 2.76 | 12 | -0.1 | +0.15 | |
| N4733 | 5.7 | 3 | 0.25 | 2.06 | 2.82 | 2.51 | 5 | -0.15 | 0.0 |
| N4754 | 1,3 | 0. | 1.39 | 3.93 | 2.79 | 15 | -0.1 | +0.15 | |
| N4762 | 3.1 | 4 | 0.24 | 1.77 | 4.13 | 2.82 | 5 | +0.2 | +0.2 |
| N5103 | 1.9 | 4 | 0.44 | 1.64 | 3.51 | 2.65 | 7 | -0.1 | +0.15 |
| N5342 | 1.7 | 4 | 0.16 | 1.27 | 4.01 | 2.25 | 15 | -0.2 | +0.4 |
| N5353 | 5.4 | 7 | 0 | 1.32 | 4.82 | 3.15 | 15 | +0.25 | +0.2 |
| N5355 | 7.4 | 3 | 0.40 | 2.11 | 2.43 | 2.22 | 4 | -0.2 | 0.0 |
| N5358 | 2.1 | 4 | 0.23 | 1.96 | 3.13 | 2.59 | 4 | 0.0 | +0.1 |
| N5422 | 3,4 | 0.53 | 1.70 | 3.78 | 2.32 | 6 | -0.1 | +0.4 | |
| N5473 | 1,3 | 0. | 1.73 | 4.26 | 2.74 | 9 | +0.1 | +0.4 | |
| N5485 | 1,5 | 0.16 | 1.67 | 4.10 | 2.54 | 9 | 0.0 | +0.3 | |
| N5493 | 5.9 | 1 | 0.14 | 1.73 | 2.36 | 2.17 | 13 | -0.4 | 0.0 |
| N5507 | 3,4 | 0.49 | 1.21 | 4.32 | 2.56 | 15 | -0.1 | +0.3 | |
| N5574 | 10.3 | 3 | 0.31 | 2.59 | 2.69 | 1.94 | 2 | -0.2 | +0.3 |
| N5611 | 2.1 | – | 0.18 | 1.62 | 3.17 | 2.32 | 12 | -0.3 | +0.2 |
| N5631 | 6.5 | 1 | 0.34 | 1.60 | 3.28 | 2.47 | 9 | -0.15 | +0.15 |
| N5687 | 4,5 | 0 | 1.55 | 3.97 | 2.75 | 14 | -0.1 | +0.2 | |
| N5854 | 4.9 | 3 | 0.45 | 2.46 | 2.94 | 2.56 | 1.5 | +0.2 | 0.0 |
| N5864 | 2.5 | 3 | 0.21 | 1.85 | 3.38 | 2.65 | 5 | 0.0 | +0.1 |
| N6017 | 7.6 | 4 | 0.455 | 1.94 | 2.17 | 1.88 | 5 | -0.4 | 0.0 |
| N6149 | 3.2 | 4 | 0.60 | 1.31 | 2.98 | 2.30 | 15 | -0.4 | +0.2 |
| N6278 | 3,4,5 | 0.25 | 1.22 | 4.60 | 3.12 | 15 | +0.2 | +0.2 | |
| N6703 | 4.2 | 1 | 0.22 | 1.44 | 3.94 | 2.99 | 11 | +0.1 | +0.1 |
| N7710 | 3.0 | – | 0.30 | 1.26 | 2.94 | 2.27 | +0.2 | ||
| N7743 | 1,3 | 1.05 | 1.99 | 2.59 | 2.77 | 2 | +0.1 | 0.0 | |
| I560 | 2.9 | 4 | 1.62 | 2.01 | 2.56 | 2.02 | 2 | -0.2 | +0.2 |
| U4551 | 3.4 | 3 | 0.42 | 1.48 | 3.70 | 2.58 | 10 | -0.1 | +0.2 |
| P28887 | 3.7 | 4 | 0.37 | 1.21 | 2.54 | 1.74 | +0.3 | ||
| P35754 | 3.1 | 4 | 0.78 | 1.44 | 2.94 | 1.99 | 9 | -0.35 | +0.3 |
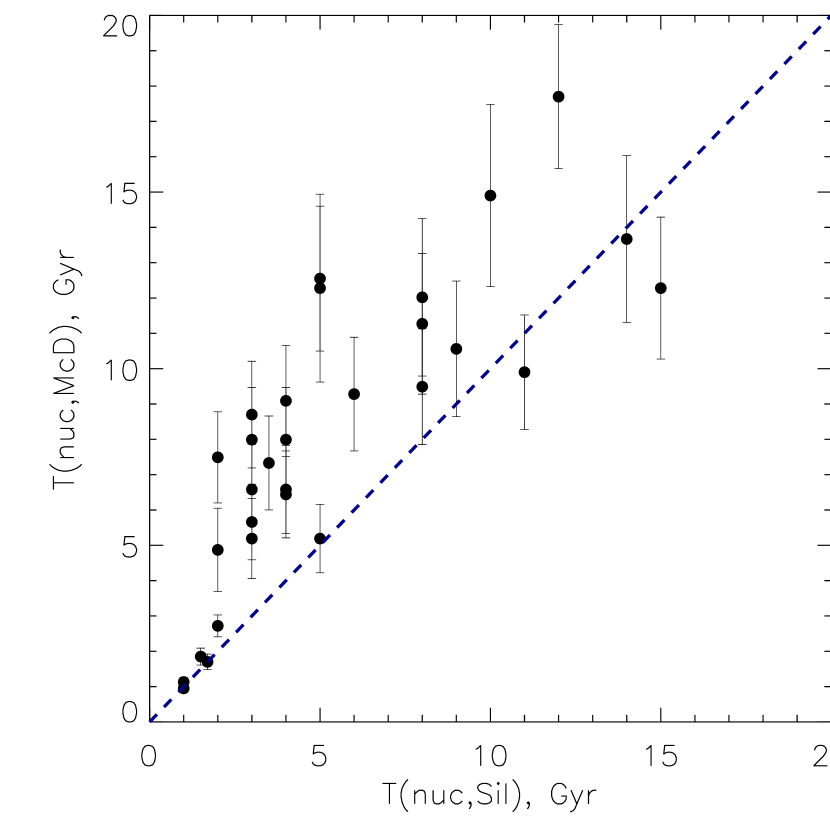
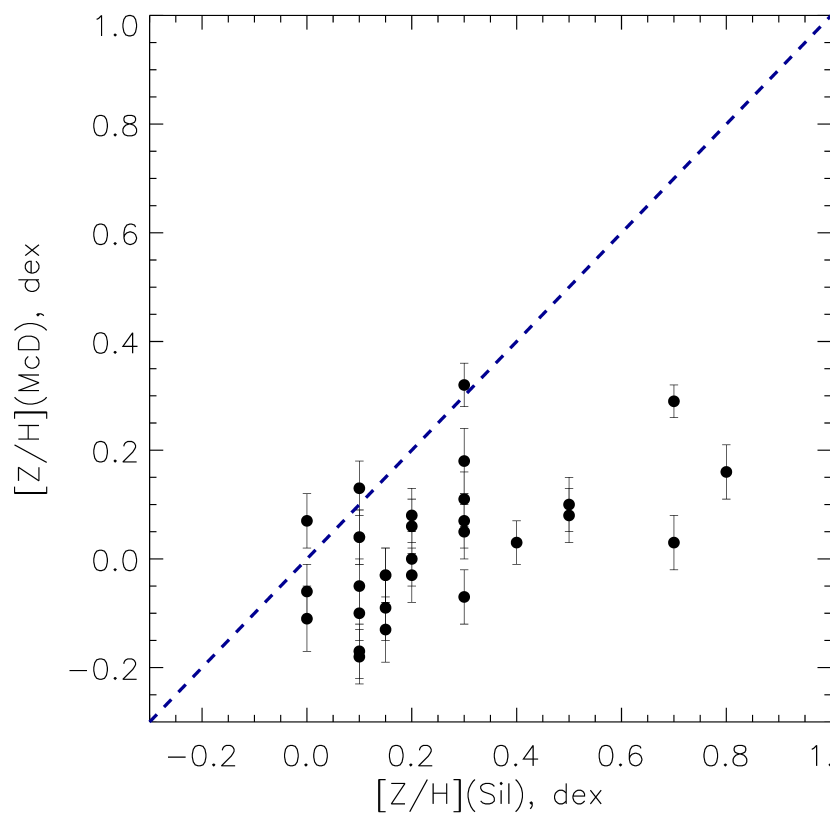
The team of the ATLAS-3D survey made its own investigation of the stellar population properties of the same targets (McDermid et al., 2015). However they considered the stellar population properties within apertures centered onto the nuclei, with radii taken at fixed fractions of the totally measured (integrated) effective radius – , , . Meantime the lenticular galaxies that constitute the dominant part of the ATLAS-3D survey consist of at least two large-scale components with different properties and evolution, bulges and disks, having very different ratios of their own effective radii. So sometimes the characteristics measured by the team of ATLAS-3D within the and apertures relate to the bulges, sometimes – to the disks, without specifying their attribution by McDermid et al. (2015). My investigations of the radially resolved properties of stellar populations in S0 galaxies have revealed quite different evolution of the S0 galaxy constituents – stellar nuclei, bulges, and the disks (Sil’chenko, 2006, 2008; Sil’chenko et al., 2012), – so I prefer to analyze separately the stellar nuclei and the bulges when I operate with the SAURON data. I can compare directly my estimates with the results of McDermid et al. (2015) only in one case: if I take my measurements for the nuclei and the measurements by McDermid et al. (2015) – for , after selecting the subsample for comparison by putting a limit onto the integrated effective radius presented in Cappellari et al. (2011a): . This limit allows to consider the apertures for the comparison galaxies as close to the size of the resolved spatial element (seeing), given . The comparison of the nuclear stellar population properties is presented in Fig. 4. The ages estimates are well correlated though for intermediate ages, Gyr, a shift by about 4 Gyr can be noted, the ages by McDermid et al. (2015) looking older. Subsequently, the metallicity estimates are also correlated, but my estimates are higher by some 0.2 dex; three galaxies with [Z/H] are strongly off, but such high metallicities are absent in the model set by Thomas et al. (2003) and are perhaps improperly extrapolated. Taking into account the fact that the indices were confronted by me and by McDermid et al. (2015) to quite different SSP-models, and that the correction of the H indices for the emission was made through quite different approaches, the divergence of the central stellar population parameters obtained so far may be attributed to this fact. The difference in both models and H correction for the emission contamination is significant. Concerning the former issue, I use the models by Thomas et al. (2003) which are based on the classical fitting functions for stellar Lick indices from Worthey et al. (1994), with the inserted dependence on abundance ratios from Tripicco & Bell (1995), and on the fuel consumption theorem approach (Renzini & Buzzoni, 1986); while McDermid et al. (2015) use the Schiavon (2007) models, which are based on the fitting functions renewed by Schiavon (2007) and on the theoretical isochrone (so called ‘conventional’) approach. Concerning the index H correction, I use the empirical calibration of the H emission line through the [O III]5007 emission line from Trager et al. (2000a), while McDermid et al. (2015) used the approach proposed by the SAURON team (Sarzi et al., 2006) which allows to derive full emission-line spectra by subtracting the preliminary fitted full spectrum of the stellar populations.
 |
 |
 |
 |
 |
 |
As for the parameters of the stellar populations in the bulges (Table 2), they are obtained not for the whole sample but only for the galaxies whose are within the field of view of the SAURON, and also can be resolved with the typical seeing quality of ; in other words, to study the bulge stellar population properties, I have selected from the ATLAS-3D sample only the S0 galaxies with . The team of ATLAS-3D had published their own decomposition of the galactic surface brightness profiles into the sums of a Sersic bulge and an exponential disk (Krajnovic et al., 2013). But the decomposition was made only for a part of the sample, and by analyzing only one-dimensional profiles derived from the SDSS data. They failed to separate two large-scale components in some obvious cases of S0 galaxies with noticeable disks and bulges (NGC 3607, NGC 3665, NGC 4036, NGC 5355). To estimate the bulge effective radii in the small S0 galaxies NGC 5611 and NGC 7710 where the analysis of Krajnovic et al. (2013) has not revealed any disks, I have undertaken my own decomposition of the SDSS one-dimensional surface-brightness profiles and have succeeded to derive the parameters separately for the bulges and for the disks. To involve more certain data on the bulge’s effective radii, I have searched for results of 2D decomposition, by considering the decompositions made in the near-infrared light as the better ones. Also, other literature sources were searched for the galaxies which were not involved into photometric surveys dedicated to the 2D surface-brightness decomposition. Finally I have collected the bulge’s effective radius measurements for the S0 galaxies of the ATLAS-3D sample from 8 different sources listed in the Table 2. When a galaxy was investigated in several works, and the derived were close, I took the averaged value which is given in the Table 2 with a corresponding estimate of the scatter. When all the results for were strongly different, I took the estimates obtained by the 2D NIR decomposition – from Laurikainen et al. (2010) or from Salo et al. (2015). The adopted values of are listed in the Table 2 with the corresponding references to their sources.
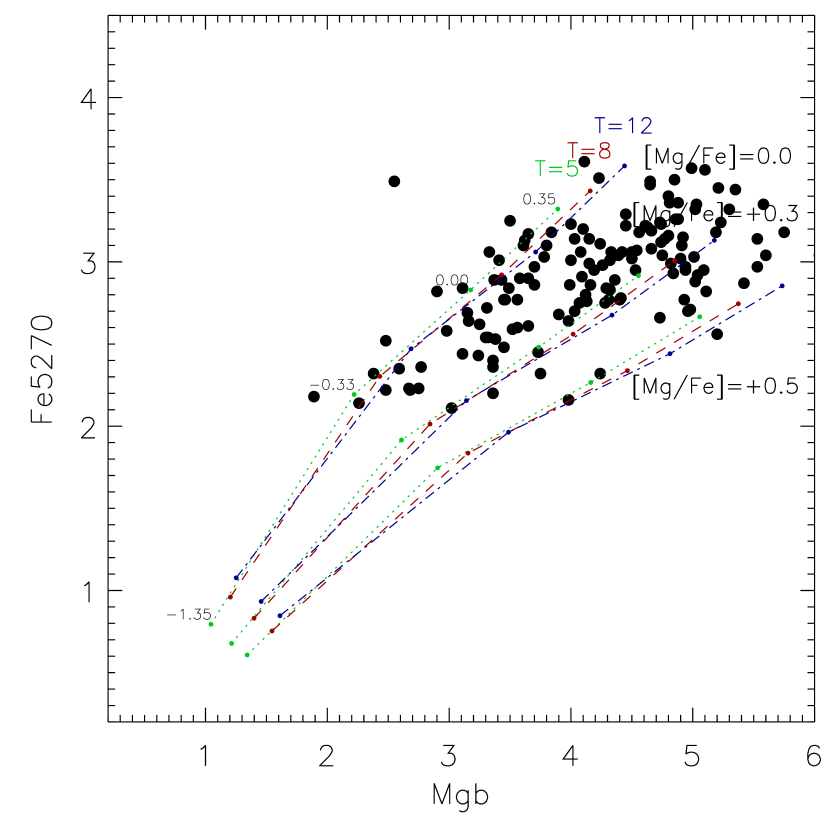
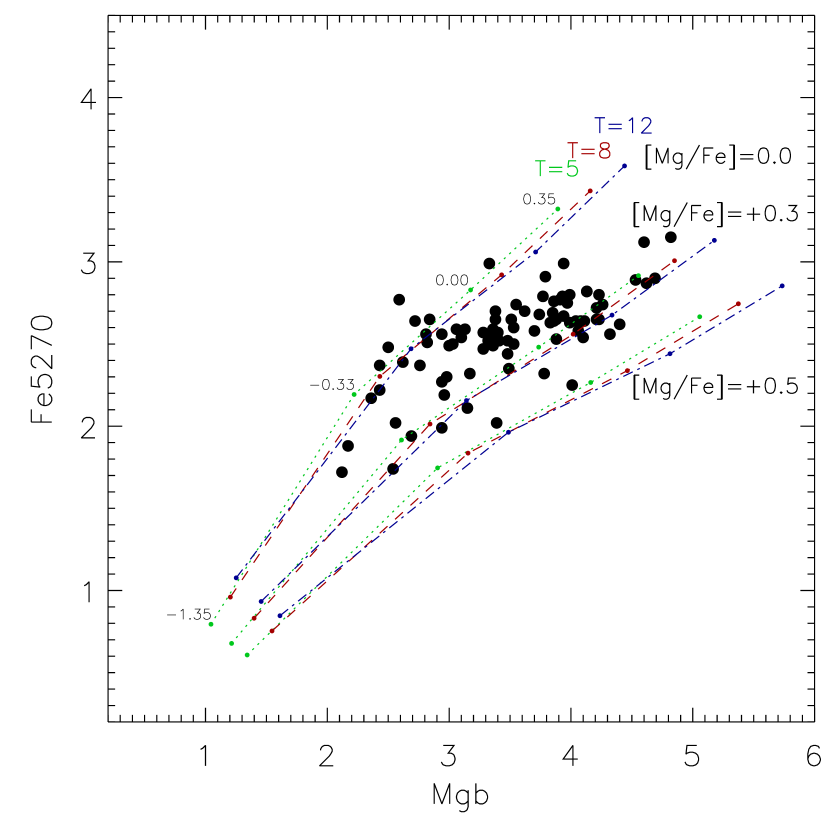
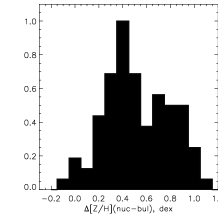
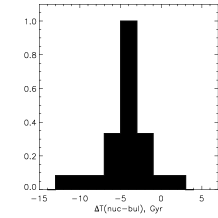
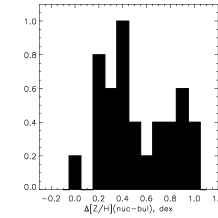
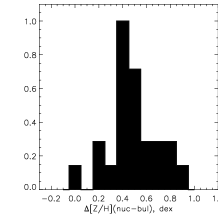
Figures 5–7 demonstrate some statistics on the stellar population properties obtained. The magnesium-to-iron ratios (Fig. 5) are mostly between [Mg/Fe] and [Mg/Fe] both for the nuclei and for the bulges; however the whole distribution of the bulges at the (Mgb, Fe5270) diagram is shifted to lower metallicities with respect to that of the nuclei. As I have noted earlier more than once – see e.g. Sil’chenko et al. (1992); Sil’chenko (2006, 2008) – the stellar nuclei are chemically and evolutionary decoupled with respect to the bulges, they are not simply the central points (R=0) of the bulges. In Fig. 6 one can see that the nuclei are typically younger and more metal-rich than the bulges. Earlier (Sil’chenko, 2008) I have estimated the fraction of chemically distinct nuclei in nearby S0s as a half of the sample; now, with the volume-limited sample of the ATLAS-3D, I increase this estimate to at least 84%. In Fig. 6 the age difference distribution has a maximum at –4 Gyr, and the metallicity difference distribution has two peaks, at dex and at dex. I have divided the whole sample into two subsamples according to the local environment density. The local environment densities for the galaxies of the ATLAS-3D sample have been estimated by Cappellari et al. (2011b), and it is from this paper that I have taken the environment density estimators for every galaxy. Cappellari et al. (2011b) noted that a condition separates well the Virgo members from other galaxies. So I have taken two subsamples, with (‘cluster and rich-group members’) and with (‘isolated galaxies’), to plot the distributions of the age and metallicity differences betwen the nuclei and the bulges in Fig. 7. It becomes clear (Fig. 7) that the second peak in the metallicity difference distribution is due completely to the Virgo members, while the broadening of the age difference distribution is produced by the galaxies in low-density environments. Evident dependence of the evolution paths of S0 galaxies on the environment density is implied by these results.
5 Newly discovered inner polar disks, and statistics of inner polar disks over the volume-limited sample of nearby S0s
In the ATLAS-3D volume-limited sample of nearby S0s, I have found seven new cases of polar gas rotation; in 5 of them the gas velocity fields have appeared to be extended enough – at least 5–10 spaxels from the center, – and the main stellar disks are not strictly edge-on, to give a possibility to apply to them the tilted-ring DETKA software. The results, namely, the orientation angles of the rotation planes for the stellar and for the gaseous components as well as the estimated mutual inclinations of the gaseous and stellar rotation planes are presented in the Table 3. In three galaxies – NGC 2962, NGC 3648, and NGC 4690 – I see warps of the inner gaseous disks or even several nested gaseous rings with slightly different orientations; for these galaxies I give the results in two separate radius ranges.
| NGC | PAkin(stars), deg | (stars),deg | Radius (gas), arcsec | PAkin(gas), deg | (gas), deg | , deg |
|---|---|---|---|---|---|---|
| 2962 | 6–11 | 60 or 83.5 | ||||
| 2962 | 13–18 | 50 or 111 | ||||
| 3499 | 5–11 | 75 or 68 | ||||
| 3648 | 1–4 | 28 or 114 | ||||
| 3648 | 5–8 | 68 or 85 | ||||
| 4690 | 3–6 | 88 or 54 | ||||
| 4690 | 7–8 | 71 or 61 | ||||
| 5507 | 2–6 | 66 or 91 |
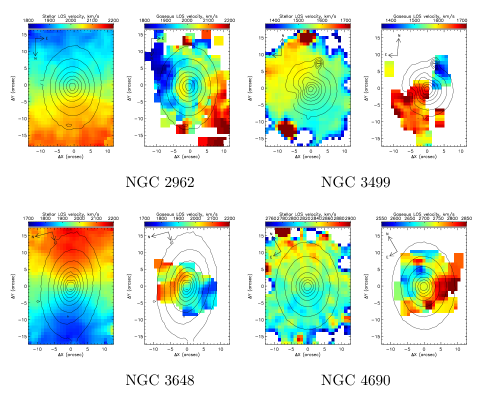
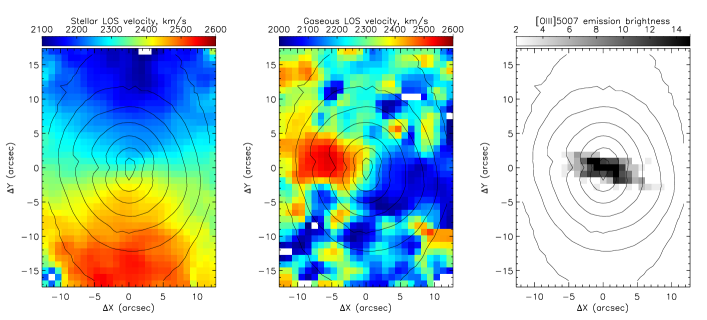
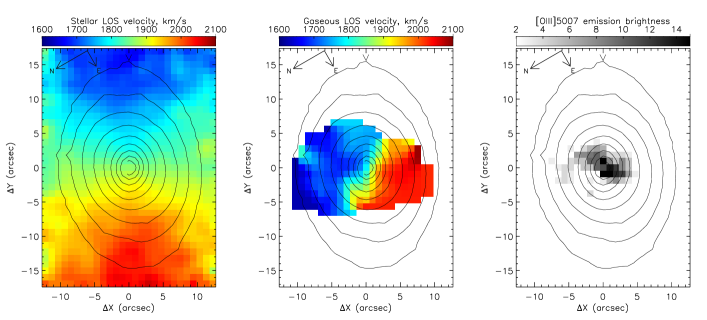
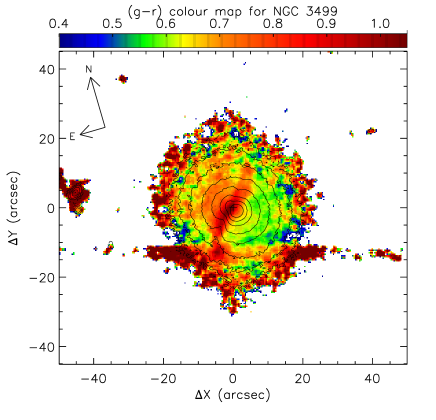
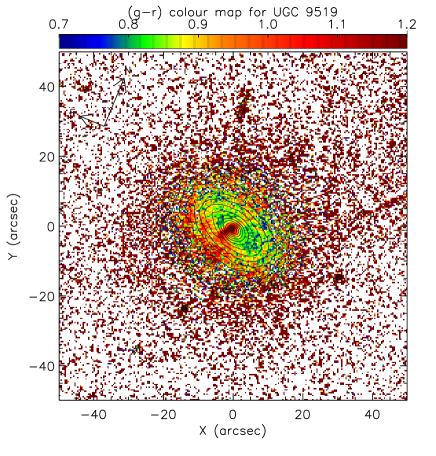
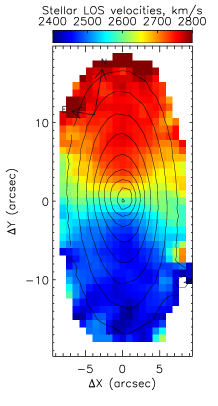
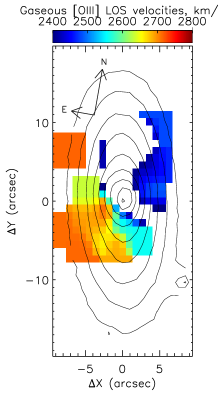
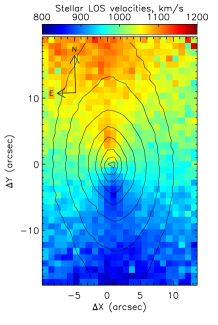
Some examples of the velocity fields for the stellar and gaseous components in the galaxies with the inner polar disks are shown in Fig. 8. As a confirmation, or visual signatures of the inner polar disk presence, especially in the cases when the gaseous disks are seen edge-on, I use also the maps of the emission-line intensities – as the illustrations, the [OIII]5007 maps for NGC 5507 and NGC 4233 are presented in Fig. 9, – and the color maps constructed by using the SDSS archive (DR9) data – the examples for UGC 9519 and NGC 3499 are given in Fig. 10. I note here that the polar inner disks in NGC 4233 and UGC 9519 were reported earlier, by Sil’chenko & Afanasiev (2004) in the former and by Katkov et al. (2014a) in the latter galaxy. As for UGC 9519, the ATLAS-3D team reported also the external source of the misaligned cold neutral gas for this galaxy (Davis et al., 2011).
Below some details of the gas distributions and motions in individual galaxies discussed here are specified.
 |
 |
 |
 |
 |
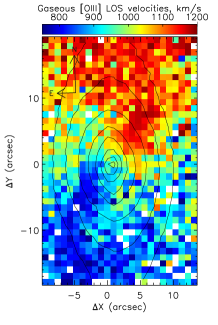 |
NGC 1121. The circumnuclear gaseous subsystem of this galaxy seen in the [OIII]5007 emission line is too compact to be analyzed with the DETKA software. However it is the case when the stellar disk of the galaxy is seen edge-on, and the centrally concentrated gas rotates evidently off the main galactic plane (Fig. 11, upper plots).
NGC 2962. This bona fide S0 galaxy is however very gas-rich: Grossi et al. (2009) report some solar masses of neutral hydrogen in NGC 2962 distributed regularly in an extended disk co-spatial with the stellar one. But in the center (Fig. 8, upper left) we see several nested gaseous subsystems with decoupled rotation: though all kinematical major axes are roughly perpendicular to the isophote major axis (by some 80 deg), the very inner ionized gas, at , counterrotates with respect to the more outer gas. At the gas rotation plane is strongly inclined, but not strictly polar, and undergoes smooth warp along the radius.
NGC 3499. It is isolated (Karachentsev et al., 2011), small, close to face-on S0/a galaxy. Its HI content is rather modest but detectable: solar masses according to the Green Bank Telescope integrated data (Wei et al., 2010). These authors – Wei et al. (2010) – describe the neutral hydrogen distribution in NGC 3499 as a regularly rotating extended disk, with the rotation velocity of 119 . We see orthogonality of the kinematical major axes of the stellar and ionized-gas components in the center of the galaxy ( vs , Fig. 8, upper right), and also a dust lane aligned in , just as the kinematical major axis of the ionized gas (Fig. 10) but projected off the nucleus; so the central gaseous disk is not strictly edge-on.
NGC 3648. The galaxy lacks HI, according to Serra et al. (2012). So we can suggest a compact circumnuclear ionized-gas disk, warped and becoming nearly polar at (Table 3).
NGC 4026. The galaxy is strictly edge-on. In the central part the gaseous component looks like a disk seen edge-on, inclined by some 50 deg to the main galactic plane. Farther from the center, the gaseous disk warps and lies into the galactic plane. The HI-map presented by Serra et al. (2012) demonstrates a long gas-rich filament entering into the disk of the galaxy just near the center at the right angle. Perhaps, we see here the nearly polar gas accretion through the cosmological filament and strong plane precession over the outer parts of the extended gaseous disk.
NGC 4690. The galaxy lacks detections both of neutral (Bettoni et al., 2003) and molecular gas (Young et al., 2011). In our maps (Fig. 8, bottom right) we see a sort of ionized-gas ring starting at a radius of , extending toward , with a possible warp at the edge, with the PAkin(gas) changing by some 55 deg over the radius range of 3 arcsec. The outer, , orientations of the disk lines of nodes, PAkin(stars) and PAkin(gas), are strictly orthogonal.
NGC 5507. It is also the galaxy where we can suggest a source of the polar gas accretion: it has a luminous late-type neighbor, NGC 5506, in 25 kpc from it. The circumnuclear ionized gaseous disk of NGC 5507 seen in [OIII]5007 is edge-on and roughly west-east elongated (Fig. 9), just as NGC 5506 as a whole. However, the kinematical major axis of this disk is oriented in so betraying radial gas motions, most probably – inflow: the superposition of the circular rotation having the disk line of nodes aligned in with pure radial motions of comparable velocity amplitude would result in kinematical major axis turn by .
Besides these seven S0 galaxies with the polar inner disks found so far in the ATLAS-3D sample, we can refer also to the inner polar disks in UGC 9519 implied by the polar dust lane (Fig. 10, right) and gas decoupled kinematics, see Katkov et al. (2014a), and in the strongly emissive NGC 4684 where the stellar disk is seen edge-on, and the circumnuclear gas is aligned at the direct angle with respect to the main galactic body (Davis et al., 2011). When we expand the present sample of 143 S0s toward the full sample of the ATLAS-3D survey including early observations in the frame of the SAURON project (Bacon et al., 2001), we obtain 200 lenticular galaxies in the local volume limited by Mpc; according to Cappellari et al. (2011a), this sample is complete over the galaxy luminosities exceeding . By adding to the 9 inner polar disks mentioned above also the galaxies listed by Moiseev (2012), we claim the detection of 21 inner polar disks among the full sample of 200 nearby lenticulars. So, the frequency of strongly inclined inner gaseous disks in the nearby S0s is about 10%. We must note that it is much higher than the incidence of large-scale polar rings, which is % (Reshetnikov et al., 2011; Moiseev et al., 2011).
6 Do the inner polar disk hosts differ from others?
 |
 |
 |
 |
 |
 |
Though many lenticular galaxies contain cold gas (Welch & Sage, 2003; Sage & Welch, 2006; Welch, Sage, & Young, 2010; Davis et al., 2011; Young et al., 2014), only for gaseous subsystems with decoupled kinematics there exist commonly accepted view that they have been accreted from outside. Among the gaseous subsystems with decoupled kinematics, the polar disks are thought to appear in a host galaxy by capturing the gas with orthogonal orbital momentum from somewhere outside – see e.g. Bournaud & Combes (2003); Brook et al. (2008). Moreover, polar gas, though accreted from outside, is considered to be dynamically stable and to inhabit long-lived orbits in S0 galaxies (Bournaud & Combes, 2003; Mapelli et al., 2015). While the outer gas captured into the main galactic plane of a host galaxy must sink by spiralling into the center on a timescale of 1 Gyr (Walker et al., 1996), and is expected to feed the central star formation burst with subsequent rejuvenation of the nuclear stellar population, the polar gas may remain off the nucleus and avoid affecting nuclear stellar population properties.
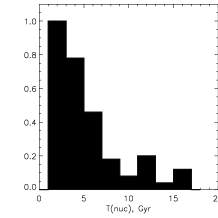
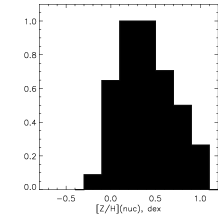
Having the complete sample of nearby S0s, among which 10% of the galaxies possess inner polar disks, I can compare the properties of the nuclear stellar populations in the inner polar disk hosts with the mean characteristics of the whole population of nearby S0s. Figure 12 shows the distributions of the SSP-equivalent ages and metallicities of the nuclear stellar populations for the whole sample of 143 S0s and separately for the hosts of the inner polar disks – 7 new ones, 6 known previously (Moiseev, 2012). The total nuclear age distribution is very specific, with the most galaxies concentrating around the nucleus age of Gyr, while the minority have old nuclei. The shape of the nucleus-age distribution for the galaxies with the inner polar disks repeats the general distribution perfectly (the Kolmogorov-Smirnov criterium is equal to 0.41): we cannot say that the nuclei in the hosts of the inner polar disks are older or younger on average. The most nuclei, 8 of 13, in the S0s with the inner polar disks are rather young, of 1–4 Gyr old. Their range of metallicity, [Z/H], fits perfectly the total distribution of the nuclear stellar population metallicities in the nearby S0s. We can conclude that the evolution of the central parts of the inner polar disk hosts is quite the same as that of the whole population of S0s: mainly with a secondary nuclear star formation burst at redshift of ( Gyr ago).
Figure 13 presents relations between the age or metallicity of the nuclear stellar populations and the stellar velocity dispersion averaged over apertures of so characterizing the bulge masses. The hosts of the inner polar disks are encircled by open squares, to separate out their positions among the total distributions. In general, early-type galaxies reveal tight correlations between these characteristics: [Z/H] correlates with for the cluster early-type galaxies (Trager et al., 2000b), while the ages correlate with for samples of field galaxies starting from group environments (Trager et al., 2000b; Caldwell et al., 2003; Howell, 2005). In our data we see that the hosts of the inner polar disks spreading over the full range of participate in the total relations which resemble in general the relations for field early-type galaxies. However, the relation of age vs in Fig. 13 is unexpectedly curious: only young nuclei, Gyr, reveal the tight correlation of their ages with the masses of the bulges. Among the old nuclei, no connection between the ages of the nuclear stellar populations and the masses of the bulges can be found. The nuclei of the hosts of the inner polar disks share this behavior: 10 younger nuclei distributed between 50 and 150 demonstrate good correlation of their ages vs , while among the hosts of 3 older nuclei the oldest one is the less massive, it has only .
7 Conclusions
I have inspected the central stellar population properties and also the gaseous and stellar kinematics of the volume-limited sample of nearby S0 galaxies observed with the IFU SAURON in the frame of the ATLAS-3D project. I have found seven (7) new cases of nearly polar rotation of the circumnuclear warm-gas disks with respect to the stars. Together with these new findings, I report the presence of 21 inner polar disks among the complete sample of 200 nearby S0s. It means that the frequency of the inner polar gas rotation is about 10% for the early-type disk galaxies in the local Universe that is much higher than the incidence of large-scale polar rings which is % (Moiseev et al., 2011). Perhaps, this difference reflects the natural difference between frequencies of minor and major mergers. To my surprise, the properties of the nuclear stellar populations of the inner polar disk hosts are strictly the same as those of the whole sample of nearby S0s. In particular, the age distributions are quite similar, with the most galaxies concentrated around the value of the nuclear stellar age of 1–4 Gyr. It means that despite proposed stability of polar orbits, the gas reached the very centers and provoked recent star formation bursts in the nuclei of the inner polar disk hosts, as it took place in the majority of S0 galaxies. It remains to be understood if the S0 galaxies suffered multiple gas accretion events, with only a single one of them from a polar orbit.
References
- Afanasiev & Moiseev (2011) Afanasiev, V. L., & Moiseev, A. V., 2011, Baltic Astronomy, 20, 363
- Bacon et al. (2001) Bacon, R., Copin, Y., Monnet, G., et al. 2001, MNRAS, 326, 23
- Baggett et al. (1998) Baggett, W. E., Baggett, S. M., Anderson, K. S. J. 1998, AJ, 116, 1626
- Baldwin et al. (1981) Baldwin, J. A., Phillips, M. M., Terlevich, R. 1981, PASP, 93, 5
- Bettoni et al. (1990) Bettoni, D., Fasano, G., Galletta, G., 1990, AJ, 99, 1789
- Bettoni et al. (2003) Bettoni, D., Galletta, G., Garcia-Burillo, S., 2003, A&A, 405, 5
- Bigiel et al. (2011) Bigiel, F., Leroy, A. K., Walter, F., Brinks, E., de Blok, W. J. G., et al., 2011, ApJ, 730, L13
- Bournaud & Combes (2003) Bournaud, F., Combes, F., 2003, A&A, 401, 817
- Brook et al. (2008) Brook, Ch. B., Governato, F., Quinn, T., et al., 2008, ApJ, 689, 678
- Burgess (1958) Burgess A., 1958, MNRAS, 118, 477
- Caldwell et al. (2003) Caldwell, N., Rose, J. A., Concannon, K. D., 2003, AJ, 125, 2891
- Cappellari et al. (2011a) Cappellari, M., Emsellem, E., Krajnovic, D., et al., 2011a, MNRAS, 413, 813
- Cappellari et al. (2011b) Cappellari, M., Emsellem, E., Krajnovic, D., et al., 2011b, MNRAS, 416, 1680
- Chiosi (1980) Chiosi, C., 1980, A&A, 83, 206
- Corsini et al. (2003) Corsini, E. M., Pizzella, A., Coccato, L., Bertola, F. 2003, A&A, 408, 873
- Dalcanton (2007) Dalcanton, J. J., 2007, ApJ, 658, 941
- Davis et al. (2011) Davis, T. A., Alatalo, K., Sarzi, M., Bureau, M., Young, L. M., et al., 2011, MNRAS, 417, 882
- de Zeeuw et al. (2002) de Zeeuw, P. T., Bureau, M., Emsellem, E., Bacon, R., Carollo, C. M., et al., 2002, MNRAS, 329, 513
- D’Onofrio (2001) D’Onofrio, M. 2001, MNRAS, 326, 1517
- Fisher et al. (1996) Fisher, D., Franx, M., Illingworth, G. 1996, ApJ, 459, 110
- Grossi et al. (2009) Grossi, M., di Serego Alighieri, S., Giovanardi C., et al. 2009, A&A, 498, 407
- Howell (2005) Howell, J. H., 2005, AJ, 130, 2065
- Il’ina & Sil’chenko (2012) Il’ina, M. A., Sil’chenko, O. K. 2012, Astron. Rep., 56, 578
- Karachentsev et al. (2011) Karachentsev, I. D., Makarov, D. I., Karachentseva, V. E., Melnyk, O. V., 2011, Astrophys. Bull., 66, 1
- Katkov et al. (2011) Katkov, I. Yu., Moiseev A. V., Sil’chenko, O. K. 2011, ApJ, 740, Aid83
- Katkov et al. (2014a) Katkov, I. Yu., Sil’chenko, O. K., Afanasiev, V. L., 2014a, MNRAS, 438, 2798
- Katkov et al. (2014b) Katkov, I. Yu., Sil’chenko, O. K., Afanasiev, V. L., 2014b, Astrophys. Bull., 69, 121
- Krajnovic et al. (2011) Krajnovic, D., Emsellem, E., Cappellari, M., Alatalo, K., Blitz, L., et al. 2011, MNRAS, 414, 2923
- Krajnovic et al. (2013) Krajnovic, D., Alatalo, K., Blitz, L., et al. 2013, MNRAS, 432, 1768
- Kuntschner et al. (2006) Kuntschner, H., Emsellem, E., Bacon, R., Bureau, M., Cappellari, M., et al., 2006, MNRAS, 369, 497
- Laurikainen et al. (2005) Laurikainen, E., Salo, H., Buta, R. 2005, MNRAS, 362, 1319
- Laurikainen et al. (2010) Laurikainen, E., Salo, H., Buta, R., Knapen, J. H., Comerón, S. 2010, MNRAS, 405, 1089
- Mapelli et al. (2015) Mapelli, M., Rampazzo, R., Marino, A., 2015, A&A, 575, A16
- McDermid et al. (2015) McDermid, R. M., Alatalo, K., Blitz, L., et al., 2015, MNRAS, 448, 3484
- Méndez-Abreu et al. (2008) Méndez-Abreu, J., Aguerri, J. A. L., Corsini, E. M., Simonneau, E. 2008, A&A, 478, 353
- Moiseev (2012) Moiseev, A. V., 2012, Astrophys. Bull., 67, 147
- Moiseev et al. (2004) Moiseev, A. V., Valdés, J. R., Chavushyan, V. H., 2004, A&A, 421, 433
- Moiseev et al. (2011) Moiseev, A. V., Smirnova, K. I., Smirnova, A. A., Reshetnikov, V. P., 2011, MNRAS, 418, 244
- Naim et al. (1995) Naim, A., Lahav, O., Buta, R. J., et al. 1995, MNRAS, 274, 1107
- Pizzella et al. (2004) Pizzella, A., Corsini, E. M., Vega Beltrán, J. C., Bertola, F. 2004, A&A, 424, 447
- Pilyugin et al. (2004) Pilyugin, L. S., Vílchez, J. M., Contini, T., 2004, A&A, 425, 849
- Proshina et al. (2016) Proshina, I. S., Kniazev, A. Yu., Sil’chenko, O. K. 2016, Astron. Letters, in press
- Renzini & Buzzoni (1986) Renzini, A., Buzzoni, A. 1986, In: Spectral Evolution of Galaxies, Eds. Chiosi C., Renzini, Dordrecht: D. Reidel Publishing Co., p. 195
- Reshetnikov et al. (2011) Reshetnikov, V. P., Faúndez-Abans, M., de Oliveira-Abans, M., 2011, Astron. Letters, 37, 171
- Sage & Welch (2006) Sage, L. J., Welch, G. A., 2006, ApJ, 644, 850
- Salo et al. (2015) Salo, H., Laurikainen, E., Laine, J., et al. 2015, ApJS, 219, 4
- Sarzi et al. (2006) Sarzi, M., Falcón-Barroso, J., Davies, R. L., Bacon, R., Bureau, M., et al. 2006, MNRAS, 366, 1151
- Schiavon (2007) Schiavon, R. P. 2007, ApJS, 171, 146
- Serra et al. (2012) Serra, P., Oosterloo, T., Morganti, R., et al., 2012, MNRAS, 422, 1835
- Sil’chenko (2005) Sil’chenko, O. K. 2005, Astron. Letters, 31, 227
- Sil’chenko (2006) Sil’chenko, O. K. 2006, ApJ, 641, 229
- Sil’chenko (2008) Sil’chenko, O. K. 2008, In: Formation and Evolution of Galaxy Bulges. IAU Symp. 245 / Eds. Bureau M., Athanassoula E., and Barbuy B., Cambridge: Cambridge Univ. Press, IAU Symposium, 245, 277
- Sil’chenko (2013) Sil’chenko, O. K. 2013, Memorie della Societa Astronomica Italiana Supplement, 25, 93
- Sil’chenko & Afanasiev (2000) Sil’chenko, O. K., Afanasiev, V. L. 2000, A&A, 364, 479
- Sil’chenko & Afanasiev (2004) Sil’chenko, O. K., Afanasiev, V. L. 2004, AJ, 127, 2641
- Sil’chenko & Moiseev (2006) Sil’chenko, O. K., Moiseev, A. V. 2006, AJ, 131, 1336
- Sil’chenko et al. (1992) Sil’chenko, O. K., Afanasiev, V. L., & Vlasyuk, V. V. 1992, AZh, 69, 1121
- Sil’chenko et al. (1997) Sil’chenko, O. K., Vlasyuk, V. V., Burenkov, A. N. 1997, A&A, 326, 941
- Sil’chenko et al. (2010) Sil’chenko, O. K., Moiseev, A. V., Shulga, A. P. 2010, AJ, 140, 1462
- Sil’chenko et al. (2012) Sil’chenko, O. K., Proshina, I. S., Shulga, A. P., & Koposov, S. E., 2012, MNRAS, 427, 790
- Stasinska & Sodré (2001) Stasinska, G., Sodré I., Jr. 2001, A&A, 374, 919
- Thomas et al. (2003) Thomas, D., Maraston, C., Bender, R. 2003, MNRAS, 339, 897
- Tosi (1988) Tosi, M., 1988, A&A, 197, 47
- Trager et al. (2000a) Trager, S.C., Faber, S.M., Worthey, G., Gonzàlez, J.J. 2000a, AJ, 119, 1645
- Trager et al. (2000b) Trager, S.C., Faber, S.M., Worthey, G., Gonzàlez, J.J. 2000b, AJ, 120, 165
- Tripicco & Bell (1995) Tripicco, M. J., Bell, R. A. 1995, AJ, 110, 3035
- Walker et al. (1996) Walker, I. R., Mihos, J. Ch., Hernquist, L., 1996, ApJ, 460, 121
- Wei et al. (2010) Wei, L.H., Kannappan, S.J., Vogel, S.N., Baker, A.J., 2010, ApJ, 708, 841
- Welch & Sage (2003) Welch, G. A., Sage, L. J., 2003, ApJ, 584, 260
- Welch, Sage, & Young (2010) Welch, G. A., Sage, L. J., Young, L. M., 2010, ApJ, 725, 100
- Worthey et al. (1994) Worthey, G., Faber, S. M., González, J.J., Burstein, D., 1994, ApJS, 94, 687
- Young et al. (2011) Young, L.M., Bureau, M., Davis, T.A., et al., 2011, MNRAS, 414, 940
- Young et al. (2014) Young, L.M., Scott, N., Serra, P., et al., 2014, MNRAS, 444, 3408