First NuSTAR observations of the BL Lac - type blazar PKS 2155-304: constraints on the jet content and distribution of radiating particles
Abstract
We report the first hard X-ray observations with NuSTAR of the BL Lac type blazar PKS 2155-304, augmented with soft X-ray data from XMM-Newton and -ray data from the Fermi Large Area Telescope, obtained in April 2013 when the source was in a very low flux state. A joint NuSTAR and XMM spectrum, covering the energy range 0.5 - 60 keV, is best described by a model consisting of a log-parabola component with curvature and a (local) photon index at photon energy of , and a hard power-law tail with photon index . The hard X-ray tail can be smoothly joined to the quasi-simultaneous -ray spectrum by a synchrotron self-Compton component produced by an electron distribution with index . Assuming that the power-law electron distribution extends down to and that there is one proton per electron, an unrealistically high total jet power of is inferred. This can be reduced by two orders of magnitude either by considering a significant presence of electron-positron pairs with lepton-to-proton ratio , or by introducing an additional, low-energy break in the electron energy distribution at the electron Lorentz factor . In either case, the jet composition is expected to be strongly matter-dominated.
1 Introduction
PKS 2155-304 is one of the most extensively studied BL Lac objects. It is a strong emitter of electromagnetic radiation in all observable bands, from radio to very high energy (VHE) rays. Its broad-band spectrum reveals two prominent peaks located respectively in the far UV/soft X-ray band, and in the multi-GeV part of the high energy -ray band. As such, PKS 2155-304 belongs to the class of jet-dominated active galaxies with the jet pointing close to our line of sight - known as blazars - and, specifically, to a sub-class known as high-energy peaked BL Lac objects, or HBLs (see, e.g., Padovani & Giommi 1995).
The two-peak spectral energy distribution (SED) of HBL blazars is generally (and most successfully) interpreted in the context of leptonic synchrotron self-Compton (SSC) models (e.g., Ghisellini et al., 1998), where the low-energy component is presumably due to synchrotron emission, while the high energy component is due to inverse Compton scattering by the same electrons that produce the synchrotron peak. The optical spectra of the HBL blazars are generally devoid of emission lines even in the low jet flux states, implying a rather weak isotropic radiation field associated with the accretion. In such objects, it is generally believed that the dominant population of “seed” photons (as seen in the co-moving frame of the relativistic jet) are the synchrotron photons produced within the jet.
From an observational standpoint, in HBL-type blazars perhaps the least is known about the lowest-energy part of the inverse-Compton peak. This is primarily due to the limited sensitivity of instruments in the relevant energy range, from keV to MeV. In particular, the onset of the high-energy peak contains important information about the lowest-energy electrons in the jet, which, in the context of any emission model, are most plentiful, and thus are a sensitive probe of the total content of particles in the jet. Notably, this low-energy end of the electron population cannot be reliably studied in the synchrotron component, since at low energies, the synchrotron emission is likely self-absorbed. Fortunately, the successful launch of the NuSTAR mission, sensitive in the 3 - 79 keV energy range, opened a new window for sensitive searches for the low-energy “tail” of the electron distribution in the inverse Compton component.
In this paper, we report NuSTAR observations of PKS 2155-304, one of the brightest and also most luminous HBL blazars. This object, at , has been known as a bright X-ray emitter since its discovery by HEAO-1 A3 (Schwartz et al., 1979). Subsequent X-ray observations consistently show soft X-ray spectra, with photon index in the 2 - 10 keV band (e.g., Sembay et al., 1993; Brinkmann et al., 1994; Edelson et al., 1995; Urry et al., 1997; Zhang et al., 1999; Kataoka et al., 2000; Tanihata et al., 2001; Bhagwan et al., 2014). Rapid variability on hourly time scales in the X-ray and optical bands is common; see (Zhang et al., 1999; Edelson et al., 2001; Tanihata et al., 2001; Kataoka et al., 2000). PKS 2155-304 is a known bright VHE -ray source (Chadwick et al., 1999; Aharonian et al., 2005) and is highly variable on timescales down to minutes in the VHE rays (Aharonian et al., 2007). For the most recent multi-band observations involving Fermi-LAT and VHE observatories, see Aharonian et al. (2009) or Chevalier et al. (2015).
NuSTAR observed PKS 2155-304 multiple times in 2013, as a part of multi-frequency monitoring with ground-based observatories, spanning radio through VHE bands. Here, we focus on the X-ray spectroscopy afforded by the first observation, conducted strictly simultaneously with XMM-Newton, in April 2013 for cross-calibration purposes. The joint NuSTAR and XMM-Newton spectrum reveals spectral complexity, and specifically, a soft spectrum in the 2 – 10 keV range, hardening at the high-energy part of its bandpass. While a similar hard spectral “tail” was previously measured in the spectrum of this object by HEAO-1 (Urry & Mushotzky, 1982) as well as by Beppo-SAX (Giommi et al., 1998), this was done with less sensitive, non-imaging instruments; the sensitive NuSTAR observation allows us to reliably confirm its presence, and characterize the spectrum in more detail. With relatively simple modeling of the broad-band SED in the context of SSC models, we are able to draw inferences about the distribution of radiating particles over a broad range of energies.
Unless otherwise specified, we adopt the concordance cosmology, , and km s-1 Mpc-1.
2 Observations and data reduction
While NuSTAR observed PKS 2155-304 multiple times in 2013, here we report on the first observation, performed on 2013 April 23-24, or around MJD 56405. Those observations were coordinated to be strictly simultaneous with multiple X-ray instruments for the purpose of cross-calibration. The campaign, described in Madsen et al. (2016), yielded useful data from Chandra, Swift, Suzaku, NuSTAR, and XMM-Newton. For the purpose of the current study, we use only the XMM-Newton soft X-ray, and the NuSTAR hard X-ray data, as those provided the best statistics; we also include Swift UVOT data, to provide simultaneous optical / UV coverage towards constraining the emission models. Subsequent NuSTAR observations of PKS 2155-304 were conducted simultaneously with the H.E.S.S.-II Cherenkov telescope, and will be reported elsewhere; for a preliminary overview, see Sanchez et al. (2015).
2.1 NuSTAR
NuSTAR, a NASA Small Explorer satellite sensitive in the hard X-ray band, features two multilayer-coated telescopes, focusing the reflected X-rays on the pixellated CdZnTe focal plane modules, FPMA and FPMB. The observatory provides a bandpass of 3 – 79 keV with spectral resolution of keV. The field of view of each telescope is , and the half-power diameter of an image of a point source is . This allows a reliable estimate and subtraction of instrumental and cosmic backgrounds, resulting in an unprecedented sensitivity for measuring fluxes and spectra of celestial sources. For more details, see Harrison et al. (2013).
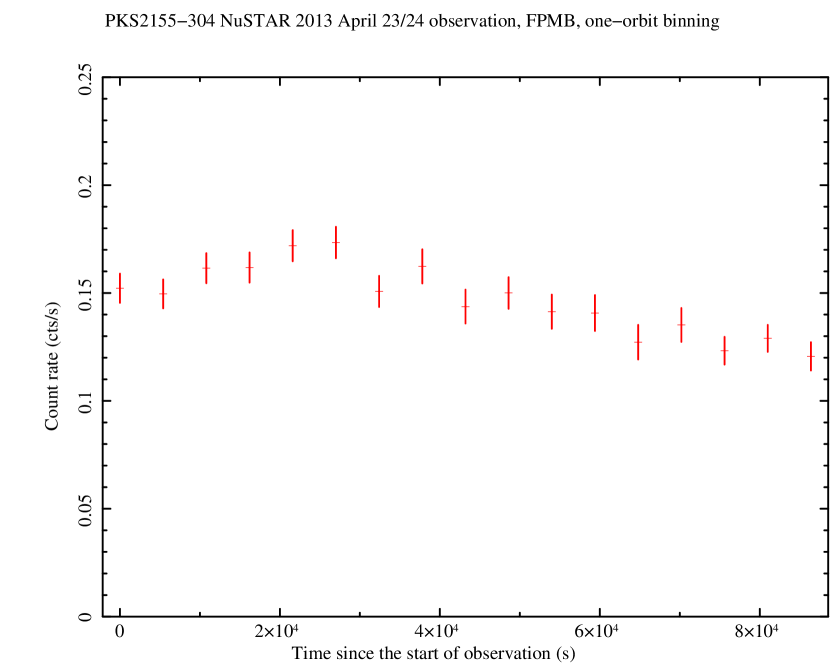
After screening for the South Atlantic Anomaly passages and Earth occultation, the 2013 April 23/24 pointing resulted in 44.9 ks of net observing time (OBSID 60002022002). The raw data products were processed with the NuSTAR Data Analysis Software (NuSTARDAS) package v. 1.3.1 (via the script nupipeline), producing calibrated and cleaned event files. Source data were extracted from a region of radius, centered on the centroid of X-ray emission, while the background was extracted from a radius region roughly SW of the source location. Spectra were binned in order to have at least 30 counts per rebinned channel. We considered the spectral channels corresponding nominally to the 3 – 60 keV energy range, where the source was robustly detected. The mean net (background-subtracted) count rates were and cts s-1, respectively, for the modules FPMA and FPMB. The raw (not background-subtracted) counts binned on an orbital time scale are plotted in Figure 1. The source was variable from one orbit to another, although with only a modest amplitude, not exceeding 10%. We find no change in the hardness ratio of the source as a function of time, indicating that there was no significant spectral variability during the observation. Therefore, we focus here on time-averaged spectral analysis, summing the data into one deep spectral file.
2.2 XMM-Newton and Swift UVOT
XMM-Newton consists of three X-ray telescopes. Two of these focus celestial X-rays onto MOS CCD arrays, while the third uses the EPIC-pn camera. XMM-Newton observations of PKS 2155-304 were reduced using the XMM-Newton Science Analysis System (SAS) v. 14.0, with the calibration files of 2015 July 1. The reduction followed exactly the same procedures as those described in Madsen et al. (2016). The spectra were extracted from a region in radius for all three detectors, with events recorded in the inner discarded to avoid pile-up effects. The background was extracted from the corners of the the EPIC-pn for the pn data, and from the empty sky fields of the peripheral CCD for the MOS data. We considered the 0.5 - 10 keV energy range for spectral fitting. In this spectral range, the count rate was , , and counts s-1 and the net exposures were 64770 s, 64770 s, and 66050 s, respectively, for the MOS1, MOS2, and pn cameras.
We also analyzed the Swift UVOT data from the pointings contemporaneous with the NuSTAR pointing, to ensure that those are consistent with our modelling. Specifically, we measured the following de-reddened fluxes at respective frequencies: Hz: erg cm-2 s-1, Hz: erg cm-2 s-1, Hz: erg cm-2 s-1, Hz: erg cm-2 s-1, Hz: erg cm-2 s-1, and Hz: erg cm-2 s-1. We include those in our modelling of the broad-band spectrum in Section 4.
2.3 Fermi-LAT
The Fermi Large Area Telescope (Fermi-LAT; Atwood et al. 2009) is a pair-conversion -ray detector sensitive in the energy range 20 MeV to greater than 300 GeV. We analyzed the Fermi-LAT data with the software package ScienceTools v10r0p5, using the instrument response function P8R2_SOURCE_V6 (front and back), including the Galactic diffuse emission model gll_iem_v06, and the isotropic background model iso_P8R2_SOURCE_V6_v06. Because during the NuSTAR observation on MJD 56405, PKS 2155-304 displayed a relatively low -ray state, we considered data collected over the 10-day period MJD 56400-56410, centered on the NuSTAR observation at MJD 56405. Gamma-ray events were selected from a region of interest within of PKS 2155-304, and the background model includes all sources from the 2FGL catalog (Nolan et al., 2012) within from PKS 2155-304, as well as the standard Galactic diffuse, isotropic and residual instrumental background emission models provided by the Fermi Science Support Center111http://fermi.gsfc.nasa.gov/ssc/data/access/lat/Background Models.html. The photon indices of all background sources were fixed.
The spectral data points were calculated by applying the unbinned maximum likelihood analysis in logarithmically spaced energy bins (with the width of the bins corresponding to the ratio of bin boundary energies of 2.512) with the photon index fixed in each bin to . For each bin, we set the detection criterion to require that the test statistic, or and . The source was detected () in all energy bins in the energy range between and . For the bins where this criterion is not satisfied, we calculated the 95% confidence level flux upper limits (i.e., flux such that , where is the best-fit likelihood value). (For a definition of “Test Statistics,” see Mattox et al. 1996).
3 Spectral fitting
3.1 NuSTAR
The spectral fitting of all X-ray data was performed using XSPEC v12.8.2, with the standard instrumental response matrices and effective area files derived using the ftool nuproducts. We fitted the data for both NuSTAR detectors simultaneously allowing an offset of the normalization factor for module FPMB with respect to module FPMA. Regardless of adopted models, the normalization offset was less than 3%. First, we adopted a simple power-law model modified by the effects of the Galactic absorption, corresponding to a column of cm-2 (Kalberla et al. 2005). While the fit is acceptable ( for 295 Pulse Height Analysis, or PHA bins) and returns the power-law index of , the residuals show that the NuSTAR spectrum is more concave (i. e. the spectrum gets flatter towards higher energies) than a simple power-law model would imply. Note that this is in contrast to previously measured spectra of two other HBL-type blazars, Mkn 421 (Baloković et al., 2016) and Mkn 501 (Furniss et al., 2015), where the spectra, where the NuSTAR data augmented by Swift-XRT data allowing for a broad bandpass, appear to steepen with energy.
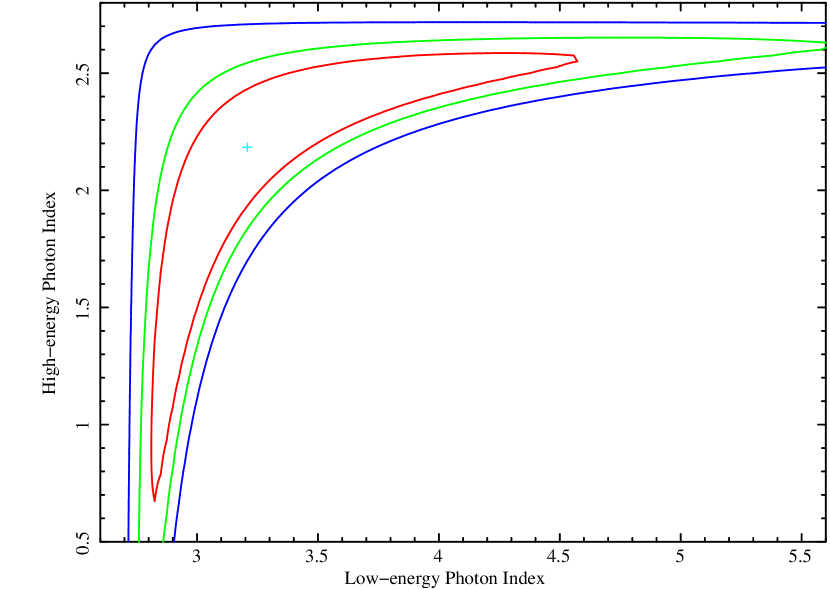
We next attempted two more complex models (both with absorption fixed at the Galactic value as above). First, we considered a broken power law, with the steeper low-energy and harder high-energy indices. The fit returned significantly improved with , or of 7, for 295 PHA bins. The low- and high-energy indices are respectively and , and the break energy is at keV. Since a broken power law model is somewhat unphysical, we also attempted a double power law representation of the data, also modified by Galactic absorption as above. The fit returns for 295 PHA bins with a low-energy index of and a high-energy index of . Given the somewhat better value of , and since it can represent a superposition of two separate components, we express a preference for the two power-law model. We plot the confidence regions of the low- versus high-energy indices for the two-power law model in Figure 2. We also attempted to substitute in the place of a power law for the soft spectrum, dominating below 6 keV, a log-parabolic model where one additional parameter is added to allow for a gradual departure from a simple power law (cf. Tramacere et al., 2007). This substitution does not improve the quality of spectral fit for the NuSTAR data alone (but it does for the joint NuSTAR + XMM-Newton spectral fits; see below). Regardless of the model, the flux of the source in the 2 – 10 keV spectral band (chosen for easy comparison with previous observations of PKS 2155-304) is erg cm-2 s-1, which is quite faint for this source, indicating that we are observing PKS 2155-304 in a very low state. For a comparison, the “low-state” of PKS 2155-304 reported by Aharonian et al. (2009) was significantly higher, ranging from to erg cm-2 s-1.
In order to investigate the possibility that the apparent hardening of the spectrum of PKS 2155-304 toward higher energies is an artifact of background subtraction, the analysis was repeated with multiple background regions from various regions on the detector. Regardless of the selected region, the departure (at high energies) from the very soft, photon index persists, and we discuss the significance in the following Section.
3.2 XMM-Newton and joint NuSTAR + XMM-Newton
We fitted all three XMM-Newton detectors simultaneously over the bandpass of 0.5 – 10 keV. These data alone can be adequately fit by a model including a simple power law + neutral absorption: the fit returned an equivalent hydrogen column of cm-2, a power-law index of , and for 2200 PHA bins. If one imposes the fixed Galactic column of cm-2, the fit is significantly worse, with for 2200 PHA bins. This indicates that the source’s soft X-ray spectrum shows significant departure from a power-law model. Motivated by previous successes in applying more complex models to describe data for HBL-type blazars such as Mkn 421 (Baloković et al., 2016) and Mkn 501 (Furniss et al., 2015), we next attempted a log-parabolic (logpar) model (cf. Tramacere et al., 2007). Such a model fits the data well: for 2200 PHA bins. We chose the pivot energy to be 2 keV, close to the (logarithmic) middle of the XMM-Newton bandpass. The fit returns the local power-law index at that energy to be , with a curvature parameter of .
The strictly simultaneous observation with XMM-Newton and NuSTAR allows an unprecedented (for this source) bandpass of 0.5 - 60 keV, and this is the bandpass we use for subsequent fits. Motivated by the success of the logpar model above, we applied it to the joint data. We set the absorption to the Galactic value, cm-2 as above. With this, again setting the keV, the best fit using all five instruments - XMM-Newton MOS1, MOS2, and pn as well as NuSTAR FPMA and FPMB - returns for 2495 PHA bins, with the local power-law index at 2 keV of , and the curvature parameter .
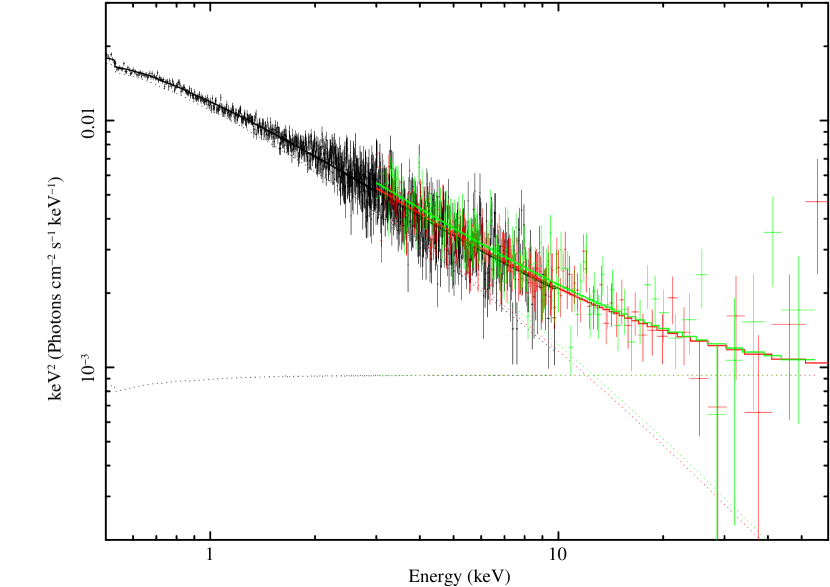
While the above fit is acceptable, motivated by evidence for the additional hard tail in the NuSTAR spectrum, we attempt the final model consisting of photoelectric absorption by the Galactic column and a two-component continuum modelled as logpar + hard power law. The best fit returns for 2495 PHA bins. The local index at 2 keV is now , and . For the high-energy (“hard tail”) power law, the index is , and its normalization (at 1 keV) is photons keV cm-2 s-1 (corresponding to the 20 - 40 keV flux of erg cm-2 s). Clearly the statistical improvement to the fit is quite pronounced, mainly owing to the remarkably broad bandpass provided by the combination of XMM-Newton and NuSTAR. We present this final model in Fig. 3.
To further test the significance of the hard tail, we performed a Monte-Carlo simulation of the NuSTAR + XMM data assuming just the logpar model without the power law for 1500 realizations. We found that none of the realizations were able to reproduce the feature at the observed magnitude, implying that the additional power-law component is significant at the 99.93% confidence level.
3.3 Fermi-LAT
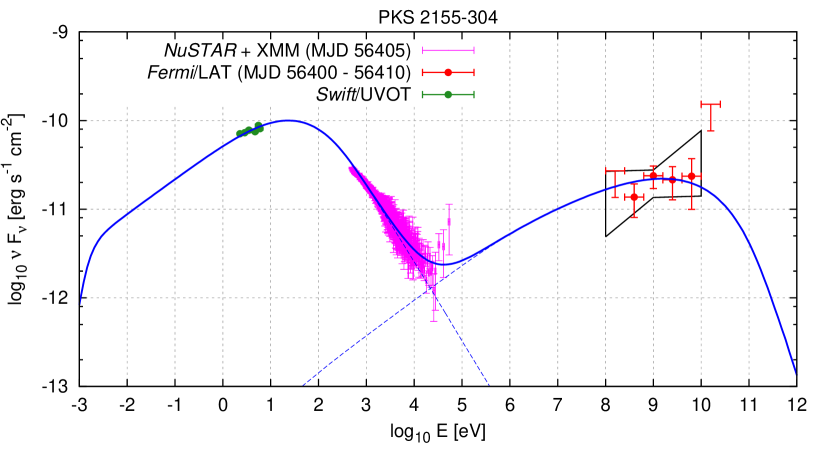
During the NuSTAR observation on MJD 56405, PKS 2155-304 displayed a relatively low -ray state. As mentioned above, we considered the data collected over 10-day period MJD 56400-56410. A binned MeV -ray spectrum, extracted from the Fermi-LAT data as described above, was fitted to a simple power-law model; Fermi-LAT measured the photon flux above to be with the photon index of . We plot the resulting data points as well as the fitted spectrum collected over the 10-day period in Figure 4.
4 Discussion: modelling the broad-band spectral energy distribution and particle content of the jet
In the context of the SSC models commonly invoked to explain the broad-band spectra and variability of HBL-type blazars, radio-through-soft X-ray emission is commonly attributed to the synchrotron process, with X-rays being due to the most energetic electrons. The -ray emission is presumably produced via an inverse Compton process; the commonly observed correlated variability in the VHE -ray and soft X-ray bands argues for a common energy range of the radiating particles. Most commonly invoked models to describe the broad-band spectral energy distributions locate the cross-over between the synchrotron and inverse Compton peaks in the hard X-ray range, with the onset of the inverse-Compton peak manifesting itself as spectral hardening with increasing energy in the hard X-ray band. Our NuSTAR spectrum of PKS 2155-304 provides evidence for such spectral hardening, which we interpret as the low-energy tail of the inverse-Compton component.
We modelled the broad-band SED of PKS 2155-304 using the BLAZAR code (Moderski et al., 2003). Here, the X-ray spectrum is interpreted as the high-energy end of the synchrotron component, and the -ray spectrum is interpreted as the inverse-Compton part of the SSC component. Our main goal is to verify a hypothesis that the spectral hardening seen in the hard X-ray band could be due to the confluence between the synchrotron and inverse-Compton components. Adopting a broken power-law distribution of injected electrons ( with for , and for ), this hypothesis allows us to robustly constrain the low-energy index of the electron energy distribution, and the detailed X-ray spectrum allows us to constrain the break Lorentz factor and the high-energy index of the distribution. In our basic model, we adopted the following parameters: jet Lorentz factor , magnetic field strength at a distance scale of , jet half-opening angle and viewing angle , and the emitting region radius . These parameters are consistent with those inferred from previous X-ray variability studies of this source (see, e.g., Kataoka et al. 2000; Foschini et al. 2007; Katarzynski et al. 2008; Aharonian et al. 2009), but we also explored other values for , and in order to verify that our key results do not depend on them (see below). The distribution of Lorentz factors of the injected electrons motivated by our hypothesis is characterized by , , , and . The very high value of is not constrained by any observational data. With this power-law index , most of the electron power is contained in the lowest-energy electrons, and hence the average Lorentz factor of the injected electrons is only . This model is presented in Figure 4, and it predicts the synchrotron self-absorption break at (or ).
We calculate components of the jet power required by the model as , where is the energy density of quantity measured in the jet comoving frame. In particular, we find magnetic power , electron power , and radiation power . These values suggest that the jet composition is strongly dominated by matter with , without taking into account any protons. However, one must consider charge neutrality, so each electron must have a corresponding proton or positron. Assuming – for now – one cold proton per electron, this would predict a very high proton power of . Providing such a large amount of kinetic power via accretion is unrealistic for an HBL-type blazar. Even if the mass of the black hole MBH is solar masses (not directly measured, but adopted by, e.g., Aharonian et al. 2007), and assuming high efficiency of conversion of the accretion power to jet power, in order to provide the kinetic power for the jet with equal number of electrons and protons, the accretion rate would have to exceed the Eddington rate. Such a high accretion rate would result in an optically thick accretion disk, which in turn should reveal quasi-thermal components (emission lines, blue bump, and possible Compton reflection component), as commonly seen in high accretion rate active galaxies. This is in conflict with the absence of such thermal components in HBL-type blazars (and in PKS 2155-304 in particular), which in turn suggests that HBL-type blazars accrete via inefficient, low accretion-rate, advection-dominated flows, or ADAFs (for a recent overview, see Yuan & Narayan 2014).
Alternatively, we can assume the presence of electron-positron pairs and estimate the effective numbers of leptons per proton . Since in any case the jet appears to be matter-dominated, we assume that the power of leptons originates from the dissipation of the power of protons , such that , where is the fraction of the dissipation efficiency measuring the energy fraction transferred to the leptons. Therefore, we find and . We note that a similar constraint – but using different arguments – was obtained for the pair content in luminous blazars associated with flat spectrum radio quasars (FSRQs) by Sikora & Madejski (2000), although their conclusions were recently somewhat weakened (Sikora et al., 2013). The problem of pair content in blazar jets was also investigated by Ghisellini (2012), and most recently, Ghisellini et al. (2014) concluded that the presence of a significant number of pairs in the powerful blazars is unlikely. In any case, FSRQ jets are unlikely to be proton-free, as jets consisting of pure pairs would overproduce the observed X-ray flux, via bulk-Compton scattering of ambient, circum-nuclear photons. Since in HBL-type blazars such ambient photon fields are very weak or absent, the minimum proton content is basically unconstrained. We also note that, since the relative number of pairs depends only on the dissipation efficiency and on the average electron energy , our key result depends primarily on our assumptions on the energy distribution of injected pairs. Still, in order to determine the sensitivity of the resulting (which in turn determines ) on our adopted and , we attempted two additional models. In one case, we adopted , and in another, pc; in both cases, we kept other parameters as above, but we adjusted and to make the model agree with the data. The resulting varied by respectively (roughly) and (with correspondingly small changes in ), certainly not sufficient to bring this ratio close to unity. Thus, by imposing charge neutrality, a jet consisting of pure electron-proton plasma, with no positrons, is not favored.
Alternatively, we can consider a reduced number of the low-energy electrons, which is basically unconstrained by the observational data. If the electrons responsible for the hard X-ray part of the SSC component () were in the fast-cooling regime, we could postulate a significantly harder low-energy power-law index for the injected electron population. However, in our model the electrons are cooling efficiently only for . Therefore, in order to reduce the number of low-energy electrons, it is necessary to introduce a second break in the electron injection spectrum with for , and for . For example, adopting and , we have and , and hence and . Other possibilities, e.g., a sharp low-energy cutoff with , can also be considered. In either of the above cases, assuming the presence of either pairs or a low-energy break can bring the required jet power to reasonable values. However, without changing other parameters such as , it is very challenging to bring the jet composition closer to equipartition, as these parameters do not affect the magnetic power .
5 Conclusions
PKS 2155-304 displayed a relatively low state during the first NuSTAR observations of the source in April 2013, with the measured 2 – 10 keV X-ray flux of only erg cm-2 s-1, roughly three times lower than the lowest X-ray flux in August-September 2008, reported by Aharonian et al. (2009). NuSTAR data reveal a steep () spectrum below keV, hardening to above keV. When fitted with strictly simultaneous XMM-Newton data, the soft component is best-fit as a log-parabolic model, and the hard tail is even more significant. It is naturally expected that such spectral hardening as we detect in the combined NuSTAR and XMM-Newton data would be more easily detectable when the source is in a state of a relatively low soft X-ray flux. This is because the soft X-ray and VHE -ray variability in HBL BL Lacs is generally more rapid and has larger amplitude than that at lower energy of the respective peaks. This is partially due to more rapid energy losses with increasing particle energy. Therefore, the chance of detecting the presumably less variable onset (low-energy end) of the inverse Compton component is actually greater when the high-energy tail of the synchrotron peak is weak, and does not dilute the Compton component. Indeed, our data taken in an extremely low-flux state reveal such a component.
An application of the SSC model allows us to estimate the particle content in the jet. If we assume one proton per electron, then the total power of the jet is dominated by two orders of magnitude by particles, amounting to . This would require a very large amount of power to be delivered via accretion, and would imply accretion at a highly super-Eddington rate. This, in turn, is unlikely given the absence of any quasi-thermal spectral components one would expect to be present in the optical/UV spectra of this source. Therefore, we consider a more plausible scenario, where the jet contains significantly more than one lepton per proton, meaning that by number, the jet is dominated by electron-positron pairs. This allows the reduction of the required jet power by two orders of magnitude, bringing it to more realistic values. The required jet power can also be reduced by introducing an additional break in the electron injection spectrum, e.g., with and . In either case explored here, the total power of the jet is dominated by particles rather than by magnetic fields.
In summary, while the presence of electron-positron pairs was previously postulated in relativistic jets of FSRQs (see Sikora & Madejski 2000), the new constraint from NuSTAR on the low-energy part of the electron distribution suggests that copious pairs may be present in jets associated with the lineless, HBL-type blazars.
References
- Aharonian et al. (2005) Aharonian, F., Akhperjanian, A. G., Aye, K.-M., et al. 2005, A&A, 430, 865
- Aharonian et al. (2007) Aharonian, F., Akhperjanian, A. G., Bazer-Bachi, A. R., et al. 2007, ApJ, 664, L71
- Aharonian et al. (2009) Aharonian, F., Akhperjanian, A. G., Anton, G., et al. 2009, ApJ, 696, L150
- Atwood et al. (2009) Atwood, W. B., Abdo, A. A., Ackermann, M., et al. 2009, ApJ, 697, 1071
- Baloković et al. (2016) Baloković, M., Paneque, D., Madejski, G., et al. 2016, ApJ, 819, 156
- Bhagwan et al. (2014) Bhagwan, J., Gupta, A., Papadakis, I., & Wiita, P. 2014, MNRAS, 444, 3647
- Brinkmann et al. (1994) Brinkmann, W., Maraschi, L., Treves, A., et al. 1994, A&A, 288, 433
- Chadwick et al. (1999) Chadwick, P. M., Lyons, K., McComb, T. J. L., et al. 1999, ApJ, 513, 161
- Chevalier et al. (2015) Chevalier, J., Kastendieck, M. A., Rieger, F., et al. 2015, arXiv:1509.03104
- Edelson et al. (1995) Edelson, R., Krolik, J., Madejski, G., et al. 1995, ApJ, 438, 120
- Edelson et al. (2001) Edelson, R., Griffiths, G., Markowitz, A., et al. 2001, ApJ, 554, 274
- Foschini et al. (2007) Foschini, L., Ghisellini, G., Tavecchio, F., et al. 2007, ApJ, 657, L81
- Furniss et al. (2015) Furniss, A., Noda, K., Boggs, S., et al. 2015, ApJ, 812, 65
- Giommi et al. (1998) Giommi, P., Fiore, F., Guainazzi, M., et al. 1998, A&A, 333, L5
- Ghisellini et al. (1998) Ghisellini, G., Celotti, A., Fossati, G., Maraschi, L., & Comastri, A. 1998, MNRAS, 301, 451
- Ghisellini (2012) Ghisellini, G. 2012, MNRAS, 424, L26
- Ghisellini et al. (2014) Ghisellini, G., Tavecchio, F., Maraschi, L., Celotti, A., & Sbarrato, T. 2014, Nature, 515, 376
- Harrison et al. (2013) Harrison, F. A., Craig, W. W., Christensen, F. E., et al. 2013, ApJ, 770, 103
- Kalberla et al. (2005) Kalberla, P., Burton, W., Hartmann, D., et al. 2005, A&A, 440, 775
- Kataoka et al. (2000) Kataoka, J., Takahashi, T., Makino, F., et al. 2000, ApJ, 528, 243
- Katarzynski et al. (2008) Katarzynski, K., Lenain, J.-P., Zech, A., Boisson, C., & Sol, H. 2008, MNRAS, 390, 371
- Mattox et al. (1996) Mattox, J., et al. 1996, ApJ, 461, 396
- Moderski et al. (2003) Moderski, R., Sikora, M., & Błażejowski, M. 2003, A&A, 406, 855
- Madsen et al. (2016) Madsen, K., et al. 2016, ApJ, submitted
- Nolan et al. (2012) Nolan, P., Abdo, A., Ackermann, M., et al. 2012, ApJS, 199, 31
- Padovani & Giommi (1995) Padovani, P., & Giommi, P. 1995, ApJ, 444, 567
- Sanchez et al. (2015) Sanchez, D. A., Giebels, B., Zaborov, D., et al. 2015, arXiv:1502.02915
- Schwartz et al. (1979) Schwartz, D. A., Griffiths, R., Schwarz, J., Doxsey, R., & Johnston, M. 1979, ApJ, 229, L53
- Sembay et al. (1993) Sembay, S., Warwick, R. S., Urry, C. M., et al. 1993, ApJ, 404, 112
- Sikora & Madejski (2000) Sikora, M., & Madejski, G. 2000, ApJ, 534, 109
- Sikora et al. (2013) Sikora, M., Janiak, M., Nalewajko, K., Madejski, G. M., & Moderski, R. 2013, ApJ, 779, 68
- Tanihata et al. (2001) Tanihata, C., Urry, C. M., Takahashi, T., et al. 2001, ApJ, 563, 569
- Tramacere et al. (2007) Tramacere, A., Giommi, P., Massaro, E., et al. 2007, A&A, 467, 501
- Urry & Mushotzky (1982) Urry, C. M., & Mushotzky, R. F. 1982, ApJ, 253, 38
- Urry et al. (1997) Urry, C. M., Treves, A., Maraschi, L., et al. 1997, ApJ, 486, 799
- Yuan & Narayan (2014) Yuan, F., & Narayan, R. 2014, ARA&A, 52, 529
- Zhang et al. (1999) Zhang, Y. H., Celotti, A., Treves, A., et al. 1999, ApJ, 527, 719