SDSS-IV MaNGA: A serendipitous observation of a potential gas accretion event
Abstract
The nature of warm, ionized gas outside of galaxies may illuminate several key galaxy evolutionary processes. A serendipitous observation by the MaNGA survey has revealed a large, asymmetric H complex with no optical counterpart that extends ( kpc) beyond the effective radius of a dusty, starbursting galaxy. This H extension is approximately three times the effective radius of the host galaxy and displays a tail-like morphology. We analyze its gas-phase metallicities, gaseous kinematics, and emission-line ratios, and discuss whether this H extension could be diffuse ionized gas, a gas accretion event, or something else. We find that this warm, ionized gas structure is most consistent with gas accretion through recycled wind material, which could be an important process that regulates the low-mass end of the galaxy stellar mass function.
Subject headings:
galaxies: evolution — galaxies: formation — galaxies: starburst — galaxies: abundances1. Introduction
Understanding the warm, ionized gas outside of galaxies is a critical aspect of galaxy evolution. To study this gas, there have been two main probes: (1) observations of extraplanar ionized gas in edge-on galaxies (e.g., Rand et al., 1990; Tüllmann et al., 2000; Otte et al., 2001; Miller & Veilleux, 2003; Rossa & Dettmar, 2003) and (2) low ionization metal-line absorption studies using quasar sightlines (e.g., Tumlinson et al., 2011; Werk et al., 2013, 2014).
These studies have led to the discovery of diffuse ionized gas (DIG; Hoyle & Ellis 1963; Reynolds 1985), which is a layer of warm, low-density ionized gas that extends out to several kpc into the haloes of galaxies, and the confirmation of the circumgalactic medium (CGM; Bergeron 1986; Lanzetta et al. 1995), which is a gas reservoir containing warm, ionized gas that is of even lower density than the DIG and extends hundreds of kpc into the haloes of galaxies. But how this gas relates to the evolution of their host galaxies is an open question.
In this work, we further our understanding of warm, ionized gas in the haloes of galaxies by studying a rare and unusual gas complex in the SDSS-IV MaNGA survey (Bundy et al., 2015). Designed to observe galaxies out to a maximum radius of 2.5 effective radius (), the MaNGA survey has observed a dusty, starbursting272727We define starbursts as galaxies with (Kennicutt & Evans, 2012) galaxy that is on the upper end of the mass-metallicity relationship (Tremonti et al., 2004) out to 6.3 through a fortuitous overestimation of 282828MaNGA uses measurements from the NASA-Sloan Atlas, which estimated for this galaxy. After masking out the bright, nearby stars, we used GALFIT (Peng et al., 2002) to fit a single Sérsic model to this galaxy, yielding ; see §2. This galaxy shows no signs of interaction and displays a large H extension with no optical counterpart in the Sloan Digital Sky Survey Data Release 7 (SDSS DR7; York et al. 2000; Abazajian et al. 2009).
Throughout this work, we assume a flat cosmological model with km s-1 Mpc-1, , and .
| MaNGA-ID | Plate-IFU | RA | DEC | aaSpectroscopic redshift from NSA catalog. | bbGalaxy stellar mass from MPA-JHU DR7 data release. | ccRest-frame color from NSA catalog. | ddFiber star-formation rate from MPA-JHU DR7 data release. | eeFiber star-formation rate surface density using the MPA-JHU DR7 data release. | ffEffective radius from GALFIT (Peng et al., 2002). | ggGalaxy Sérsic index from GALFIT (Peng et al., 2002). | |
|---|---|---|---|---|---|---|---|---|---|---|---|
| (J2000.0 deg) | (J2000.0 deg) | (M⊙) | (M) | (M) | () | (kpc) | |||||
| 1-113700 | 8618-12703 | 319.45182 | 11.66059 | 0.038 | 9.77 | 2.05 | 0.22 | 2.6 | 2.0 | 3.7 |

2. Data
The data used in this work are from the ongoing SDSS-IV MaNGA survey (Bundy et al., 2015; Drory et al., 2015; Law et al., 2015; Yan et al., 2016; SDSS Collaboration et al., 2016), which is an integral field unit (IFU) survey that is taking resolved spectroscopy of 10,000 nearby galaxies with . The survey uses the SDSS 2.5-meter telescope (Gunn et al., 2006) and BOSS spectrographs (Smee et al., 2013); pilot studies using P-MaNGA data include Li et al. (2015); Wilkinson et al. (2015); Belfiore et al. (2015). The -band signal-to-noise in the galaxy outskirts is 4-8 Å-1 and the wavelength coverage is 3,600-10,000 Å. The effective spatial resolution is (full width at half maximum; FWHM), with an instrumental resolution of km s-1 and a spectral resolution of .
The MaNGA sample and data products were drawn from the internal MaNGA Product Launch-4 (MPL-4), which contains galaxies. Ancillary data are from the MPA-JHU DR7 value-added catalog292929http://www.mpa-garching.mpg.de/SDSS/DR7/ and the NASA-Sloan Atlas303030http://www.nsatlas.org.
The stellar masses from the MPA-JHU DR7 value-added catalog are estimated by fitting a large grid of stellar population models from Bruzual & Charlot (2003) to the ugriz SDSS photometry, following the philosophy of Kauffmann et al. (2003) and Salim et al. (2007). The fiber star formation rates from the MPA-JHU DR7 value-added catalog are estimated using the technique described in Brinchmann et al. (2004), where galaxies with emission lines are fitted with the models of Charlot & Longhetti (2001). The fiber star formation rate surface density is calculated over the diameter SDSS fiber.
The stellar continuum of each spaxel is fit by the MaNGA Data Analysis Pipeline (DAP; Westfall et al., in prep), which uses pPXF (Cappellari & Emsellem, 2004) and the MIUSCAT stellar population models (Vazdekis et al., 2012). Although the MIUSCAT templates are built to reflect simple stellar populations, the mix of templates used to construct the best-fit stellar continuum does not represent a physically-motivated stellar population.
Emission line fluxes are measured through simple flux-summing after subtraction of the stellar continuum (where there is stellar continuum). The wavelength passbands over which they are integrated are similar to that of Yan et al. (2006), ranging from 10 Å to 20 Å around the central wavelength. For spectra that do not have measured stellar continua, we subtract a baseline continuum that is based on a linear fit to the red and blue sidebands; these sidebands extend approximately 100 Å beyond the central passbands, and have been chosen to avoid other strong emission lines.
We adopt the non-parametric quantities and to characterize the center (with respect to the systemic velocity of the host galaxy) and width (that contains of the flux) of the H emission line (e.g., Harrison et al., 2014). We only measure and in spaxels where the H flux has .
To estimate the gaseous metallicities, 12+log(O/H), we use the IZI code (Blanc et al., 2015), which estimates ionization parameter and gaseous metallicity based on a bayesian analysis of a model grid with a set of input line fluxes; we used the Dopita et al. (2013) model grids, but obtain similar results with that of Levesque et al. (2010). We provide [Oii] 3727,3729, H, [Oiii] 5007, H, [Nii] 6583, and [Sii] 6717,6731; all provided line fluxes have . Throughout this work, we correct for reddening using the Balmer decrement and the Fitzpatrick (1999) extinction law. The typical uncertainties of these IZI metallicities are - dex.
We also estimate the gaseous metallicity using the [Nii]/[Oii] calibration from Kewley & Dopita (2002), which is relatively insensitive to variations in ionization parameter and is least sensitive to diffuse ionized gas contamination (Zhang et al. 2016, submitted). We estimate the uncertainties by adding in quadrature the intrinsic scatter of this calibration ( dex; see Kewley & Dopita 2002) and the measurement error of propagated through the calibration, resulting in typical uncertainties of - dex.
3. Results
Our main result is presented in Fig. 1. The SDSS color image of the system is shown in Fig. 1a, with the MaNGA footprint outlined by the magenta hexagon. Fig. 1b displays the H flux map of this system, with the H flux contours in light grey. There is a large extension in the H flux distribution that extends ( kpc) to the left (East) beyond the effective radius of the host galaxy, and does not correspond to any optical source in SDSS. This striking feature is elucidated in Fig. 1c, where we present the H flux contours superimposed on the SDSS band image, with the blue circle marking the of the host galaxy.
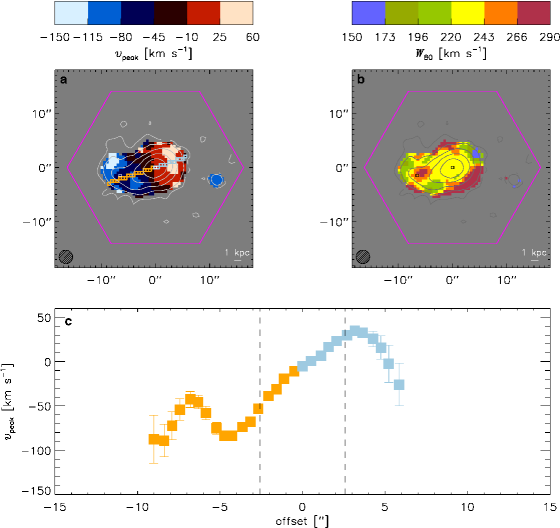
Fig. 1d and Fig. 1e show the spectra centered on the H emission line of the highlighted spaxels in the H complex (which is away from the center) and in the center of the host galaxy. Both spectra possess strong emission from the [Nii] doublet, H, and the [Sii] doublet, confirming the authenticity of this H extension and indicating the presence of ionized gas throughout the entire system. Stacking all the spectra within the green circle centered in the H extension of Fig. 1b—which we will refer to as the “H circle”—does not reveal a significant continuum. Properties of the host galaxy are listed in Table 1.
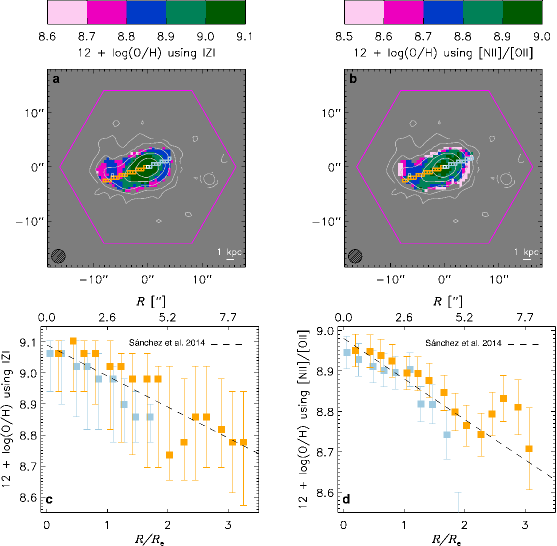
Fig. 2 presents the gaseous metallicities, 12+log(O/H), of this system using IZI (Fig. 2a) and the calibration (Fig. 2b), with the H flux contours overlaid and the same spaxels from Fig. 1b highlighted in white. Using the estimates of IZI (the calibration), the stacked 12+log(O/H) value in a circle centered on the host galaxy is (), whereas the stacked 12+log(O/H) value in the H circle is ()— () dex less than the center of the host galaxy at greater than confidence. Comparing these gaseous metallicities to the solar value (12+log(O/H); Asplund et al. 2009) reveals that the entire system has super-solar gaseous metallicities (but see Kennicutt et al. 2003 for caveats associated with strong-line abundances).
Fig. 2c and Fig. 2d display the 12+log(O/H) profile as traced by the highlighted spaxels in Fig. 2a and Fig. 2b, with the characteristic metallicity profile of non-interacting disks from Sánchez et al. (2014) overplotted in the dashed line (with an arbitrary zero-point). Out to , the metallicity profiles of this system are similar to that of Sánchez et al. (2014). At , however, there appears to be a break that corresponds to the location of the H extension.
The estimated metallicity profile of this system, however, is highly uncertain, as indicated by the large error bars from IZI, which, unlike the calibration, considers multiple strong emission lines (see §2). These large error bars from IZI likely reflect the contrasting diagnostic line ratios, which may be due to the blending of physically different emission regions caused by insufficient spatial resolution.
Another source of uncertainty is the DIG contribution to the emission line ratios, which could produce artificial metallicity gradients, especially in the outskirts of the system (Zhang et al., submitted). While we argue that DIG is not the major component of this system in §4.1, we cannot rule out minor DIG contributions that could affect the estimated metallicity gradients of this system.
The ionized gas kinematics of this system is presented in Fig. 3, with displayed in panel a and in panel b; again, we superimpose the H flux contours and highlight the two spaxels from Fig. 1b. Fig. 3a reveals an asymmetric gradient that ranges from km s-1 at the H extension to km s-1 at the right side of the host galaxy. Fig. 3b shows typical values of km s-1, with areas of enhanced in the H extension and the outer envelope of the H flux distribution. The velocity profile of the highlighted spaxels in Fig. 3a is shown in Fig. 3c, with of the host galaxy marked by the dashed, vertical lines. rises smoothly out to , where it starts to flatten. Beyond , however, there is an irregular wiggle in that corresponds to boosted in the H extension.
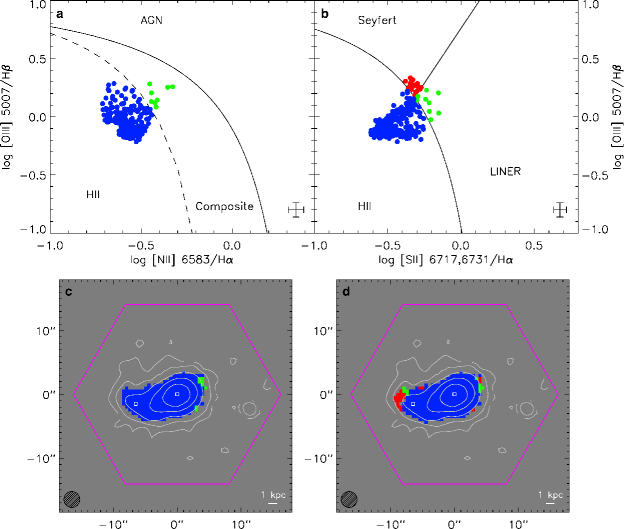
The [Nii] and [Sii] BPT (Baldwin et al., 1981) diagrams for this system are presented in Fig. 4a and Fig. 4b, respectively. We only consider spaxels with emission lines that have and overlay curves from Kewley et al. (2006) that are used to separate different classes of galaxies. Fig. 4c and Fig. 4d display the resolved [Nii] and [Sii] BPT diagrams, respectively; i.e., these maps color-code each spaxel according to its location in their respective BPT diagrams. We overplot the H flux contours and highlight the same two spaxels in Fig. 1b. Fig. 4 demonstrates that almost all spaxels have Hii line ratios.
4. Discussion
In this section, we discuss the nature of the H extension.
4.1. Diffuse ionized gas
The presence of warm, ionized gas in the outskirts of galaxies have been commonly referred to as diffuse ionized gas (DIG; Hoyle & Ellis 1963; Reynolds 1985). The most pronounced characteristics of the DIG are the elevated and line ratios compared to Hii regions (e.g., Monnet, 1971; Rand et al., 1990; Rand, 1997, 1998; Haffner et al., 1999; Tüllmann et al., 2000; Otte et al., 2001, 2002; Collins & Rand, 2001; Hoopes & Walterbos, 2003; Wood & Mathis, 2004; Voges & Walterbos, 2006; Rand et al., 2008; Haffner et al., 2009; Reynolds et al., 2012), which may be due to secondary ionization/heating sources (e.g., Reynolds & Cox, 1992; Reynolds et al., 1999). Thus comparing the line ratios of the H extension to that of Hii regions would constrain whether the H extension is DIG.
Ideally, we would identify individual Hii regions in our system in order to conduct this comparison. However, the spatial resolution of the MaNGA data is too coarse—the FWHM is , which corresponds to kpc at (the host galaxy’s redshift), which is more than an order of magnitude larger than typical Hii regions (1-100 pc; Kennicutt 1984; Hunt & Hirashita 2009). Therefore every spaxel in our data contains contributions from both Hii regions and DIG.
One way to constrain the DIG contribution of the H extension is by comparing its line ratios to that of the center of the host galaxy, where the H surface brightness is the highest and the DIG contribution is the lowest (Ferguson et al., 1996). However, since line ratios are also dependent on metallicity and ionization parameter (Dopita et al., 2000, 2013; Kewley & Dopita, 2002; Kewley et al., 2006)—which are likely to be different at the center compared to the H extension—another way to constrain the DIG contribution is to compare the line ratios of the H extension to the line ratios of the surrounding regions.
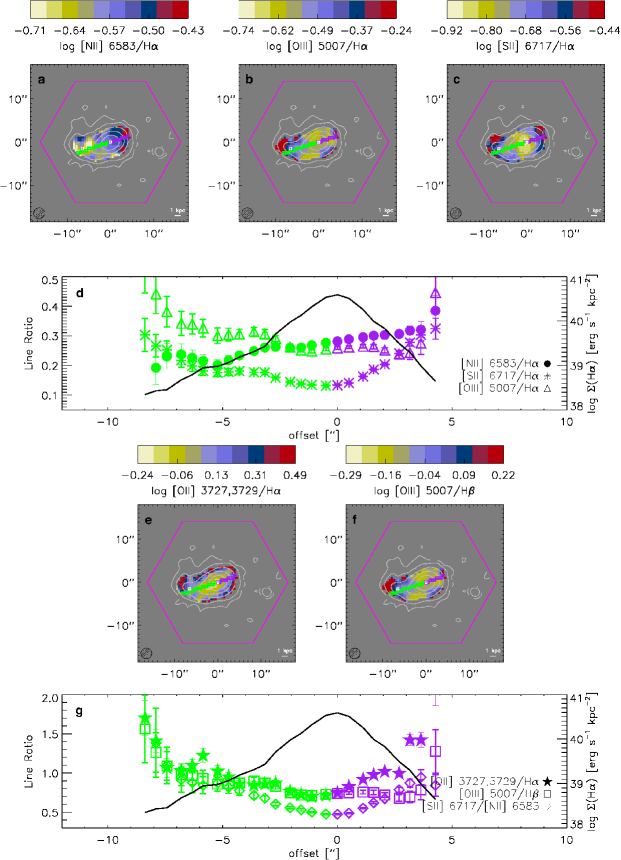
We present this line ratio comparison in Fig. 5, all of which have been corrected for reddening according to §2. Figs. 5a-c show the log line ratio maps of , , and , and Figs. 5e-f show the log line ratio maps of and ; the white contours represent the H flux distribution. Fig. 5d displays the (filled circles), (open triangles), and (asterisks) line ratio profiles as traced by the highlighted spaxels in Fig. 5a-c, while Fig. 5g presents the (filled stars), (open squares), and (open diamonds) line ratio profiles as traced by the highlighted spaxels in Fig. 5e-f; the black solid line represents the H surface brightness profile over the same highlighted spaxels.
Fig. 5 indicates a complicated situation. While Fig. 5d and Fig. 5g show that generally decreases with more negative offsets from the center of the galaxy, i.e., toward the direction of the H extension, the , , , and generally increase along the same direction. These enhancing line ratios toward the H extension are consistent with DIG, but the decreasing line ratio toward the H extension are not consistent with DIG (e.g., Hoopes & Walterbos 2003; Voges & Walterbos 2006; Zhang et al. 2016, submitted). This latter trend is particularly striking since is sensitive to the temperature of the gas and has been used to infer that the DIG is about K hotter than Hii regions—a defining characteristic of DIG (Haffner et al., 1999; Madsen et al., 2006; Haffner et al., 2009; Reynolds et al., 2012).
Fig. 5d also shows that the profile displays a dip around an offset of , which corresponds to the location of the H extension, while the profile and the H surface brightness profile display a flattening at the same spot. Since the regions surrounding the H extension should have a similar metallicity and ionization parameter, the fact that the H extension does not display enhanced and compared to its surrounding regions indicates that the H extension is not dominated by DIG. However, since the is low at the outskirts, the comparison of the line ratios at the center of the H extension (at ) to those at the outermost regions are more uncertain.
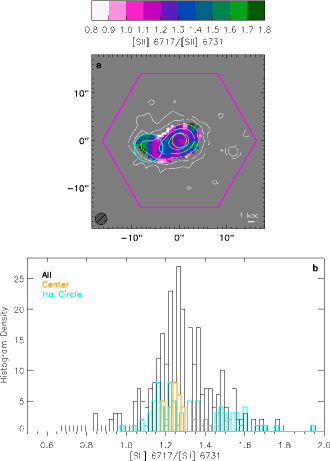
Another defining characteristic of DIG is its low density (; e.g., Haffner et al. 2009). Hence another way to constrain the DIG contribution is to probe the gas density of the system with the [Sii] 6717/ [Sii] 6731 line ratio (Osterbrock & Ferland, 2006). We present the [Sii] 6717/ [Sii] 6731 line ratio map in Fig. 6a (with the H contours superimposed and the same spaxels from Fig. 1b highlighted in white), and the histogram of the [Sii] 6717/ [Sii] 6731 line ratios for various regions in Fig. 6b.
The [Sii] 6717/ [Sii] 6731 line ratios of the H circle ranges from 1.0 to 1.6, which corresponds to electron densities, , of 500 cm-3 to cm-3, respectively (Proxauf et al., 2014). Even though the leftmost edge of the H circle shows electron densities that are less than 10 cm-3, that a large area of the H extension contains dense gas with strongly indicates that the H extension is not dominated by DIG.
4.2. Gas accretion
Alternatively, the H extension could be a sign of gas accretion (Sancisi et al., 2008; Rubin et al., 2012; Bouché et al., 2013; Sánchez Almeida et al., 2014, 2015; Bouché et al., 2016), which can manifest through a variety of ways, e.g., cold flows (the properties of this galaxy, and , suggest cold flows rather than hot flows; Kereš et al. 2005, 2009a; Dekel & Birnboim 2006; Dekel et al. 2009; Danovich et al. 2015; Stewart et al. 2016), recycled wind material (Shapiro & Field, 1976; Bregman, 1980; Fraternali & Binney, 2008; Oppenheimer & Davé, 2008; Kereš et al., 2009b; Oppenheimer et al., 2010; Hopkins et al., 2014), or a gas-rich low-surface-brightness (LSB) dwarf galaxy (e.g., Leaman et al., 2015; Fischer et al., 2015).
The super-solar gaseous metallicities of this H extension (see Fig. 2), however, is inconsistent with gas accretion through cold flows from the intergalactic medium (IGM) since this type of accreting gas is expected to be very metal-poor (Davé et al., 2011; van de Voort & Schaye, 2012; Joung et al., 2012).
The Hii line ratios of the H extension indicates that star-formation is the primary source of ionization (see Fig. 4), suggesting that the H extension is an accreting gas-rich LSB dwarf galaxy. Assuming that this H extension is indeed a LSB dwarf galaxy, then we estimate a stellar mass upper limit of .
To obtain this limit, we first sum the band flux of every pixel in the H circle using SDSS DR7; we multiply this sum by three and take it as the upper limit of the band flux. Selecting SDSS DR7 galaxies at , we plot their mass-to-light ratios () as a function of rest-frame color using the MPA-JHU stellar masses and galaxy and band absolute magnitudes from GIM2D (Simard et al., 2011), and then use the typical of star-forming galaxies () to estimate the stellar mass upper limit of the H extension, which yields .
A galaxy with such a low stellar mass, however, is unlikely to have the super-solar gaseous metallicities that are observed in the H extension (Berg et al., 2012; Jimmy et al., 2015), indicating that the H complex is probably not an accreting gas-rich LSB dwarf galaxy.
Finally, the enhanced values of within the H extension (see Fig. 3b) that coincide with an unusual bump in the velocity profile (at of Fig. 3c) may suggest the presence of turbulence that could be caused by the interaction between accreting gas and the host galaxy. However, such large values of may also be an artifact caused by the coarse resolution of the MaNGA data, which could blend multiple components separated by small velocities and/or small distances. Future higher resolution data will be needed to discern these possibilities.
Therefore the gas accretion scenario that best matches the properties of the H extension is recycled wind material (Oppenheimer & Davé, 2008; Kereš et al., 2009b; Oppenheimer et al., 2010; Hopkins et al., 2014), which is predicted to be a critical process in shaping the galaxy stellar mass function at low stellar masses (; Oppenheimer et al. 2010; Hopkins et al. 2014).
4.2.1 Gas accretion deficit
If this H extension is indeed accreting gas, then an interesting application would be toward the gas accretion deficit. To elaborate, Sancisi et al. (2008) combined many nearby Hi studies to show that the visible Hi gas accretion rate in the local universe is only M☉ yr-1, which is about an order of magnitude too small to account for the current of local star-forming galaxies ( M☉ yr-1). These Hi studies, however, only probe cold gas K). Simulations predict that most of the gas in cold flows have K upon entering the host galaxy (van de Voort & Schaye, 2012; Joung et al., 2012; Nelson et al., 2013). Thus probing warm ( K), ionized gas from the CGM may alleviate the gas accretion deficit.
To test this idea, we compare the potential warm gas accretion rate onto this galaxy with its . We first calculate the ionized gas mass of the H circle using the following equation from Osterbrock & Ferland (2006):
| (1) |
where is the extinction-corrected H luminosity and is the electron density. We calculate by summing the extinction-corrected H luminosities of every spaxel in the H circle, yielding . To estimate , we measure the median [Sii] 6717/[Sii] 6731 ratio (; see Fig. 6b) of the H circle to obtain ; this calculation yields .
The time required for this H circle to accrete onto the host galaxy, , is estimated by dividing the distance between the H circle and the host galaxy with the observed velocity of the H circle. This distance, i.e., the distance between the two highlighted spaxels in Fig. 1b, is , which corresponds to km. The median of the H circle is km s-1. Hence yrs.
Therefore, the average warm gas accretion rate onto the host galaxy is . If this accreting warm gas were driving the current star-formation in the host galaxy, we would expect for this warm gas accretion rate to be similar to the current . However, the estimated star-formation rate of the host galaxy is , which is almost two orders of magnitude larger than the estimated warm gas accretion rate. Thus warm gas accretion does not appear to solve the gas accretion deficit for this galaxy.
However, since this galaxy is starbursting, which is defined to be a short period of intense star-formation, perhaps it is unsurprising that the warm gas accretion does not sustain the current star-formation rate. Moreover, this estimated warm gas accretion rate may be a lower limit since we do not account for transverse motions, meaning the true velocity could be higher, nor do we account for the possibility of more diffuse ionized gas that is below our detection limit.
4.3. Other possibilities
Another possibility for this H complex is that it’s an outflow. If it were an outflow from a starburst though, we’d expect for its 12+log(O/H) values to be the same as, or higher than, the center of the host galaxy, where the metal-enriching stellar feedback would have likely originated. Instead, we find that the H extension has lower 12+log(O/H), arguing against an outflow. Another possibility is that it’s gas disrupted and/or stripped by environmental processes, e.g., mergers or ram-pressure stripping (Gunn & Gott, 1972). However, since the host galaxy shows no signs of interaction and does not appear to be in a large group, we find this explanation unlikely. Moreover, with a galaxy Sérsic index of , unusual gaseous metallicity profile, and irregular rotation curve, it is also unlikely that this H extension is simply part of the host galaxy as a dim, lopsided disk.
Finally, the elongated, asymmetric H flux distribution of the system (see Fig. 1) resembles the morphologies of tadpole galaxies (van den Bergh et al., 1996; Elmegreen et al., 2005, 2007, 2012; Sánchez Almeida et al., 2013; Straughn et al., 2015), suggesting that this H extension may be part of a tadpole galaxy. However, in addition to their cometary morphology, another common property of tadpole galaxies is their bright, blue colors that are indicative of recent bursts of intense star formation (Elmegreen & Elmegreen, 2010; Elmegreen et al., 2012). Since the H extension in our system has no optical or ultraviolet (UV) counterpart, it is unlikely that our system is a tadpole galaxy. Moreover, the super-solar gaseous metallicities of our system is inconsistent with the very metal-poor gaseous metallicities found in local tadpole galaxies (Sánchez Almeida et al., 2013).
5. Conclusion
In this paper, we present the serendipitous observation of an ionized gas structure that protrudes out of a dusty, starbursting galaxy. Our analysis indicates that this ionized gas complex is most consistent with gas accretion through recycled wind material.
To better understand the nature of this phenomenon, and to constrain the importance of gas accretion through recycled wind material, we need to find more of these extended gas complexes. However, the current MaNGA sample has not observed any other isolated galaxy with an adequately-sized integral field unit () to allow such a search. We hope to address this issue with future MaNGA releases.
References
- Abazajian et al. (2009) Abazajian, K. N., Adelman-McCarthy, J. K., Agüeros, M. A., et al. 2009, ApJS, 182, 543
- Asplund et al. (2009) Asplund, M., Grevesse, N., Sauval, A. J., & Scott, P. 2009, ARA&A, 47, 481
- Baldwin et al. (1981) Baldwin, J. A., Phillips, M. M., & Terlevich, R. 1981, PASP, 93, 5
- Belfiore et al. (2015) Belfiore, F., Maiolino, R., Bundy, K., et al. 2015, MNRAS, 449, 867
- Berg et al. (2012) Berg, D. A., Skillman, E. D., Marble, A. R., et al. 2012, ApJ, 754, 98
- Bergeron (1986) Bergeron, J. 1986, A&A, 155, L8
- Blanc et al. (2015) Blanc, G. A., Kewley, L., Vogt, F. P. A., & Dopita, M. A. 2015, ApJ, 798, 99
- Bouché et al. (2013) Bouché, N., Murphy, M. T., Kacprzak, G. G., et al. 2013, Science, 341, 50
- Bouché et al. (2016) Bouché, N., Finley, H., Schroetter, I., et al. 2016, ApJ, 820, 121
- Bregman (1980) Bregman, J. N. 1980, ApJ, 236, 577
- Brinchmann et al. (2004) Brinchmann, J., Charlot, S., White, S. D. M., et al. 2004, MNRAS, 351, 1151
- Bruzual & Charlot (2003) Bruzual, G., & Charlot, S. 2003, MNRAS, 344, 1000
- Bundy et al. (2015) Bundy, K., Bershady, M. A., Law, D. R., et al. 2015, ApJ, 798, 7
- Cappellari & Emsellem (2004) Cappellari, M., & Emsellem, E. 2004, PASP, 116, 138
- Charlot & Longhetti (2001) Charlot, S., & Longhetti, M. 2001, MNRAS, 323, 887
- Collins & Rand (2001) Collins, J. A., & Rand, R. J. 2001, ApJ, 551, 57
- Danovich et al. (2015) Danovich, M., Dekel, A., Hahn, O., Ceverino, D., & Primack, J. 2015, MNRAS, 449, 2087
- Davé et al. (2011) Davé, R., Finlator, K., & Oppenheimer, B. D. 2011, MNRAS, 416, 1354
- Dekel & Birnboim (2006) Dekel, A., & Birnboim, Y. 2006, MNRAS, 368, 2
- Dekel et al. (2009) Dekel, A., Birnboim, Y., Engel, G., et al. 2009, Nature, 457, 451
- Dopita et al. (2000) Dopita, M. A., Kewley, L. J., Heisler, C. A., & Sutherland, R. S. 2000, ApJ, 542, 224
- Dopita et al. (2013) Dopita, M. A., Sutherland, R. S., Nicholls, D. C., Kewley, L. J., & Vogt, F. P. A. 2013, ApJS, 208, 10
- Drory et al. (2015) Drory, N., MacDonald, N., Bershady, M. A., et al. 2015, AJ, 149, 77
- Elmegreen et al. (2005) Elmegreen, D. M., Elmegreen, B. G., Rubin, D. S., & Schaffer, M. A. 2005, ApJ, 631, 85
- Elmegreen et al. (2007) Elmegreen, D. M., Elmegreen, B. G., Ravindranath, S., & Coe, D. A. 2007, ApJ, 658, 763
- Elmegreen & Elmegreen (2010) Elmegreen, B. G., & Elmegreen, D. M. 2010, ApJ, 722, 1895
- Elmegreen et al. (2012) Elmegreen, D. M., Elmegreen, B. G., Sánchez Almeida, J., et al. 2012, ApJ, 750, 95
- Ferguson et al. (1996) Ferguson, A. M. N., Wyse, R. F. G., Gallagher, J. S., III, & Hunter, D. A. 1996, AJ, 111, 2265
- Fischer et al. (2015) Fischer, T. C., Crenshaw, D. M., Kraemer, S. B., et al. 2015, ApJ, 799, 234
- Fitzpatrick (1999) Fitzpatrick, E. L. 1999, PASP, 111, 63
- Fraternali & Binney (2008) Fraternali, F., & Binney, J. J. 2008, MNRAS, 386, 935
- Gunn & Gott (1972) Gunn, J. E., & Gott, J. R., III 1972, ApJ, 176, 1
- Gunn et al. (2006) Gunn, J. E., Siegmund, W. A., Mannery, E. J., et al. 2006, AJ, 131, 2332
- Haffner et al. (1999) Haffner, L. M., Reynolds, R. J., & Tufte, S. L. 1999, ApJ, 523, 223
- Haffner et al. (2009) Haffner, L. M., Dettmar, R.-J., Beckman, J. E., et al. 2009, Reviews of Modern Physics, 81, 969
- Harrison et al. (2014) Harrison, C. M., Alexander, D. M., Mullaney, J. R., & Swinbank, A. M. 2014, MNRAS, 441, 3306
- Hoopes & Walterbos (2003) Hoopes, C. G., & Walterbos, R. A. M. 2003, ApJ, 586, 902
- Hopkins et al. (2014) Hopkins, P. F., Kereš, D., Oñorbe, J., et al. 2014, MNRAS, 445, 581
- Hoyle & Ellis (1963) Hoyle, F., & Ellis, G. R. A. 1963, Australian Journal of Physics, 16, 1
- Hunt & Hirashita (2009) Hunt, L. K., & Hirashita, H. 2009, A&A, 507, 1327
- Jimmy et al. (2015) Jimmy, Tran, K.-V., Saintonge, A., et al. 2015, ApJ, 812, 98
- Joung et al. (2012) Joung, M. R., Putman, M. E., Bryan, G. L., Fernández, X., & Peek, J. E. G. 2012, ApJ, 759, 137
- Kauffmann et al. (2003) Kauffmann, G., Heckman, T. M., White, S. D. M., et al. 2003, MNRAS, 341, 33
- Kennicutt (1984) Kennicutt, R. C., Jr. 1984, ApJ, 287, 116
- Kennicutt et al. (2003) Kennicutt, R. C., Jr., Bresolin, F., & Garnett, D. R. 2003, ApJ, 591, 801
- Kennicutt & Evans (2012) Kennicutt, R. C., & Evans, N. J. 2012, ARA&A, 50, 531
- Kereš et al. (2005) Kereš, D., Katz, N., Weinberg, D. H., & Davé, R. 2005, MNRAS, 363, 2
- Kereš et al. (2009a) Kereš, D., Katz, N., Fardal, M., Davé, R., & Weinberg, D. H. 2009a, MNRAS, 395, 160
- Kereš et al. (2009b) Kereš, D., Katz, N., Davé, R., Fardal, M., & Weinberg, D. H. 2009b, MNRAS, 396, 2332
- Kewley & Dopita (2002) Kewley, L. J., & Dopita, M. A. 2002, ApJS, 142, 35
- Kewley et al. (2006) Kewley, L. J., Groves, B., Kauffmann, G., & Heckman, T. 2006, MNRAS, 372, 961
- Lanzetta et al. (1995) Lanzetta, K. M., Bowen, D. V., Tytler, D., & Webb, J. K. 1995, ApJ, 442, 538
- Law et al. (2015) Law, D. R., Yan, R., Bershady, M. A., et al. 2015, AJ, 150, 19
- Leaman et al. (2015) Leaman, R., Erroz-Ferrer, S., Cisternas, M., & Knapen, J. H. 2015, MNRAS, 450, 2473
- Levesque et al. (2010) Levesque, E. M., Kewley, L. J., & Larson, K. L. 2010, AJ, 139, 712
- Li et al. (2015) Li, C., Wang, E., Lin, L., et al. 2015, ApJ, 804, 125
- Madsen et al. (2006) Madsen, G. J., Reynolds, R. J., & Haffner, L. M. 2006, ApJ, 652, 401
- Miller & Veilleux (2003) Miller, S. T., & Veilleux, S. 2003, ApJ, 592, 79
- Monnet (1971) Monnet, G. 1971, A&A, 12, 379
- Nelson et al. (2013) Nelson, D., Vogelsberger, M., Genel, S., et al. 2013, MNRAS, 429, 3353
- Oppenheimer & Davé (2008) Oppenheimer, B. D., & Davé, R. 2008, MNRAS, 387, 577
- Oppenheimer et al. (2010) Oppenheimer, B. D., Davé, R., Kereš, D., et al. 2010, MNRAS, 406, 2325
- Osterbrock & Ferland (2006) Osterbrock, D. E., & Ferland, G. J. 2006, Astrophysics of gaseous nebulae and active galactic nuclei, 2nd. ed. by D.E. Osterbrock and G.J. Ferland. Sausalito, CA: University Science Books, 2006,
- Otte et al. (2001) Otte, B., Reynolds, R. J., Gallagher, J. S., III, & Ferguson, A. M. N. 2001, ApJ, 560, 207
- Otte et al. (2002) Otte, B., Gallagher, J. S., III, & Reynolds, R. J. 2002, ApJ, 572, 823
- Peng et al. (2002) Peng, C. Y., Ho, L. C., Impey, C. D., & Rix, H.-W. 2002, AJ, 124, 266
- Proxauf et al. (2014) Proxauf, B., Öttl, S., & Kimeswenger, S. 2014, A&A, 561, A10
- Rand et al. (1990) Rand, R. J., Kulkarni, S. R., & Hester, J. J. 1990, ApJ, 352, L1
- Rand (1997) Rand, R. J. 1997, ApJ, 474, 129
- Rand (1998) Rand, R. J. 1998, ApJ, 501, 137
- Rand et al. (2008) Rand, R. J., Wood, K., & Benjamin, R. A. 2008, ApJ, 680, 263-275
- Reynolds (1985) Reynolds, R. J. 1985, ApJ, 294, 256
- Reynolds & Cox (1992) Reynolds, R. J., & Cox, D. P. 1992, ApJ, 400, L33
- Reynolds et al. (1999) Reynolds, R. J., Haffner, L. M., & Tufte, S. L. 1999, ApJ, 525, L21
- Reynolds et al. (2012) Reynolds, R. J., Haffner, L. M., Madsen, G. J., Wood, K., & Hill, A. S. 2012, EAS Publications Series, 56, 213
- Rossa & Dettmar (2003) Rossa, J., & Dettmar, R.-J. 2003, A&A, 406, 493
- Rubin et al. (2012) Rubin, K. H. R., Prochaska, J. X., Koo, D. C., & Phillips, A. C. 2012, ApJ, 747, L26
- Salim et al. (2007) Salim, S., Rich, R. M., Charlot, S., et al. 2007, ApJS, 173, 267
- Sánchez et al. (2014) Sánchez, S. F., Rosales-Ortega, F. F., Iglesias-Páramo, J., et al. 2014, A&A, 563, A49
- Sánchez Almeida et al. (2013) Sánchez Almeida, J., Muñoz-Tuñón, C., Elmegreen, D. M., Elmegreen, B. G., & Méndez-Abreu, J. 2013, ApJ, 767, 74
- Sánchez Almeida et al. (2014) Sánchez Almeida, J., Elmegreen, B. G., Muñoz-Tuñón, C., & Elmegreen, D. M. 2014, A&A Rev., 22, 71
- Sánchez Almeida et al. (2015) Sánchez Almeida, J., Elmegreen, B. G., Muñoz-Tuñón, C., et al. 2015, ApJ, 810, L15
- Sancisi et al. (2008) Sancisi, R., Fraternali, F., Oosterloo, T., & van der Hulst, T. 2008, A&A Rev., 15, 189
- SDSS Collaboration et al. (2016) SDSS Collaboration, Albareti, F. D., Allende Prieto, C., et al. 2016, arXiv:1608.02013
- Shapiro & Field (1976) Shapiro, P. R., & Field, G. B. 1976, ApJ, 205, 762
- Simard et al. (2011) Simard, L., Mendel, J. T., Patton, D. R., Ellison, S. L., & McConnachie, A. W. 2011, ApJS, 196, 11
- Smee et al. (2013) Smee, S. A., Gunn, J. E., Uomoto, A., et al. 2013, AJ, 146, 32
- Stewart et al. (2016) Stewart, K., Maller, A., Oñorbe, J., et al. 2016, arXiv:1606.08542
- Straughn et al. (2015) Straughn, A. N., Voyer, E. N., Eufrasio, R. T., et al. 2015, ApJ, 814, 97
- Tremonti et al. (2004) Tremonti, C. A., Heckman, T. M., Kauffmann, G., et al. 2004, ApJ, 613, 898
- Tüllmann et al. (2000) Tüllmann, R., Dettmar, R.-J., Soida, M., Urbanik, M., & Rossa, J. 2000, A&A, 364, L36
- Tumlinson et al. (2011) Tumlinson, J., Thom, C., Werk, J. K., et al. 2011, Science, 334, 948
- van den Bergh et al. (1996) van den Bergh, S., Abraham, R. G., Ellis, R. S., et al. 1996, AJ, 112, 359
- van de Voort & Schaye (2012) van de Voort, F., & Schaye, J. 2012, MNRAS, 423, 2991
- Vazdekis et al. (2012) Vazdekis, A., Ricciardelli, E., Cenarro, A. J., et al. 2012, MNRAS, 424, 157
- Voges & Walterbos (2006) Voges, E. S., & Walterbos, R. A. M. 2006, ApJ, 644, L29
- Werk et al. (2013) Werk, J. K., Prochaska, J. X., Thom, C., et al. 2013, ApJS, 204, 17
- Werk et al. (2014) Werk, J. K., Prochaska, J. X., Tumlinson, J., et al. 2014, ApJ, 792, 8
- Wilkinson et al. (2015) Wilkinson, D. M., Maraston, C., Thomas, D., et al. 2015, MNRAS, 449, 328
- Wood & Mathis (2004) Wood, K., & Mathis, J. S. 2004, MNRAS, 353, 1126
- Yan et al. (2006) Yan, R., Newman, J. A., Faber, S. M., et al. 2006, ApJ, 648, 281
- Yan et al. (2016) Yan, R., Tremonti, C., Bershady, M. A., et al. 2016, AJ, 151, 8
- York et al. (2000) York, D. G., Adelman, J., Anderson, J. E., Jr., et al. 2000, AJ, 120, 1579