Experimental Results on Charge Fluctuations in Heavy-ion Collisions
Abstract
We present a subset of experimental results on charge fluctuation from the heavy-ion collisions to search for phase transition and location of critical point in the QCD phase diagram. Measurements from the heavy-ion experiments at the SPS and RHIC energies observe that total charge fluctuations increase from central to peripheral collisions. The net-charge fluctuations in terms of dynamical fluctuation measure are studied as a function of collision energy () and centrality of the collisions. The product of and shows a monotonic decrease with collision energies, which indicates that at LHC energy the fluctuations have their origin in the QGP phase. The fluctuations in terms of higher moments of net-proton, net-electric charge and net-kaon have been measured for various . Deviations are observed in both and for net-proton multiplicity distributions from the Skellam and hadron resonance gas model for 39 GeV. Higher moment results of the net-electric charge and net-kaon do not observe any significant non-monotonic behavior as a function of collision energy. We also discuss the extraction of the freeze-out parameters using particle ratios and experimentally measured higher moments of net-charge fluctuations. The extracted freeze-out parameters from experimentally measured moments and lattice calculations, are found to be in agreement with the results obtained from the fit of particle ratios to the thermal model calculations.
pacs:
25.75.-q, 25.75.Ag, 25.75.BhI Introduction
The main goal of the high energy heavy-ion collisions is to study the phase structure of the Quantum Chromodynamic (QCD) phase diagram at finite temperature () and baryon chemical potential () Stephanov:1998dy ; Alford:1997zt ; Stephanov:1996ki ; Aoki:2006we ; Fukushima:2010bq . Several theoretical models suggest that the QCD phase diagram may contain a first order phase transition line between the hadron gas (HG) phase and Quark-Gluon phase which ends at the critical point towards high and lower Stephanov:2004wx ; Fodor:2004nz ; Stephanov:1999zu ; Mukherjee:2015swa ; Mukherjee:2016kyu . Experimental programs have been performed at SPS and beam-energy scan (BES-I) program at RHIC to search for critical point and QGP-HG phase transition. In future, the upcoming program at RHIC (BES-II) BES-II , FAIR FAIR , NICA NICA and J-PARC JPARC will also contribute to the physics at large . The location of the QCD critical point can be explored by systematically varying and . Experimentally, by changing the center of mass energy one can control the and of the system, hence enables us to scan different sectors of the phase diagram.
One of the most striking signatures of such a QGP-HG phase transition could be a strong modification in the fluctuations of specific observables measured on an event-by-event basis Asakawa:2000wh ; Stodolsky:1995ds . In principle, any observable that is not globally conserved, fluctuates. Although, most of these fluctuations are trivial and are of statistical origin. It is important to find out the dynamically relevant event-to-event fluctuation, that enables to the search for a possible critical point and a first order co-existence region in the QCD phase diagram Adams:2003st . Over the past two decades quite a number of such observables have been suggested for clarifying the evolution of the system formed in heavy-ion collisions. These either refer to the signals from the plasma that are supposed to survive the phase transition or to the observables that experience strong fluctuation during the phase transition or close to the critical point. Most commonly measured event-by-event fluctuations in heavy ion collision experiments are particle ratios (, etc.), transverse energy , mean transverse momentum and particle multiplicity fluctuations Abelev:2009ai ; Alt:2008ab ; Adcox:2002pa ; Adler:2003xq . Predictions suggest that, enhanced multiplicity fluctuations are connected to the production of QGP droplets, and suppression of fluctuation is connected to the nucleation process in a first order QGP–HG phase transition. This may happen because of the rapid freeze-out just after the phase transition Asakawa:2000wh ; Jeon:2000wg . An isothermal compressibility of the system can be considered to understand the sensitivity of the measured particle multiplicity to the phase transition Mrowczynski:1997kz . The isothermal compressibility is defined as , where and being the pressure, volume, and temperature of the system, respectively. In order to relate the compressibility to the measurements of multiplicity fluctuations, we assume that relativistic heavy-ion collisions can be described as a thermal system in the Grand Canonical Ensemble (GCE) Begun:2004pk . The GCE is the most appropriate description as only part of the particles from the system around mid-rapidity are measured by the experiments. The energy and conserved quantum numbers in this region can be exchanged with the rest of the system, that serves as a heat bath Jeon:2003gk . Several other studies have applied Canonical and Micro-canonical ensembles to the multiplicity fluctuations too Begun:2004gs ; Becattini:2005cc ; Garg:2015owa . In the GCE, the isothermal compressibility is directly related to the variance of the particle multiplicity as follows:
| (1) |
where is the particle multiplicity, is the mean of the multiplicity distribution, and is the Boltzmann constant Stanley . Here, multiplicity fluctuation measurements are presented in terms of the scaled variance, as Adare:2008ns :
| (2) |
In a continuous, or second-order phase transition, the compressibility diverges at the critical point. Near the critical point, this divergence is described by a power law in the variable , where is the critical temperature. Hence, the relationship between multiplicity fluctuations and the compressibility can be exploited to search for a signature of critical behavior by looking for the expected power law scaling of the compressibility:
| (3) |
where is the critical exponent for isothermal compressibility Stanley . Recent studies Schaefer:2006ds ; Sasaki:2006ws show the behavior of the quark number susceptibility, , which is related to the value of the isothermal compressibility of the system. They predict that its value will increase by at least an order of magnitude close to the QCD critical point. As discussed above, the scaled variance is proportional to , hence the measurements of charged particle multiplicity are expected to be a sensitive probe for critical behavior.
If the system approaches close enough to the critical line for a long enough time period, then critical phenomena could be observed through the measurement of multiplicity fluctuations Stephanov:1999zu . Subsequently, it may also be possible to determine the critical exponents of the system. Observation of critical behavior in heavy ion collisions and the subsequent measurement of the critical exponents could determine the universality class in which QCD is grouped, providing essential constraints for the models Adare:2008ns .
The fluctuations of conserved quantities are predicted to be one of the most sensitive signals of the QGP formation and phase transition, which may provide complementary understanding of strong interactions, apart from other QGP signatures Koch:2005vg ; Asakawa:2000wh . It has been argued that entropy conserving hadronization of a plasma of quarks and gluons should produce a final state characterized by a dramatic reduction of the net-charge fluctuations in QGP phase as compared to that of a hadron gas. Further, prediction relies on the notion that quark-quark correlations can be neglected, and hadronization of gluons produces pairs of positive and negative particles not contributing to the net-charge fluctuations. It has also been suggested that, the excitation function of conserved numbers like net-baryon, net-charge and net-strangeness fluctuations should show a non-monotonic behavior, as a possible signature of QCD critical end point (CEP) Stephanov:1998dy ; Stephanov:2011pb ; Asakawa:2009aj . In the thermodynamic limit, the correlation length () diverges at CEP Stephanov:1998dy . The experimentally measured moments of the net-baryon, net-charge, and net-strangeness distributions are related to the higher power of of the system and hence these moments can be used to look for signals of a phase transition and critical point Ejiri:2005wq ; Bazavov:2012vg . Also, the comparison of experimentally measured cumulants with the lattice calculations enables us to extract the freeze-out parameters i.e. freeze-out temperature () and of the system produced in heavy-ion collisions Borsanyi:2014ewa ; Alba:2014eba . In recent years, lots of efforts have been put on both theoretical and experimental fronts to study the fluctuation of conserved quantities.
This review is organized as follows: In the following section, we discuss the total charge fluctuations from various experiments. In Sec. III, the results on net-charge fluctuation are presented, which include dynamical fluctuation measure , higher moments of net-proton, net-electric charge and net-kaon fluctuations. Towards end of the Sec. III, extraction of freeze-out parameters using higher moments are discussed. Finally, in Sec. IV, we summarize our observations.
II Total charge fluctuation
In a thermodynamical system of strongly interacting matter formed in the heavy-ion collisions, the fluctuations of particle multiplicities, mean transverse momentum (), transverse energy () and other global observables are related to the fundamental properties of the system, such as specific heat, chemical potential and compressibility. These observables either refer to signals from the plasma that are supposed to survive the phase transition or to observables that experience strong fluctuations during the phase transition or close to the critical point. The existence of a critical point at the QCD phase transition has been associated with the large event-by-event fluctuations of above observables. As far as observables are concerned, electric charge fluctuations have been measured over a wide range of collision energies, from CERN SPS to RHIC and LHC energies. Enhanced fluctuations in neutral to charged pions have been predicted as a signature of the formation of Disoriented Chiral Condensates (DCC) Aggarwal:2000aw ; Rajagopal:1993ah . The relative fluctuation which can be extracted from experimental data has contributions both from statistical as well as dynamical sources. In order to extract the dynamical part associated with new physics from the observed fluctuations, one has to understand the contributions from statistical and other known sources. Some of the known sources of fluctuations contributing to the observed experimental value of scaled variance () include, finite particle multiplicity, effect of limited acceptance of the detectors, impact parameter fluctuations, fluctuations in the number of primary collisions, effects of re-scattering of secondaries, resonance decays, and Bose-Einstein correlations Heiselberg:2000fk .

The relative fluctuation is defined as
| (4) |
where is the charged particle multiplicity, is also known as scaled variance. If the multiplicity distribution is Poissonian, the scaled variance is 1.0. Figure 1 shows the comparison of the relative fluctuation of the charge particle multiplicity as a function of collision centrality which is related to number of participants () in Pb + Pb collisions at 158 A GeV Aggarwal:2000aw . The error on calculated in the model is mainly due to the error on the mean number of charged particles in nucleon-nucleon interactions, the error in the number of participants calculated, and the uncertainty in the calculated transverse energy Aggarwal:2000aw . The experimental data are compared with the model calculations. It is observed that the relative fluctuations increase from central to peripheral collisions. The observed charge particles multiplicity fluctuations have been found to well agreed with the results obtained from a simple participant model Baym:1999up . In the participant model, the particle multiplicity may be expressed as
| (5) |
where is the number of participants in the collision and is the number of particles produced by the th participant within the detector acceptance. The mean value of is the ratio of the average multiplicity measured in the detector acceptance to the average number of participants, . Hence, fluctuation in the particle multiplicity will have contributions due to fluctuations in , () and also due to the fluctuations in the number of particles produced per participant (). The multiplicity fluctuation in the participant model can be expressed as Aggarwal:2000aw
| (6) |
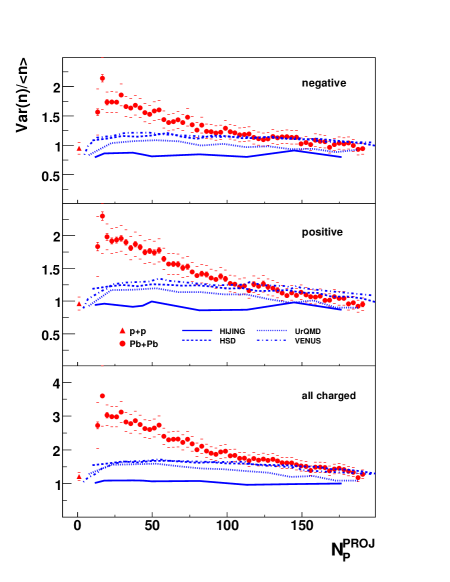
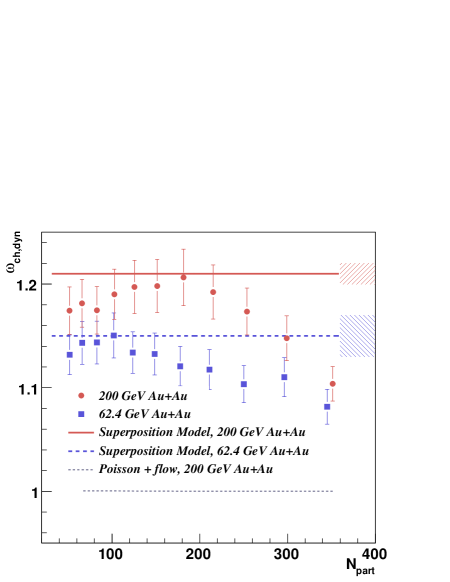
Another experiment at SPS also performed similar study shown in Fig. 2 Alt:2006jr . The scaled variance (), where is the variance of the distribution and being the multiplicity of the particles. The scaled variance of positive, negative and total charged particles as a function of centrality is shown in Fig. 2. The experimental data is compared with the model calculations. The results from different models (HIJING Gyulassy:1994ew , HSD Cassing:1999es , UrQMD Bleicher:1999xi , and VENUS Werner:1993uh ) are almost independent of centrality and behave like a Poisson expectation. However, the experimental data points indicate strong dependence on centrality. The scaled variance increases from central to peripheral collisions. The measured centrality dependence can be reproduced in superposition models with the assumption of contributions from target participants to the particle production in the forward hemisphere Alt:2006jr ; Konchakovski:2005hq . Figure 3 shows the centrality () dependence of scaled variance at = 62.4 and 200 GeV in Au + Au collisions at RHIC Adare:2008ns . The shaded regions represent the systematic uncertainties from the reference range. The statistical uncertainties are shown along with the data points. Here, represents the estimate of the remaining dynamical multiplicity fluctuations. For all centralities, the scaled variance lies above the Poisson expectation of 1.0. At these energies, also the scaled variance increases from central to peripheral collisions. Hence, similar centrality dependence has been observed by the experiments at the SPS and RHIC energies. The absence of large dynamical fluctuation in excess of the participant superposition model indicates that there is no evidence of critical behavior related to the compressibility observable.
III Net-charge fluctuations
One of the proposed signatures to search for the phase transition from hadronic to partonic medium is to study the net-charge fluctuations in heavy ion collisions. The fluctuation in the net charge depends on the square of the charges and hence strongly depend on which phase it originates from. The charge carriers in the QGP phase are quarks having fractional charges, while in hadronic phase the constituents have unit charge, hence the measure of the fluctuations in the net-charge is expected to be different in these two cases Jeon:2000wg . In this section, we discuss the net-charge fluctuations using different fluctuation measures such as and higher moments.
III.1 Fluctuation study using
The net-charge fluctuations are expected to be smaller in the QGP phase as compared to the hadron gas (HG) phase Jeon:2000wg . The net-charge fluctuations may get affected by uncertainties due to volume fluctuation, exact local charge conservation or repulsive forces among hadrons Alba:2014eba . However, it is important to know whether these fluctuations may or may not survive the evolution of the system in the heavy-ion collisions. The collision volume is not directly measured in the experiment which may lead to additional geometrical fluctuations. One can get rid of volume fluctuation by considering the ratios of the number of positive () to negative () particles, . The ratio fluctuation is defined by . Since the fluctuation of the number of charged particles is a measure of the entropy of the system, another fluctuation observable measure of the net-charge provides a measure of charge fluctuations per unit entropy and is related to the ratio as:
| (7) | |||||
where is the variance of the net-charge with is the difference between ve and ve particles and is the average number of charged particles measured within the experimental acceptance. Assuming the quark-quark interactions to be negligible, the found to be approximately 4 times smaller in QGP phase as compared to HG phase. It has been shown that 4 for uncorrelated pion gas, and reduces to 3 after taking the resonance decay into account Jeon:2003gk . For a QGP phase, the is estimated between 1.0–1.5. Hence, can be used as a probe to distinguish between the QGP and HG phase. Unfortunately, the quantity depends on the experimental efficiency. In the experiments, the net-charge fluctuations are studied in terms of dynamical fluctuation measure , which is found to be independent of detection efficiency. The quantity is a measure of the relative correlation strength of , and particle pairs. A positive value of signifies the correlation of same charge pair, where as a negative value indicates the dominant contribution from correlations between opposite charges. The is defined by:
| (8) | |||||
where and are the average number of positively and negatively charged particles within the detector acceptance. The measure and are related as Pruneau:2002yf .
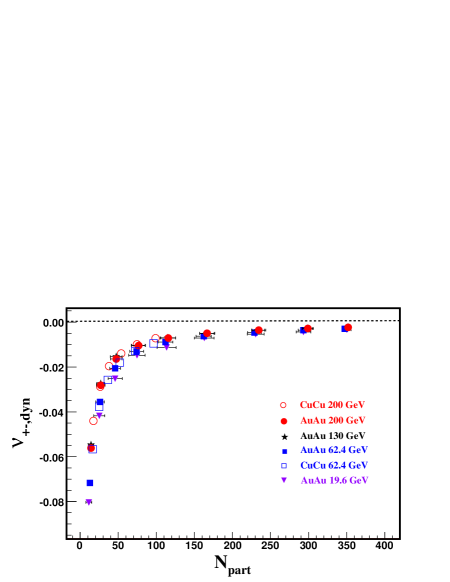
Figure 4 shows the centrality () dependence of dynamical net-charge fluctuations () in Au + Au and Cu + Cu collisions at different . The values exhibit a monotonic dependence on and have small dependence on collision energy. For all the studied energies, the values of are negative, which indicates the dominance of correlation of positive and negative charged particle term in Eq. 8. The observed monotonic reduction of the magnitude of with increasing number of participants, arises mainly due to the progressive dilution of two-particle correlation when the number of particle sources are increased.
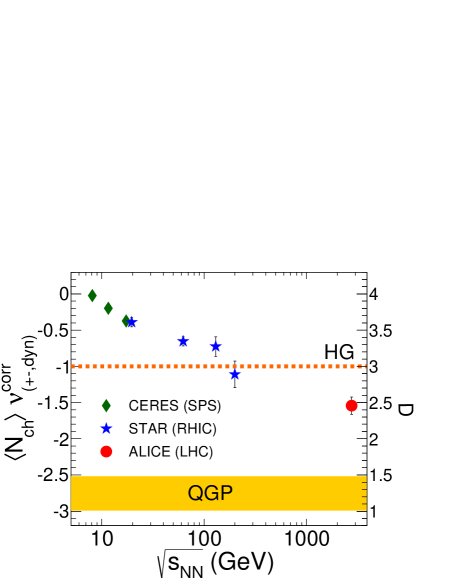
In view of prediction for critical point in the QCD phase diagram in the range 10 60 GeV Abelev:2008jg ; Stephanov:1999zu , it can be argued that, the reduction of fluctuation might be larger at lower beam energies. On the other hand, one may also argue that, the volume of the QGP formed in Au + Au collisions might increase at higher beam energies leading to reduced fluctuations. Hence, it is important to understand whether the fluctuations may be found to vary with beam energy thereby indicating the production of QGP above a critical threshold, or with progressively increasing probability at higher energies. Figure 5 shows the product of and (average number of charged particles) as a function of collision energies for 0–5% central collisions using the combined data from SPS, RHIC, and LHC energies Abelev:2012pv ; Abelev:2008jg ; Sako:2004pw . Also, the collision energy dependence of measure is shown in the same Fig. 5. It is observed that the fluctuation observable shows monotonic decrease in magnitude with increasing and approaches expectation for a simple QGP-like scenario Jeon:2000wg as we move from RHIC to LHC energies. It has been argued that measurements in lower (below 10 GeV) are dominated by baryons while at higher energies the meson and resonance production becomes increasingly dominant. This suggests that the change in dynamical net-charge fluctuations below = 19.6 GeV might be partially due to this shift in particle production dominance Abelev:2008jg ; Stephanov:1998dy ; Stephanov:1999zu ; Shuryak:2000pd ; Aziz:2004qu ; Gavin:2003cb . It is also argued that the differences between the fluctuation values below and above 19.6 GeV may result from changes in the collision dynamics and final state interaction effects Stephanov:1999zu ; Shuryak:2000pd ; Aziz:2004qu ; Gavin:2003cb ; Bopp:2001xc . For the highest RHIC energy, the measured value of fluctuation observable is close to the HG prediction, whereas at lower energies the results are higher than HG value. This may be due to the fact that at highest RHIC energy ( = 200 GeV) the fluctuation may not be strong enough to be measured or because of the dilution of fluctuation during the evolution process. At LHC energy = 2.76 TeV, the fluctuation observable value is significantly lower as compared to lower energies results. The fluctuations at the LHC energy might also have been diluted because of various effects, still these fluctuations are smaller than the theoretical expectations. In Ref. Jeon:2000wg , it is shown that the measure value for hadron gas with resonance decay is 3 and for QGP phase is 1.01.5. The measured measure value is 2.3 0.21 for 1.6 at = 2.76 TeV. There is a clear decreasing tendency of the measure value in the HG phase and approaches toward QGP expectation. This may indicate that the fluctuations have their origin in the QGP phase Abelev:2012pv .
Given that several other observables already indicate that a hot and dense medium of color charges has been formed at RHIC and LHC energies. The net-charge fluctuation results suggest that either the observable is not sensitive enough to QGP physics or the process of hadronization washed out the QGP signal for this observable. It may be also noted that the theoretical results do not incorporate the acceptance effects and dynamical evolution of the system like for example the dilution of the signals in the hadronization process Singh:2013fha .
III.2 Fluctuation study using higher moments
In recent years, the beam energy scan (BES) programs at SPS and RHIC have drawn much attention to map the quantum chromodynamics (QCD) phase diagram in terms of temperature () and baryon chemical potential (). The location of the critical point can be explored by systematically varying and , which can be experimentally achieved by varying the of the colliding ions. Several theoretical models suggest that, excitation function of conserved numbers such as net-baryon, net-charge, and net-strangeness fluctuations should show a non-monotonic behavior as a possible signature of QCD critical end point (CEP) Stephanov:2004wx ; Fodor:2004nz ; Stephanov:1999zu . In the vicinity of the QCD critical point, these variances are proportional to the square of the correlation length (), which is expected to diverge at the critical point Stephanov:2011pb ; cbm_book . However, the magnitude of the correlation length is limited by the system size and by finite time effects (critical slowing down), which could be as small as 2 to 3 fm. Hence, the contribution to the fluctuations from the critical point might be too weak as to be discovered experimentally, if only the second moments are measured. Therefore, it has been proposed to measure higher moments of the fluctuations which are expected to be much more sensitive to the critical point Asakawa:2009aj ; Stephanov:2008qz ; Hatta:2003wn . The moments of the net-baryon, net-charge, and net-strangeness distributions are related to the of the system and hence these moments can be used to look for signals of a phase transition and critical point Stephanov:1998dy ; Ejiri:2005wq ; Bazavov:2012vg . The variance () of these distributions is related to as , the skewness () goes as , and the kurtosis () is related as . Hence it is proposed to study the higher moments of conserved number distribution due to their stronger dependence on .
Experimentally, the net-baryon number fluctuations are not directly measured, as all neutral baryons are not detected by most of the experiments. Hence, net-baryon fluctuations are accessible via measuring the net-proton distributions Aggarwal:2010wy ; Adamczyk:2013dal . The net-charge fluctuations are accessible by measuring the stable charged particles such as pions, kaons, and protons along with their antiparticles Adamczyk:2014fia ; Adare:2015aqk . Similarly, the measurement of net-kaon fluctuations acts as a proxy for net-strangeness fluctuations, because higher mass strange particles are not directly measured Sarkar:2014wva ; Thader:2016gpa . In the following subsections we discuss each of the conserved number fluctuations separately.
The moments of the event-by-event experimentally measured net distributions are related to the different order of the cumulants of the distribution as: mean () = ; ; , and , where is the multiplicity of the distribution and = . Hence, the ratios of the cumulants are related to the moments as: , , and . Further, the ratios of moments can be related to the susceptibilities of th order () obtained from the lattice QCD or from the HRG model calculations as , , , and Karsch:2010ck . One advantage of measuring the ratios is that the volume dependence (which is not directly measured by the experiment) on the experimentally measured individual cumulants cancels out to first order in the ratios. Hence experimentally measured quantities can be directly compared with the theoretical calculations Gupta:2011wh ; Karsch:2010ck .
III.2.1 Net-proton fluctuation
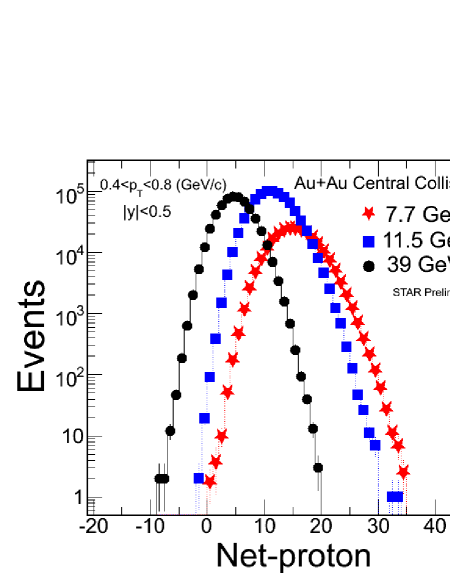
Theoretical calculations have shown that net-proton fluctuations reflect the singularity of the charge and baryon number susceptibility as expected at the critical point Hatta:2003wn . Figure 6 shows the typical uncorrected net-proton () distributions in Au + Au collisions for 0–5% centrality measured on event-by-event basis. The protons and antiprotons are measured within = 0.4 to 0.8 GeV/ and 0.5. At lower energies, the net-proton distributions are dominated by the contributions from the proton distributions. The mean value of the distribution increases with decrease in collision energy. Different moments which describe the shape of the distribution are extracted from the distribution.
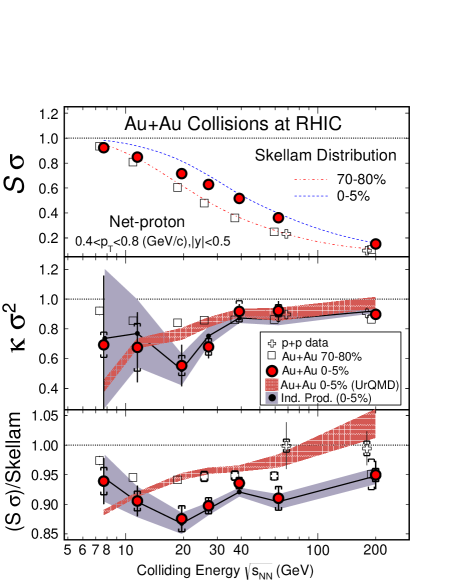
Figure 7 shows the collision energy dependence of and of net-proton distribution for 0–5% and 70–80% centralities in Au + Au collisions. The statistical uncertainties are calculated using Delta theorem approach Luo:2011tp . In the hot and dense medium, the baryon chemical potential decreases with increasing collision energies, hence Fig. 7 can be interpreted as the dependence of the moments over the large range of (20–450 MeV) Adamczyk:2013dal . Deviations are observed for both and from the Skellam and hadron resonance gas model for 39 GeV. Maximum deviations from Skellam expectation are observed for = 19.6 and 27 GeV. The experimental results are reasonably described by assuming independent production (IP) of and indicating there is no apparent correlations between the proton and anti-protons for presented observables Adamczyk:2013dal . Therefore, one may ask, in spite of significantly correlated production due to baryon number, electric charge conservation and kinematical correlations of proton and antiprotons, why do the measured cumulants follow the independent production model. This has been studied by introducing the correlation between two independently produced distributions. It is observed that, experimentally measured cumulants will follow the IP model calculations even if the correlation coefficient is less than ∼20% Mishra:2015ueh . However, and values will follow the IP model for all the correlation coefficient values. The observation that the experimental data can be explained by the independent production of particles does not rule out the existence of the critical endpoint.
III.2.2 Net-charge fluctuation
The net-electric charge fluctuations are accessible through measuring fluctuations of stable charged particles (, , and ). Net-electric charge fluctuations are more straightforward to measure experimentally than net-baryon number fluctuations. As discussed before, experimentally, net-baryon number fluctuations are accessible only through net-proton number fluctuations, but in lattice QCD calculations net-baryon fluctuations are calculated instead of net-proton fluctuations. While net-charge fluctuations are not as sensitive as net-baryon fluctuations to the theoretical parameters, both measurements are necessary for a full understanding of the theory Adare:2015aqk . Several studies suggest that, the net-charge multiplicity distributions are better suited to extract the freeze-out parameters ( and ) and the location of the CEP as they directly probe a conserved quantum number (electric charge) Skokov:2011rq ; Kitazawa:2011wh ; Bazavov:2012vg .
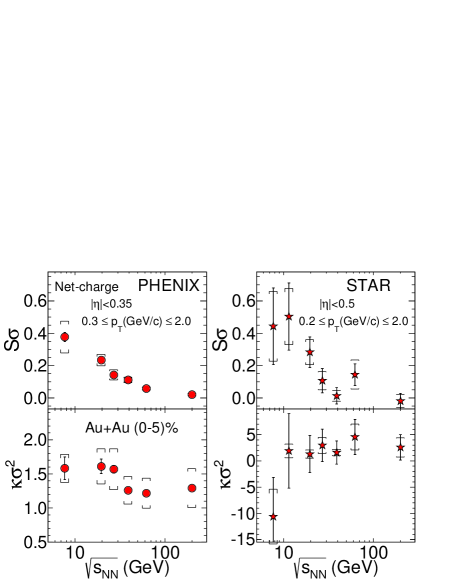
Figure 8 shows the collision energy dependence of efficiency corrected and of the net-charge distributions for central 0–5% Au + Au collisions at RHIC. The and measurements from the PHENIX experiment are shown in left panels Adare:2015aqk and measurements from the STAR experiment are shown in right panels Adamczyk:2014fia . The statistical errors are calculated using Delta theorem method Luo:2011tp . Here, we would like to briefly discuss about the statistical error calculations in both the STAR and PHENIX experiments. The errors on and are correlated and are dependent on both variance () of the distribution and the number of events. As mentioned in Luo:2011tp , the statistical errors are more dependent on than the number of events. Hence, experiments having larger multiplicity distribution will have larger errors on and . Since STAR experiment has larger acceptance compared to PHENIX, it contributes to larger statistical error. Further, STAR net-charge distributions have larger compared to net-proton distributions, which contributes to the larger statistical error in the net-charge results than the net-proton results, although the number of analyzed events are similar. The values from both the experiments decrease with increasing . The values from PHENIX (left lower panel) remain constant and positive, between 1.0 2.0 at all the collision energies within the statistical and systematic uncertainties. However, there is ∼25% increase of values at lower energies below = 39 GeV compared to higher energies. Further, the values from the STAR experiment are constant at all energies within uncertainties, except for = 7.7 GeV which shows a negative value. The STAR experiment reported higher weighted mean (2.4 1.2) of values as compared to PHENIX values. It is to be noted that, results from the PHENIX experiment are measured within 0.3 (GeV/) 2.0 and 0.35 with 2 in azimuth, where as results from the STAR experiment are within 0.2 (GeV/) 2.0 and 0.5 with full azimuth (2). Different lower cut may be responsible for about 30% of the difference between two data sets Karsch:2015zna . More discussion on acceptance effect on higher moments can be found in Refs. Garg:2013ata ; Karsch:2015zna ; Ling:2015yau . However, net-charge results from both the experiments do not observe any significant non monotonic behavior in the products of moments as a function of collision energy.
III.2.3 Net-Kaon fluctuation
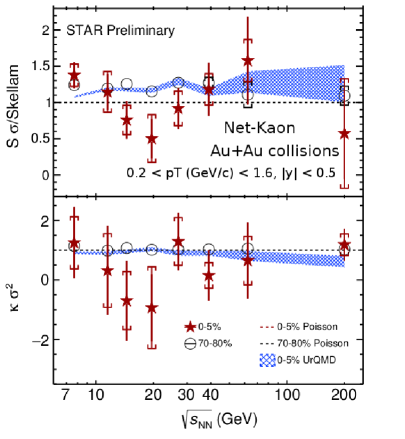
Experimentally, the net-strangeness fluctuations are accessible through measuring the net-kaon fluctuations. Figure 9 shows the preliminary results on collision energy dependence of efficiency corrected and of the net-kaon distributions for 0–5% and 70–80% centralities in Au + Au collisions measured by STAR experiment at RHIC Thader:2016gpa . With large uncertainties in the measurement, no significant deviation of the product of higher moments for net-kaon distributions as compared to the Poisson expectation has been observed at the measured energies. However, in the upcoming RHIC BES-II, with the upgraded detector system will help to reduce the uncertainties on the measurements and may find the location of the critical point.
III.3 Extraction of freeze-out parameters using higher moments
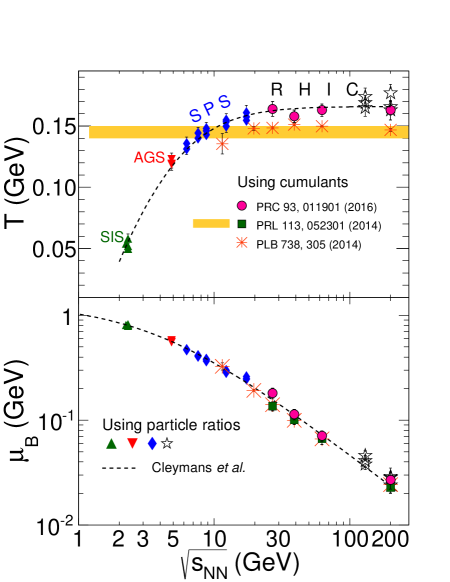
Product of higher moments can be used to extract the freeze-out parameters ( and ) of the QCD phase diagram Bazavov:2012vg ; Borsanyi:2014ewa ; Alba:2014eba . From the lattice calculations, it has been observed that, the ratio of 1st to 2nd cumulants () shows a strong dependence on but varies little with . On the other hand, the ratio of 3rd to 1st cumulants () shows strong dependence on and has little dependence on Bazavov:2012vg ; Borsanyi:2014ewa . Hence, lattice calculations in combination with experimentally measured values at different collision energies can be used to extract the , whereas the measured can be used to extract the . The collision energy dependence of freeze-out parameters and are shown in Fig. 10. Freeze-out parameters extracted from different methods such as using particle ratios Cleymans:2005xv and using cumulants with lattice Adare:2015aqk agrees very well. Further, the extracted and values using lattice calculations and experimental data Adare:2015aqk are in agreement with the thermal model parameterization Cleymans:2005xv . The freeze-out parameters extracted using combination of experimental data and HRG model Alba:2014eba are also shown in Fig. 10. The HRG calculations are performed in the same acceptance as the experiment. The extracted values using HRG and experimental measured cumulants are in agreement with other measurements, but the extracted are about 7–10 MeV lower as compared to the values extracted using lattice calculations Alba:2014eba ; Adare:2015aqk . The values are consistent across different extraction procedure but there is some discrepancy in the value of . One of the reason may be, are extracted using ratio of 1st and 2nd cumulants which are measured more precisely with compared to higher cumulants. In Ref. Alba:2014eba , the and are extracted using HRG for each by simultaneously reproducing the experimentally measured ratios of the lowest-order susceptibilities () for net-protons and net-electric charge. In Ref. Borsanyi:2014ewa , the freeze-out parameters are extracted using STAR experimental data Adamczyk:2014fia . The has been extracted using experimentally measured and lattice calculations, where as due to the uncertainties on the lattice results in the low-temperature region, it is only possible to extract an upper value for the freeze-out temperature ( MeV). In Ref. Adare:2015aqk , the freeze-out parameters are extracted using the and of net-charge from the PHENIX experiment Adare:2015aqk in combination with lattice calculations. Figure 10 shows the direct combination of experimental data and theoretical model calculations to extract physical quantities. The consistency of the results is of fundamental importance to validate that the experimentally created system is close to thermal equilibrium at the freeze-out and can be described by lattice QCD simulations, at least in the light quark sector Borsanyi:2014ewa .
IV Summary
In summary, we have presented a review on the experimental measurements on charge fluctuations over various collision energies to search for phase transition and location of the critical point in the QCD phase diagram. We reviewed the results on total charge fluctuations as a function of collision centrality for = 17.3 GeV in Pb + Pb collisions at SPS and for = 62.4 and 200 GeV in Au + Au collisions at RHIC. It is observed that, the relative fluctuations increase from central to peripheral collisions. The fluctuation observables from various models are compared with the experiment data. The results from models show centrality independent behavior. A similar centrality dependence has been observed for total charge fluctuation at the SPS and RHIC experiments. The absence of large dynamical fluctuation in excess of the participant superposition model indicate that there is no evidence of critical behavior related to the compressibility observable.
We have also presented the results from net-charge fluctuations from SPS, RHIC and LHC energies. The net-charge fluctuations in terms of dynamical fluctuation measure as a function of collision centrality and are studied. The increases monotonically from peripheral to central collisions and remains negative indicating the dominance of correlation of positive and negative charged particles. The product of and shows a monotonic decrease with increasing and approaches to the expectation from a QGP like scenario. For the highest RHIC energy, the measured value of fluctuation is close to the HG prediction, whereas at lower energies the results are higher than HG expectations. At LHC energy = 2.76 TeV, the value of fluctuation observable is significantly lower with compared to lower energy results indicating at LHC energy the fluctuations have their origin in the QGP phase.
The fluctuation of net-charge (net-proton, net-electric charge and net-kaon) have been measured for various . Deviations are observed for both and of net-proton distributions from the Skellam and hadron resonance gas model for 39 GeV. Maximum deviations from Skellam expectation are observed for = 19.6 and 27 GeV. The net-electric charge results from both PHENIX and STAR experiments are presented. The values from both the experiments decrease with increasing . The values from PHENIX remain constant and positive, between 1.0 2.0 at all the collision energies within the statistical and systematic uncertainties. However, there is ∼25% increase of values at lower energies below = 39 GeV compared to higher energies. The values from STAR experiment are constant at all energies within uncertainties, except for = 7.7 GeV which shows a negative value. The net-electric charge and net-kaon results do not observe any significant non monotonic behavior as a function of collision energy.
To quantify the excess of net-charge fluctuations due to the critical point, different baseline studies have been done by different authors after considering various physical phenomenon. On phenomenological side, effect of resonance decay Mishra:2016qyj ; Nahrgang:2014fza , proton-antiproton correlations Mishra:2015ueh ; Bzdak:2016sxg , kinematic acceptance Garg:2013ata ; Karsch:2015zna ; Ling:2015yau , non-extensive systems Mishra:2013qoa , regeneration Alba:2014eba ; Kitazawa:2012at and excluded volume models Fu:2013gga etc. are studied. Besides, various studies have been carried out using different monte carlo based models for example UrQMD Westfall:2014fwa and HIJING Tarnowsky:2012vu etc. to compare the experimental results. But it is to be noted that all the above mentioned physical processes contribute differently at various center of mass energies, therefore to find a unique ideal baseline estimate to compare the experimental results is still a unsettled issue. The freeze-out parameters are extracted using higher moments of net-charge distributions in combination with lattice QCD and HRG models. The extracted freeze-out parameters are in agreement with the thermal model parameterization.
First results from the RHIC BES-I program are intriguing and the statistics collected during BES-I at RHIC are not sufficient to locate the CEP in the QCD phase diagram. Hence the RHIC BES-II program is proposed to have the precise measurements of these observables to map the QCD phase diagram. The upcoming RHIC BES-II program proposed to be in 2019-20, will cover the range from 5 to 20 GeV, which is the region of interest in the search for a critical point and first-order phase transition, identified by the results from BES-I and by model calculations. In addition, the CBM experiment at FAIR will perform a high-precision study of higher-order fluctuations at various beam energies in order to search for the elusive QCD critical point in the high net-baryon density region: 800500 MeV corresponding to = 2–4.9 GeV at SIS100. There are other programs at NICA to study the above physics in heavy ion collisions in the range of 4–11 GeV. Hence, in the upcoming experimental programs at RHIC BES-II, FAIR and NICA with upgraded detector system will help to measure the fluctuation variable with reduced uncertainties on the measurements and may find the exact location of the critical point and investigate whole region of phase diagram in more detail.
Conflict of interest: The authors declare that there is no conflict of interest regarding the publication of this manuscript.
References
- (1) M. A. Stephanov, K. Rajagopal and E. V. Shuryak, Phys. Rev. Lett. 81, 4816 (1998).
- (2) M. G. Alford, K. Rajagopal and F. Wilczek, Phys. Lett. B 422, 247 (1998).
- (3) M. A. Stephanov, Phys. Rev. Lett. 76, 4472 (1996).
- (4) Y. Aoki, G. Endrodi, Z. Fodor, S. D. Katz and K. K. Szabo, Nature 443, 675 (2006).
- (5) K. Fukushima and T. Hatsuda, Rept. Prog. Phys. 74, 014001 (2011).
- (6) M. A. Stephanov, Prog. Theor. Phys. Suppl. 153, 139 (2004), Int. J. Mod. Phys. A 20, 4387 (2005).
- (7) Z. Fodor and S. D. Katz, JHEP 0404, 050 (2004).
- (8) M. A. Stephanov, K. Rajagopal and E. V. Shuryak, Phys. Rev. D 60, 114028 (1999).
- (9) S. Mukherjee, R. Venugopalan and Y. Yin, Phys. Rev. C 92, no. 3, 034912 (2015).
- (10) S. Mukherjee, R. Venugopalan and Y. Yin, Phys. Rev. Lett. 117, 222301 (2016).
- (11) STAR Collaboration, “Studying the Phase Diagram of QCD Matter at RHIC,” STAR Notes SN0598, https://drupal.star.bnl.gov/STAR/starnotes/public/sn0598 (2014).
- (12) R. Rapp et al., Lect. Notes Phys. 814 (2011) 335.
- (13) “Design and construction of nuclotron-based ion collider facility (NICA) conceptual design report”, http://nica.jinr.ru/files/NICA_CDR.pdf (2008).
- (14) “J-PARC Heavy Ion Project” http://asrc.jaea.go.jp/soshiki/gr/hadron/jparc-hi/documents.html
- (15) L. Stodolsky, Phys. Rev. Lett. 75, 1044 (1995).
- (16) M. Asakawa, U. W. Heinz and B. Muller, Phys. Rev. Lett. 85, 2072 (2000).
- (17) J. Adams et al. [STAR Collaboration], Phys. Rev. C 68, 044905 (2003).
- (18) B. I. Abelev et al. [STAR Collaboration], Phys. Rev. Lett. 103, 092301 (2009).
- (19) C. Alt et al. [NA49 Collaboration], Phys. Rev. C 79, 044910 (2009).
- (20) K. Adcox et al. [PHENIX Collaboration], Phys. Rev. C 66 024901 (2002).
- (21) S. S. Adler et al. [PHENIX Collaboration], Phys. Rev. Lett. 93, 092301 (2004).
- (22) S. Jeon, V. Koch and , Phys. Rev. Lett. 85, 2076 (2000).
- (23) S. Mrowczynski, Phys. Lett. B 430, 9 (1998).
- (24) V. V. Begun, M. I. Gorenstein, A. P. Kostyuk and O. S. Zozulya, Phys. Rev. C 71, 054904 (2005).
- (25) S. Jeon and V. Koch, In *Hwa, R.C. (ed.) et al.: Quark gluon plasma* 430-490 [hep-ph/0304012].
- (26) V. V. Begun, M. Gazdzicki, M. I. Gorenstein and O. S. Zozulya, Phys. Rev. C 70, 034901 (2004).
- (27) F. Becattini, A. Keranen, L. Ferroni and T. Gabbriellini, Phys. Rev. C 72, 064904 (2005).
- (28) P. Garg, D. K. Mishra, P. K. Netrakanti and A. K. Mohanty, Eur. Phys. J. A 52, no. 2, 27 (2016)
- (29) H. Stanley, Introduction to Phase Transitions and Critical Phenomena (Oxford, New York and Oxford) 1971.
- (30) A. Adare et al. [PHENIX Collaboration], Phys. Rev. C 78, 044902 (2008).
- (31) B. J. Schaefer and J. Wambach, Phys. Rev. D 75, 085015 (2007).
- (32) C. Sasaki, B. Friman and K. Redlich, Phys. Rev. D 75, 054026 (2007).
- (33) V. Koch, A. Majumder and J. Randrup, Phys. Rev. Lett. 95, 182301 (2005).
- (34) M. A. Stephanov, Phys. Rev. Lett. 107, 052301 (2011).
- (35) M. Asakawa, S. Ejiri and M. Kitazawa, Phys. Rev. Lett. 103, 262301 (2009).
- (36) S. Ejiri, F. Karsch and K. Redlich, Phys. Lett. B 633, 275 (2006).
- (37) A. Bazavov, H. T. Ding, P. Hegde, O. Kaczmarek, F. Karsch, E. Laermann, S. Mukherjee and P. Petreczky et al., Phys. Rev. Lett. 109, 192302 (2012).
- (38) S. Borsanyi, Z. Fodor, S. D. Katz, S. Krieg, C. Ratti and K. K. Szabo, Phys. Rev. Lett. 113, 052301 (2014).
- (39) P. Alba, W. Alberico, R. Bellwied, M. Bluhm, V. Mantovani Sarti, M. Nahrgang and C. Ratti, Phys. Lett. B 738, 305 (2014).
- (40) M. M. Aggarwal et al. [WA98 Collaboration], Phys. Rev. C 64, 011901 (2001).
- (41) K. Rajagopal and F. Wilczek, Nucl. Phys. B 404, 577 (1993).
- (42) H. Heiselberg, Phys. Rept. 351, 161 (2001).
- (43) G. Baym and H. Heiselberg, Phys. Lett. B 469, 7 (1999).
- (44) C. Alt et al. [NA49 Collaboration], Phys. Rev. C 75, 064904 (2007).
- (45) V. P. Konchakovski, S. Haussler, M. I. Gorenstein, E. L. Bratkovskaya, M. Bleicher and H. Stoecker, Phys. Rev. C 73, 034902 (2006).
- (46) M. Gyulassy and X. N. Wang, Comput. Phys. Commun. 83, 307 (1994).
- (47) W. Cassing and E. L. Bratkovskaya, Phys. Rept. 308, 65 (1999).
- (48) M. Bleicher et al., J. Phys. G 25, 1859 (1999).
- (49) K. Werner, Phys. Rept. 232, 87 (1993).
- (50) C. Pruneau, S. Gavin, S. Voloshin and , Phys. Rev. C 66, 044904 (2002).
- (51) B. I. Abelev et al. [STAR Collaboration], Phys. Rev. C 79, 024906 (2009).
- (52) H. Sako et al. [CERES/NA45 Collaboration], J. Phys. G 30, S1371 (2004).
- (53) B. Abelev et al. [ALICE Collaboration], Phys. Rev. Lett. 110, no. 15, 152301 (2013).
- (54) E. V. Shuryak and M. A. Stephanov, Phys. Rev. C 63, 064903 (2001).
- (55) M. A. Aziz and S. Gavin, Phys. Rev. C 70, 034905 (2004).
- (56) S. Gavin, Phys. Rev. Lett. 92, 162301 (2004).
- (57) F. W. Bopp and J. Ranft, Eur. Phys. J. C 22, 171 (2001).
- (58) R. Singh, L. Kumar, P. K. Netrakanti and B. Mohanty, Adv. High Energy Phys. 2013, 761474 (2013).
- (59) B. Friman et al. (eds.) Springer. 2011 The CBM Physics Book: Compressed Baryonic Matter in Laboratory Experiments vol 814 Series: Lecture Notes in Physics.
- (60) M. A. Stephanov, Phys. Rev. Lett. 102, 032301 (2009).
- (61) Y. Hatta and M. A. Stephanov, Phys. Rev. Lett. 91, 102003 (2003). Erratum: [Phys. Rev. Lett. 91, 129901 (2003)]
- (62) M. M. Aggarwal et al. [STAR Collaboration], Phys. Rev. Lett. 105, 022302 (2010).
- (63) L. Adamczyk et al. [STAR Collaboration], Phys. Rev. Lett. 112, 032302 (2014).
- (64) A. Adare et al. [PHENIX Collaboration], Phys. Rev. C 93, 011901 (2016).
- (65) L. Adamczyk et al. [STAR Collaboration], Phys. Rev. Lett. 113, 092301 (2014).
- (66) A. Sarkar [STAR Collaboration], J. Phys. Conf. Ser. 509, 012069 (2014).
- (67) J. Thäder [STAR Collaboration], arXiv:1601.00951 [nucl-ex].
- (68) S. Gupta, X. Luo, B. Mohanty, H. G. Ritter and N. Xu, Science 332, 1525 (2011).
- (69) F. Karsch and K. Redlich, Phys. Lett. B 695, 136 (2011).
- (70) P. Garg, D. K. Mishra, P. K. Netrakanti, B. Mohanty, A. K. Mohanty, B. K. Singh and N. Xu, Phys. Lett. B 726, 691 (2013).
- (71) X. Luo, J. Phys. G 39, 025008 (2012).
- (72) D. K. Mishra, P. Garg and P. K. Netrakanti, Phys. Rev. C 93, 024918 (2016).
- (73) V. Skokov, B. Friman and K. Redlich, Phys. Lett. B 708, 179 (2012).
- (74) M. Kitazawa and M. Asakawa, Phys. Rev. C 85, 021901 (2012).
- (75) F. Karsch, K. Morita and K. Redlich, Phys. Rev. C 93, no. 3, 034907 (2016).
- (76) B. Ling and M. A. Stephanov, Phys. Rev. C 93, no. 3, 034915 (2016).
- (77) J. Cleymans, H. Oeschler, K. Redlich and S. Wheaton, Phys. Rev. C 73, 034905 (2006).
- (78) D. K. Mishra, P. Garg, P. K. Netrakanti and A. K. Mohanty, Phys. Rev. C 94, 014905 (2016).
- (79) M. Nahrgang, M. Bluhm, P. Alba, R. Bellwied and C. Ratti, Eur. Phys. J. C 75, no. 12, 573 (2015).
- (80) A. Bzdak, V. Koch and N. Strodthoff, arXiv:1607.07375 [nucl-th].
- (81) D. K. Mishra, P. Garg, P. K. Netrakanti and A. K. Mohanty, J. Phys. G 42, no. 10, 105105 (2015).
- (82) M. Kitazawa and M. Asakawa, Phys. Rev. C 86, 024904 (2012). Erratum: [Phys. Rev. C 86, 069902 (2012)].
- (83) J. Fu, Phys. Lett. B 722, 144 (2013).
- (84) G. D. Westfall, Phys. Rev. C 92, no. 2, 024902 (2015).
- (85) T. J. Tarnowsky and G. D. Westfall, Phys. Lett. B 724, 51 (2013).