Partial-Wave Analysis of Nucleon-Nucleon Elastic Scattering Data
Abstract
Energy-dependent and single-energy fits to the existing nucleon-nucleon database have been updated to incorporate recent measurements. The fits cover a region from threshold to 3 GeV, in the laboratory kinetic energy, for proton-proton scattering, with an upper limit of 1.3 GeV for neutron-proton scattering. Experiments carried out at the COSY-WASA and COSY-ANKE facilities have had a significant impact on the partial-wave solutions. Results are discussed in terms of both partial-wave and direct reconstruction amplitudes.
pacs:
11.80.Et, 13.75.Cs, 25.40.Cm, 25.40.DnI Introduction
The nucleon-nucleon interaction is fundamental to the understanding of nuclear physics as a whole. The elastic scattering of protons and neutrons, at low to medium energies, can be analyzed in terms of a partial-wave expansion, yielding amplitudes that are valuable for comparison to models models and also as input to more complex processes, such as proton-deuteron scattering pd_scatt and deuteron electro-disintegration van_orden . Fit results have also been used in Monte Carlo simulations and incorporated into geometry and tracking of the Geant4 simulation MC software, a basic tool for low, medium, and high energy groups.
In nucleon-nucleon elastic scattering, as the initial and final state particles all have spin 1/2, many independent observables are available formal and have been measured over decades of systematic studies at ANL, COSY, IUCF, LAMPF, PSI, SATURN, TRIUMF, TUNL and other facilities. This has allowed a direct scattering amplitude reconstruction (DAR) Bystricky98 ; Ball98 at a number of energies and angles. We compare our results with these reconstructions below.
Our last published analysis SP07 (SP07) of the nucleon-nucleon database was completed in 2007 and largely motivated by data provided by the EDDA Collaboration EDDA , with some data also coming from the SATURNE II and PNPI groups. The most recent measurements have been fewer in number but greater in effect. This is true for both and scattering.
Recent COSY-WASA measurements WASA ; dibaryon_GW of the scattering observable, , have shown a sharp energy dependence, over a narrow energy range, when combined with the trend displayed by existing lower-energy data old_Ay . This behavior was not predicted by the SP07 analysis, nor was it seen in previous fits SM97 ; SP00 ; SM94 ; FA91 . In a revised fit WASA , this narrow structure was reproduced with the generation of a pole, at MeV in the coupled – partial waves, closely related to the resonance mass and width ( MeV , MeV), deduced from WASA analyses of related two-pion production measurements 2pi .
We subsequently compared the predictions of fits to scattering data, with and without a pole, to search for other potentially sensitive observables dibaryon_GW . Experimental tests are limited by the existing database, which supports a partial wave analysis (PWA) only up to a laboratory kinetic energy of 1.3 GeV. No single measurement is capable of extending the range of PWAs. A programmatic study would be required and this is unlikely to occur in the near future.
For elastic scattering, measurements of near-forward differential cross sections mc16 and the polarization quantity ba14 , , from the COSY-ANKE Collaboration, were poorly predicted by the SP07 fit. The simple inclusion of these data in the full database did not generally result in a significant improvement. Below we discuss the fitting strategy and its connection to recent (SP07) SP07 and older (SM97) SM97 PWA results.
II Fits to Data
The SP07 analysis is accessible via the Scattering Analysis Interactive Database (SAID) website SAID . The fit form is based on the product of exchange and production S-matrices. The exchange piece is parametrized via a K-matrix and contains a one-pion exchange term plus a sum over expansion bases containing a left-hand cut. The production piece is parametrized in terms of a Chew-Mandelstam K-matrix and allows for the production of an inelastic channel. For the isovector waves, the inelasticity is assumed to be dominated by the channel. For isoscalar waves, there is an effective second channel. The formalism for both spin-coupled and uncoupled waves is explained in detail in Refs. SM97 ; formalism .
The fit to data is carried out, using the form
| (1) |
where is an experimental point in an angular distribution, with associated statistical error , and is the fit value. Here the overall systematic error, , is used to weight an additional penalty term due to the renormalization of angular distributions in the fit by the factor .
The partial-wave solution (SP07) was determined through a fit to approximately 25 thousand data (to 3 GeV) and 13 thousand data (to 1.3 GeV). Compared to the recent WASA and ba14 measurements, SP07 predicted a different forward-angle behavior, for data, and a different shape at the energy corresponding to the proposed WASA dibaryon, for data. SP07 was able to reproduce the angular behavior of the new and very precise forward cross sections mc16 , but the resulting renormalization factors (), for several energies, were outside the range expected from the quoted overall systematic errors.
Different strategies were used to accommodate the new and scattering data. For the observable, an improved fit was achieved by more heavily weighting the new data, by a factor of 4, in the fit. Conversely, for the cross sections, the second term in Eq. 1 was increased in weight until the fitted renormalization factors deviated from unity by an amount consistent with the quoted systematic errors. Weighting was also used to study the influence of the COSY-WASA data, as has been described in Refs. WASA ; dibaryon_GW .
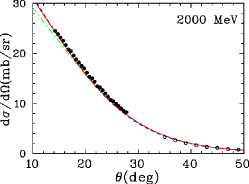
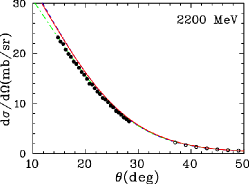
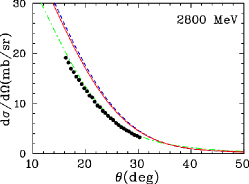
In Fig. 1, we plot the fits SP07, an unweighted fit (SM16), and a weighted fit (WF16) to the new forward cross section data mc16 . The fit quality for larger-angle COSY measurements al04 , which were included in the SP07 fit, is displayed as well. In the comparison, the fitted normalization factor has not been applied in order to show how large a factor is required in an unweighted fit, or the SP07 prediction, at the highest energies.

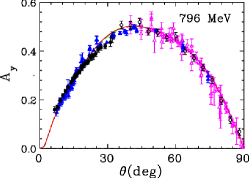
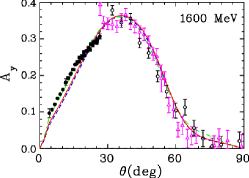
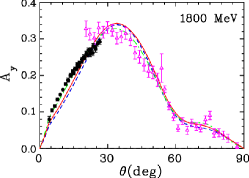
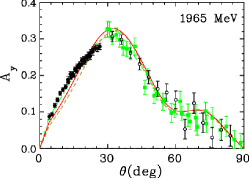
In Fig. 2, the above three partial-wave solutions are compared to the new data ba14 and other data sets covering the full angular range. In contrast to Fig. 1, the data sets have all been modified according to the renormalization factors found in the weighted fit WF16. Here we see that the new measurements cover an angular range not previously measured, are much more precise than earlier measurements and, in some cases, differ from those earlier measurements at angles where there is overlap.
In the revised solutions SM16 and WF16, the fit quality for total cross sections was also addressed. In Fig. 3, we plot the total cross section (), the total reaction cross section (), the difference between total cross sections in pure transverse-spin states
| (2) |
and the difference between total cross sections in pure longitudinal-spin states
| (3) |


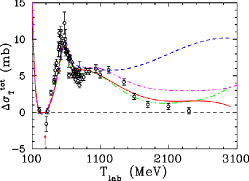
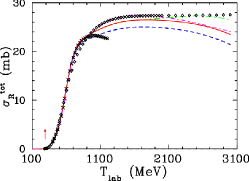
Several comments are in order. The total reaction cross section ve82 ; by78 is not a pure measurement and has not been included in these fits. It is, however, qualitatively well predicted. The quantity is not well reproduced by the SP07 solution and was given added weight in the SM16 and WF16 fits. In contrast, is reasonably well represented by all the displayed fits. The total cross section dataset includes some extremely precise measurements bu66 (with statistical errors of the order of 0.1%) which can dominate the in a fit. In the SP07 fit, subsets of energies in the measurement of Ref. bu66 were allowed to have a common renormalization, resulting in a curve systematically below these data. In the present fit, this renormalization freedom was removed. As a result, the fits SM16 and WF16 are nearly identical for this quantity. For comparison purposes, the older fit SM97 SM97 has been plotted as well. Below we will see that the quality of fit to total cross section quantities is reflected in a variability for the partial wave amplitude.
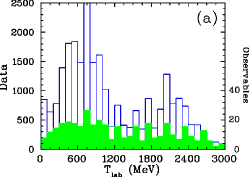
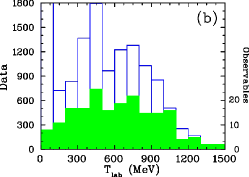
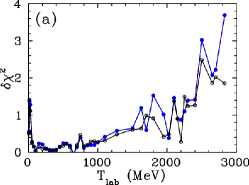
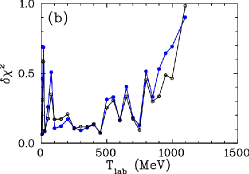
In addition to global fits to all data from threshold to 3 GeV and 1.3 GeV, in , for and scattering data, respectively, a set of single-energy solutions (SES) was also generated. Here, data within narrow energy bins are searched, starting from the global fit, without the constraint of energy-to-energy smoothness. This allows a search for systematic deviations from the global fit. As a point of comparison, we display the number of data in a histogram, for both and scattering, in Fig. 4, together with the number of measured observables. Clearly, the data constraints for a global fit are significantly reduced beyond 1.1 GeV, for scattering, and beyond about 2.5 GeV, for scattering. In Fig. 5, the difference between global and single-energy fits is also compared. This gives a qualitative picture of the fit stability which, as expected, improves with the number of data constraints.
-
III Amplitudes
We are using the notation of Ref. Bystricky98 ; Ball98 and write the scattering matrix, , as
where and are the scattered and incident momenta in the c.m. system, and
Writing the scattering matrix in this form, any observable can be expressed in terms of the five complex amplitudes through . If a sufficient number of independent observables are measured precisely at a given energy and angle, these amplitudes can be determined up to an overall undetermined phase. The advantage of this method is its model independence; nothing beyond the data is required to determine a solution. In addition, once the amplitudes are found, any further experimental quantity can be predicted at the energy-angle points of the DAR. In practice, however, experimental uncertainties allow for multiple solutions comparable in their representation of the data.
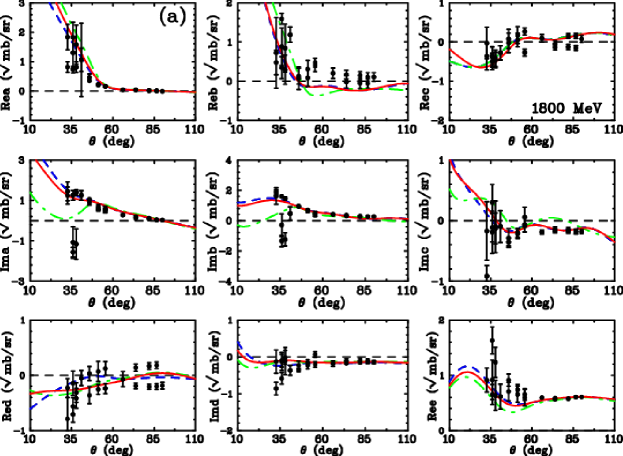
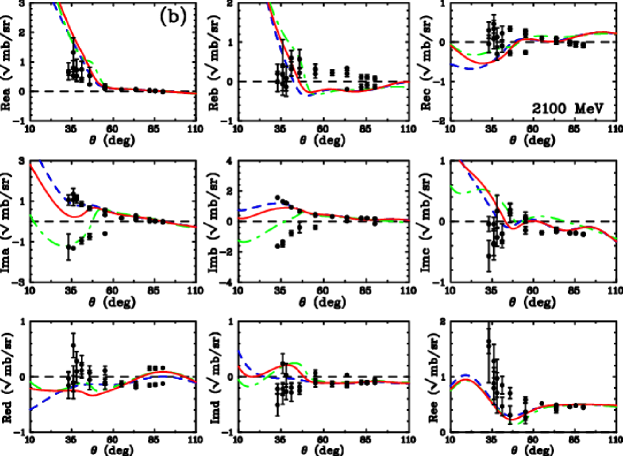
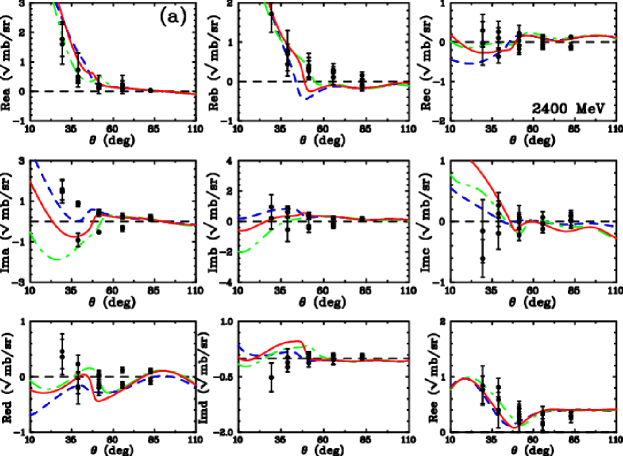
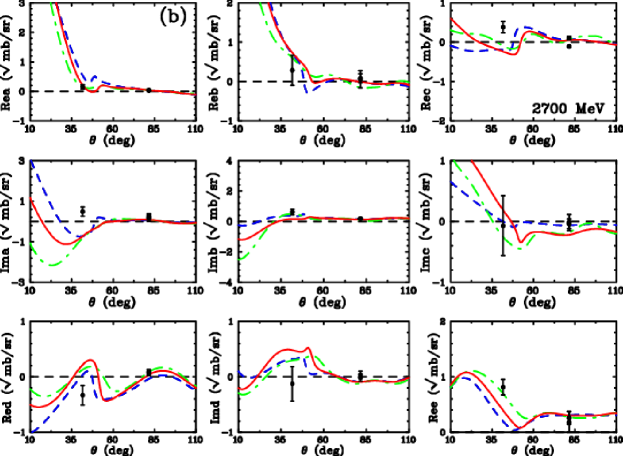
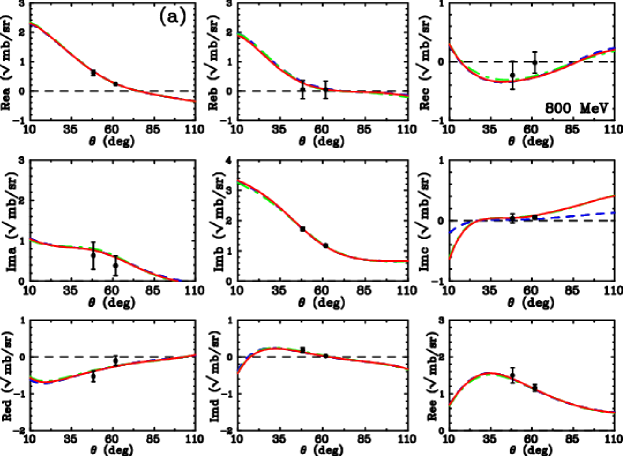
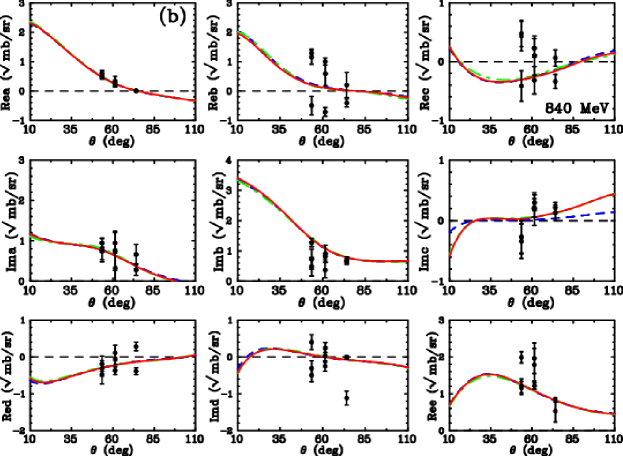
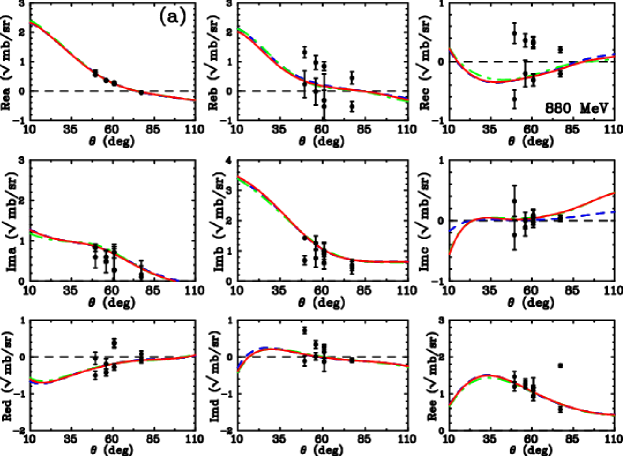
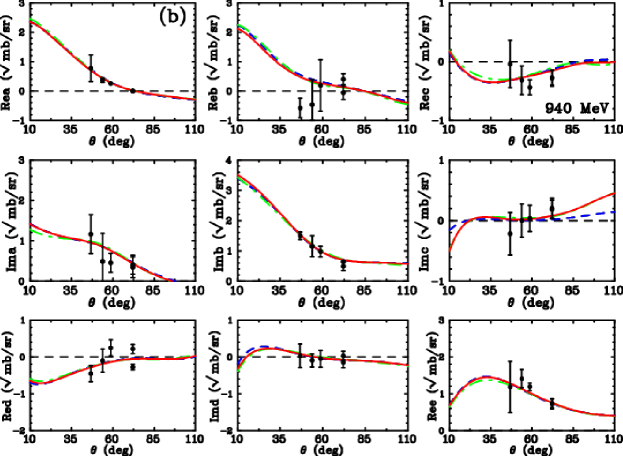
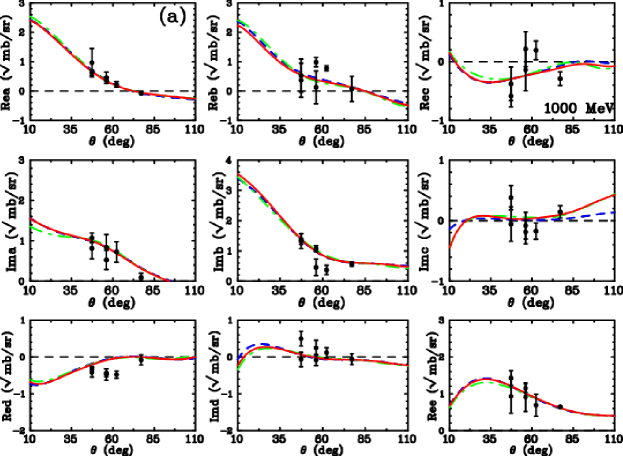
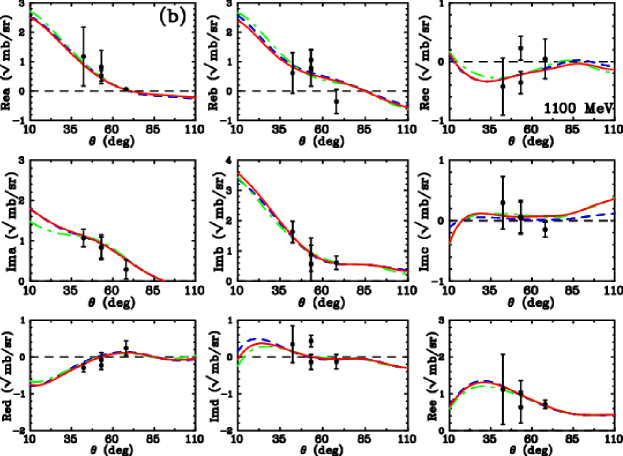
In Figs. 6 and 7, the DAR amplitudes through of Ref. Bystricky98 are plotted for energies between 1.8 and 2.7 GeV. These amplitudes have an overall phase ambiguity which is resolved, in the plots, by taking the amplitude to be real. At the highest energy, with fewer data and observable types available, results are only plotted at a pair of angles. At the other energies, however, where multiple solutions form separate branches, the fits SM16 and WF16 tend to branch as well. The DAR amplitudes of Ref. Ball98 for scattering, from 0.8 to 1.1 GeV, show good overall agreement with the plotted fits. These are displayed in Figs. 8–10.
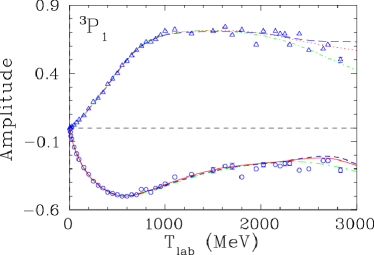
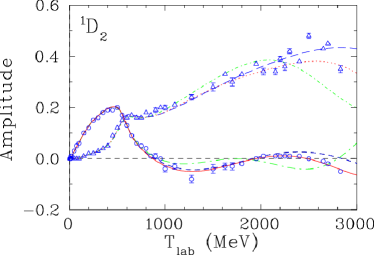
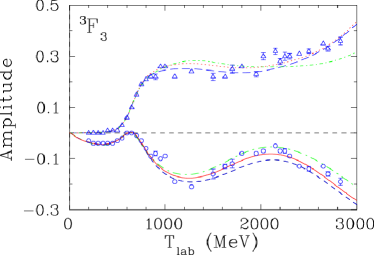
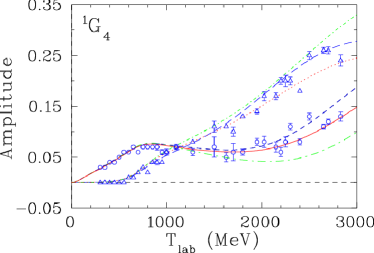
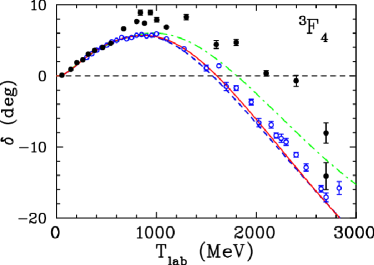
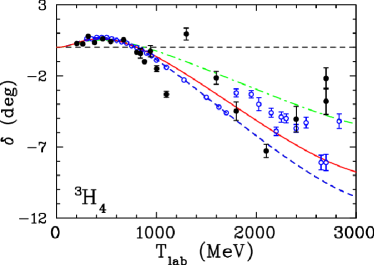
In Figs. 11 and 12, the dominant isovector PWA results are plotted. Here we compare the previous SP07 result to the present SM16 and WF16 fits. Unlike the DAR results, a PWA is not strictly model-independent and variations between fits are expected with the onset of inelasticity and an increasing angular momentum cutoff. However, for values of below 1 GeV, fits have remained very stable. The largest deviations are generally found in smaller partial waves and at the highest fitted energies. Results for these and previous fits may be found on the SAID website, together with the associated database SAID .
In Fig. 11, the dimensionless T-matrices are plotted for the global fits and the SES results. The fits SM16 and SP07 are qualitatively similar and fall within the scatter of the SES values. The weighted fit, WF16, constrained to better reproduce the recent measurements, shows significant deviations from SM16 in the and partial waves. This effect was noted in Ref. mc16 . The behavior of the wave is remarkably similar to the much older fit, SM97, completed in 1997. As displayed in Fig. 3, SM97 followed the polarized and unpolarized total cross sections more closely than SP07. Thus, we find the wave to be particularly sensitive to constraints imposed to fit the total cross sections and the forward differential cross sections.
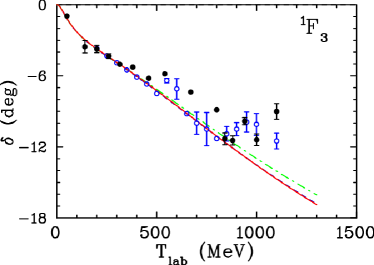
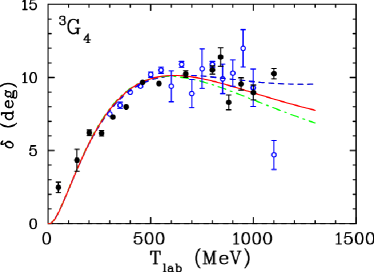
In Fig. 12, selected phase shifts are plotted for both the global and SES fits and are compared to results from the Saclay SES Bystricky98 . All determinations agree quite well below 500 MeV and begin to scatter significantly above 1 GeV. A significant deviation between the SM16 and WF16 fits is visible in the and this was noted, in Ref. ba14 , to be the result of constraints imposed by the recent forward measurements ba14 .
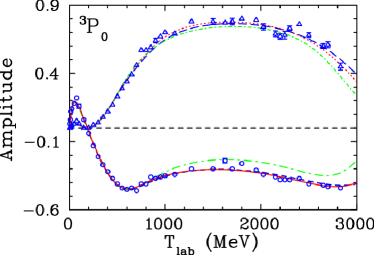
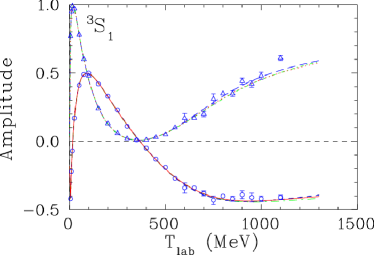
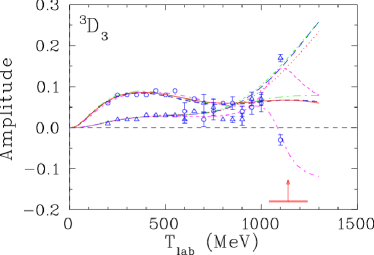
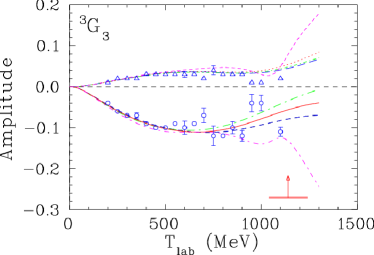
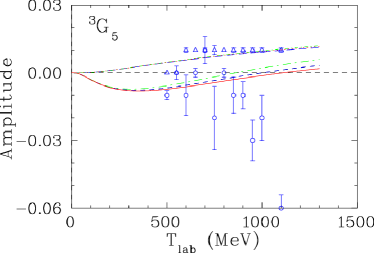
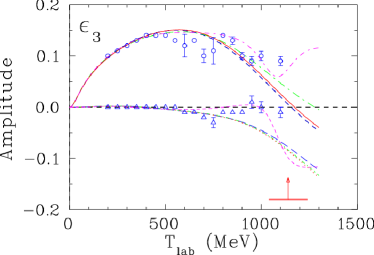
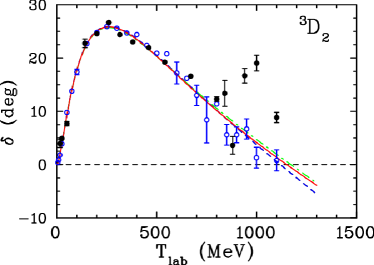
The dominant isoscalar partial-wave amplitudes are plotted in Figs. 13 and 14. As for the isovector waves, we first plot the global fits and SES in terms of the dimensionless T-matrices. Here, for the coupled – partial waves, we also plot the fit containing an associated pole for comparison. This feature has been extensively discussed in Refs. WASA ; dibaryon_GW . Phase shifts are plotted for selected waves in Fig. 14. As was the case for the isovector amplitudes, all determinations, including the Saclay PWA Ball98 agree well up to 500 MeV.


IV Summary and Conclusions
We have fitted recent precise measurements of the differential cross sections and the observable , both at forward angles, together with data near the limit of our isoscalar PWA. The energy dependence implied by the new data, together with older measurements, suggest a rapid variation that has been accommodated through the generation of a pole, providing supporting evidence for the WASA dibaryon candidate. Little additional data has been added to the SAID database since the 2007 PWA and the sharp structure in is localized to a narrow energy range. As a result, the amplitudes - apart from the coupled – partial waves - have changed little since the last published analysis. At the level of a DAR, we are consistent with the Saclay analysis. However, the upper limit for our PWA (1.3 GeV) is much below the PWA upper limit (3.0 GeV).
The DAR comparison has been made at a higher set of energies and here multiple solutions appear to form branches that are chosen differently by the present SM16 and WF16 fits. The SM16 and WF16 fits also differ at the PWA level, particularly in the , , and amplitudes. The largest difference, in the wave, is very sensitive to the fit quality associated with the polarized and unpolarized total cross sections, together with the fit to near-forward differential cross sections. The present SM16 and WF16 solutions differ significantly from SP07 in their fit to these observables. We have also observed that the fit WF16 has a partial wave remarkably similar to that found in the older SM97 solution, which featured a different treatment of the total cross sections.
The weighted fit, WF16, was constructed to improve the description of new cross section and data. However, by increasing the weight of new data, older data are implicitly given less weight, resulting in a degraded fit. This produces a higher overall /datum for the full database. For values of from threshold to 350 MeV, the potential model region, all fits are virtually identical, giving a /datum of about 1.25 for over the full database. For scattering up to 1 GeV, the /datum increases to about 1.5, compared to a value slightly below 2.0 for the SM16 fit covering the full scattering range from threshold to 3 GeV.
We note that the Nijmegen partial-wave and potential model analyses Nijmegen of scattering data achieved a /datum closer to unity over a more restricted dataset and energy range. The Nijmegen low-energy partial waves differ very little from those presented here. Comparisons of the various analyses, including the Nijmegen fit, may be obtained using the SAID website.
Acknowledgements.
This work was supported in part by the U.S. Department of Energy, Office of Science, Office of Nuclear Physics, under award numbers DE-SC0014133 and DE-SC0016582.References
- (1) A. M. Shirokov et al., Phys. Rev. C 90, 024324 (2014); J. J. de Swart, R. A. M. M. Klomp, M. C. M. Rentmeester, and Th. A. Rijken, Few-Body Systems Suppl. 99, 1 (2008).
- (2) S. Dymov et al., Phys. Lett. B 744, 391 (2015); A. A. Temerbayev and Yu. N. Uzikov, Phys. Atom. Nucl. 78, 35 (2015).
- (3) W. P. Ford, S. Jeschonnek, and J. W. Van Orden, Phys. Rev. C 90, 064006 (2014); O. Moreno, T. W. Donnelly, J. W. Van Orden, W. P. Ford, Phys. Rev. D 92, 053006 (2015).
- (4) D.H. Wright and M.H. Kelseya (for the Geant4 Hadronic Working Group), Nucl. Instrum. Meth. A 804, 175 (2016).
- (5) J. Bystricky, F. Lehar, and P. Winternitz, J. Phys. (France), 39, 1 (1978).
- (6) J. Bystricky, C. Lechanoine-LeLuc, and F. Lehar, Eur. Phys. J. C 4, 607 (1998); F. Lehar, private communication, 1998.
- (7) J. Ball et al., Il Nuovo Cimento 111A, 13 (1998); F. Lehar, private communication, 1998.
- (8) R. A. Arndt, W. J. Briscoe, I. I. Strakovsky, and R. L. Workman, Phys. Rev. C 76, 025209 (2007).
- (9) D. Albers et al. (EDDA Collaboration), Eur. Phys. J. A 22, 125 (2004); M. Altmeier et al. (EDDA Collaboration), Eur. Phys. J. A 23, 351 (2005); F. Bauer et al. (EDDA Collaboration), Phys. Rev. C textbf71, 054002 (2005).
- (10) P. Adlarson et al., Phys. Rev. Lett. 112, 202301 (2014); Phys. Rev. C 90, 035204 (2014).
- (11) R. L. Workman, W. J. Briscoe, and I. I. Strakovsky, Phys. Rev. C 93, 045201 (2016); R.L. Workman, EPJ Web Conf. 81, 02023 (2014).
- (12) J. Ball et al., Nucl. Phys. A 559, 477 (1993); 559, 489 (1993).
- (13) R. A. Arndt, C. H. Oh, I. I. Strakovsky, R. L. Workman, and F. Dohrman, Phys. Rev. C 56, 3005 (1997).
- (14) R. A. Arndt, I. I. Strakovsky, and R. L. Workman, Phys. Rev. C 62, 034005 (2000).
- (15) R. A. Arndt, I. I. Strakovsky, and R. L. Workman, ibid. 50, 2731 (1994).
- (16) R. A. Arndt, L. D. Roper, R. L. Workman, and M. W. McNaughton, Phys. Rev. D 45, 3995 (1992).
- (17) M. Bashkanov et al., Phys. Rev. Lett. 102, 052301 (2009); P. Adlarson et al. ibid. 106, 242302 (2014); Phys. Lett. B 721, 229 (2013); Phys. Rev. C 88, 055208 (2013); Phys. Lett. B 743, 325 (2015)
- (18) D. Mchedlishvili et al., Phys. Lett. B 755, 92 (2016).
- (19) Z. Bagdasarian et al., Phys. Lett. B 739, 152 (2014).
- (20) The SAID [http://gwdac.phys.gwu.edu] website provides access to both fits, models and the associated databases.
- (21) R.A. Arndt, J.S. Hyslop, and L.D. Roper, Phys. Rev. D 35, 128 (1987).
- (22) D. Albers et al., Eur. Phys. J. A 22, 125 (2004).
- (23) D. Bugg et al., Phys. Rev. 146 980 (1966).
- (24) B. J. VerWest and R. A. Arndt, Phys. Rev. C 25, 1979 (1982).
- (25) J. Bystricky, P. La France, F. Lehar, F. Perrot, T. Siemiarczuk, and P. Winternitz, J. Phys. (Paris) 48, 1901 (1987).
- (26) V.G.J. Stoks, R.A.M. Klomp, M.C.M. Rentmeester, and J.J. de Swart, Phys. Rev. C 48, 792 (1993); V.G.J. Stoks, R.A.M. Klomp, C.P.F. Terheggen, and J.J. de Swart, Phys. Rev. C 49, 2950 (1994); V.G.J. Stoks, private communication, 1995.