Multiple Rabi Splittings under Ultra-Strong Vibrational Coupling
Abstract
From the high vibrational dipolar strength offered by molecular liquids, we demonstrate that a molecular vibration can be ultra-strongly coupled to multiple IR cavity modes, with Rabi splittings reaching of the vibration frequencies. As a proof of the ultra-strong coupling regime, our experimental data unambiguously reveal the contributions to the polaritonic dynamics coming from the anti-resonant terms in the interaction energy and from the dipolar self-energy of the molecular vibrations themselves. In particular, we measure the opening of a genuine vibrational polaritonic bandgap of ca. meV. We also demonstrate that the multimode splitting effect defines a whole vibrational ladder of heavy polaritonic states perfectly resolved. These findings reveal the broad possibilities in the vibrational ultra-strong coupling regime which impact both the optical and the molecular properties of such coupled systems, in particular in the context of mode-selective chemistry.
Light-matter interactions in the strong coupling regime offer exciting possibilities for exploring quantum coherent effects both from a physical and chemical perspectives. This regime can be reached when a confined electromagnetic field interacts coherently with an electronic transition of an embedded material, leading to the formation of polaritonic states Agranovich et al. (2011). Many realizations of this effect have been demonstrated, ranging from single atoms Raimond et al. (2001), quantum wells Skolnick et al. (1998); Peter et al. (2005), superconducting q-bits Wallraff et al. (2004) to molecular systems Pockrand et al. (1982); Lidzey et al. (1998); Holmes and Forrest (2004); Bellessa et al. (2004); Dintinger et al. (2005); Plumhof et al. (2014); Orgiu et al. (2015); Törmä and Barnes (2015). Recently, we demonstrated that molecular vibrations can be strongly coupled to an optical mode of a Fabry-Pérot (FP) cavity in the infrared (IR) region Shalabney et al. (2015); George et al. (2015). Such coupling is attracting more and more attention Muallem et al. (2015); Long and Simpkins (2014); del Pino et al. (2015) since molecular vibrations play a key role in chemistry. Therefore, vibrational strong coupling could potentially be used to control chemical reactions in the same way as it has been demonstrated for electronic strong coupling Hutchison et al. (2012). Lately, a whole field of research has been opened with the prediction and demonstration of an ultra-strong coupling (USC) regime Ciuti et al. (2005). The USC regime indeed leads to the possibility of probing fascinating properties of the coupled states such as non-classical ground state behavior, squeezed vacuum and polaritonic bandgaps Todorov et al. (2010); Scalari et al. (2012); Askenazi et al. (2014); Gambino et al. (2014); Schwartz et al. (2011).
In this Letter, we demonstrate that USC can also be reached, at room temperature, with ground state molecular vibrations coupled to an optical mode. Inherent features of the USC regime, anti-resonant and self-energy contributions to the coupling, are measured on vibrational polaritonic states. These results reveal totally different dynamics than the one we previously reported for vibrational strong coupling Shalabney et al. (2015). To reach this vibrational USC regime, we exploit unique features of molecular liquids with high vibrational dipolar strength. Such liquids ressemble assemblies of individual ground-state mechanical oscillators where one is able to reach dipolar strength densities far beyond the quenching densities in the solid phase. These combined features naturally set the conditions for collective coupling strengths up to the USC regime. Remarkably, with Rabi splitting practically matching the free spectral range (FSR) of the IR cavity, the coupling process involves multiple orders of the FP cavity modes and leads to a genuine ladder of polaritonic states. We show multimode splitting with up to 10 polaritonic peaks. The new vibrational spectrum associated with this polaritonic ladder differs radically from the vibrational spectrum of the bare molecules. While USC has been recognized as a new playground for electronic polaritonic physics, the USC features that we now observe on vibrations are expected to also have a strong impact on the chemistry of vibrational polaritonic states that remains so far unexplored.
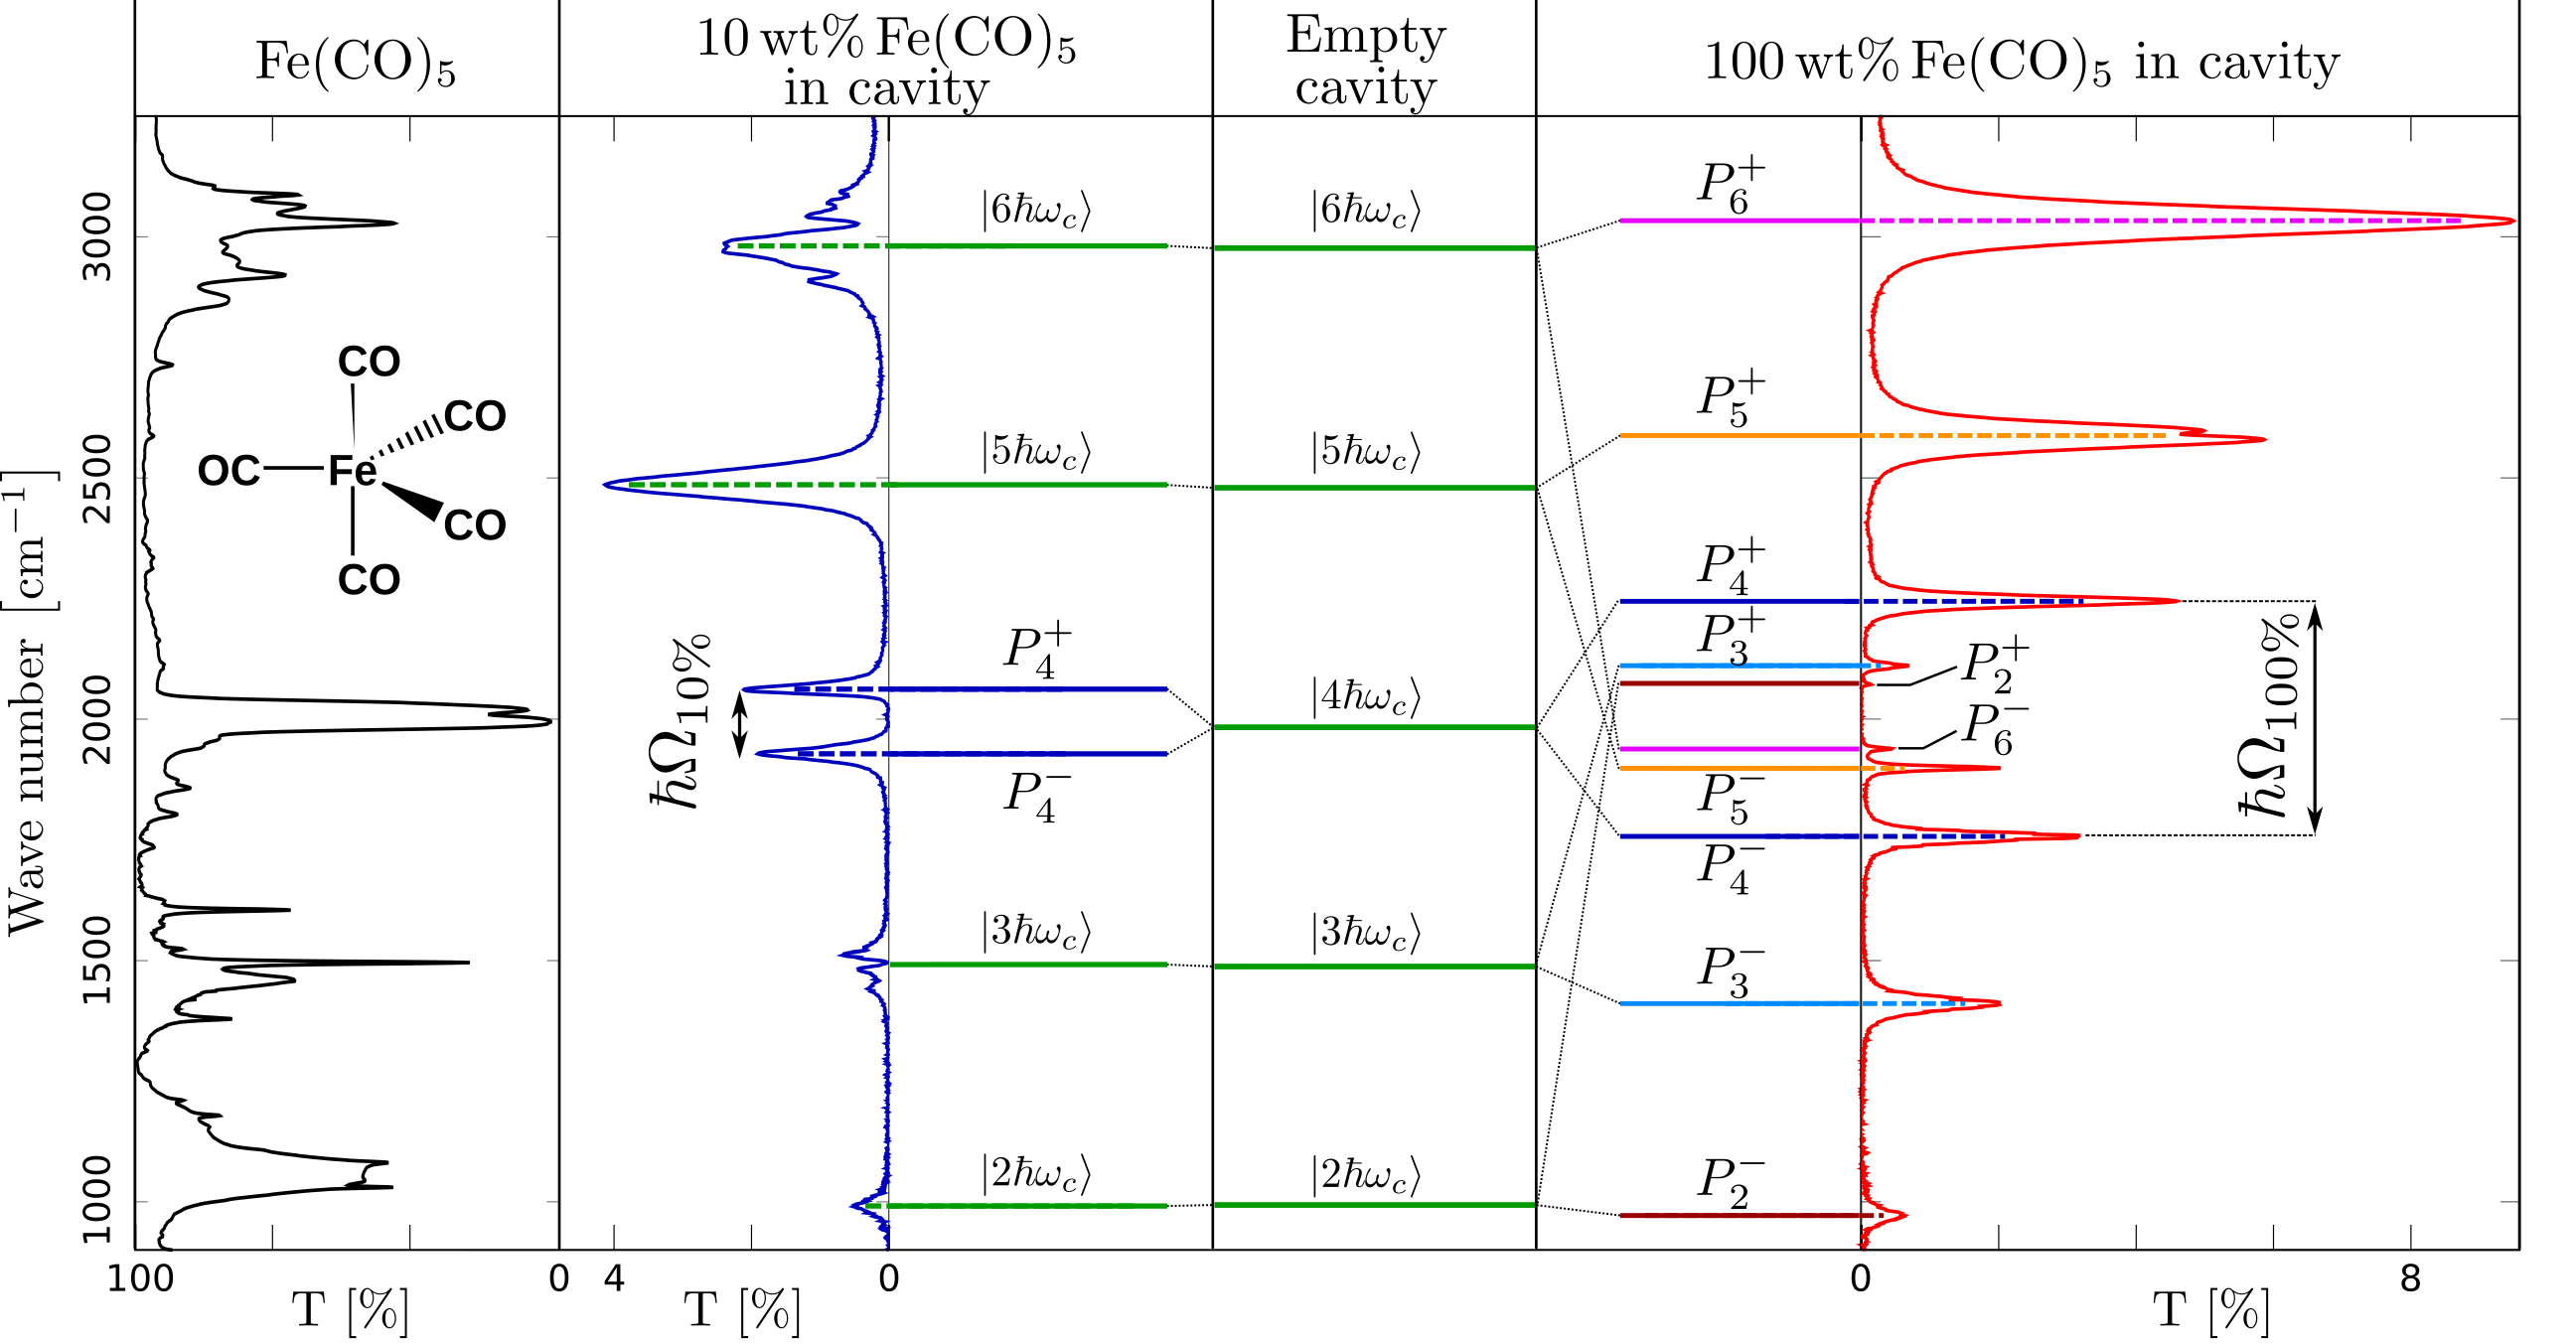
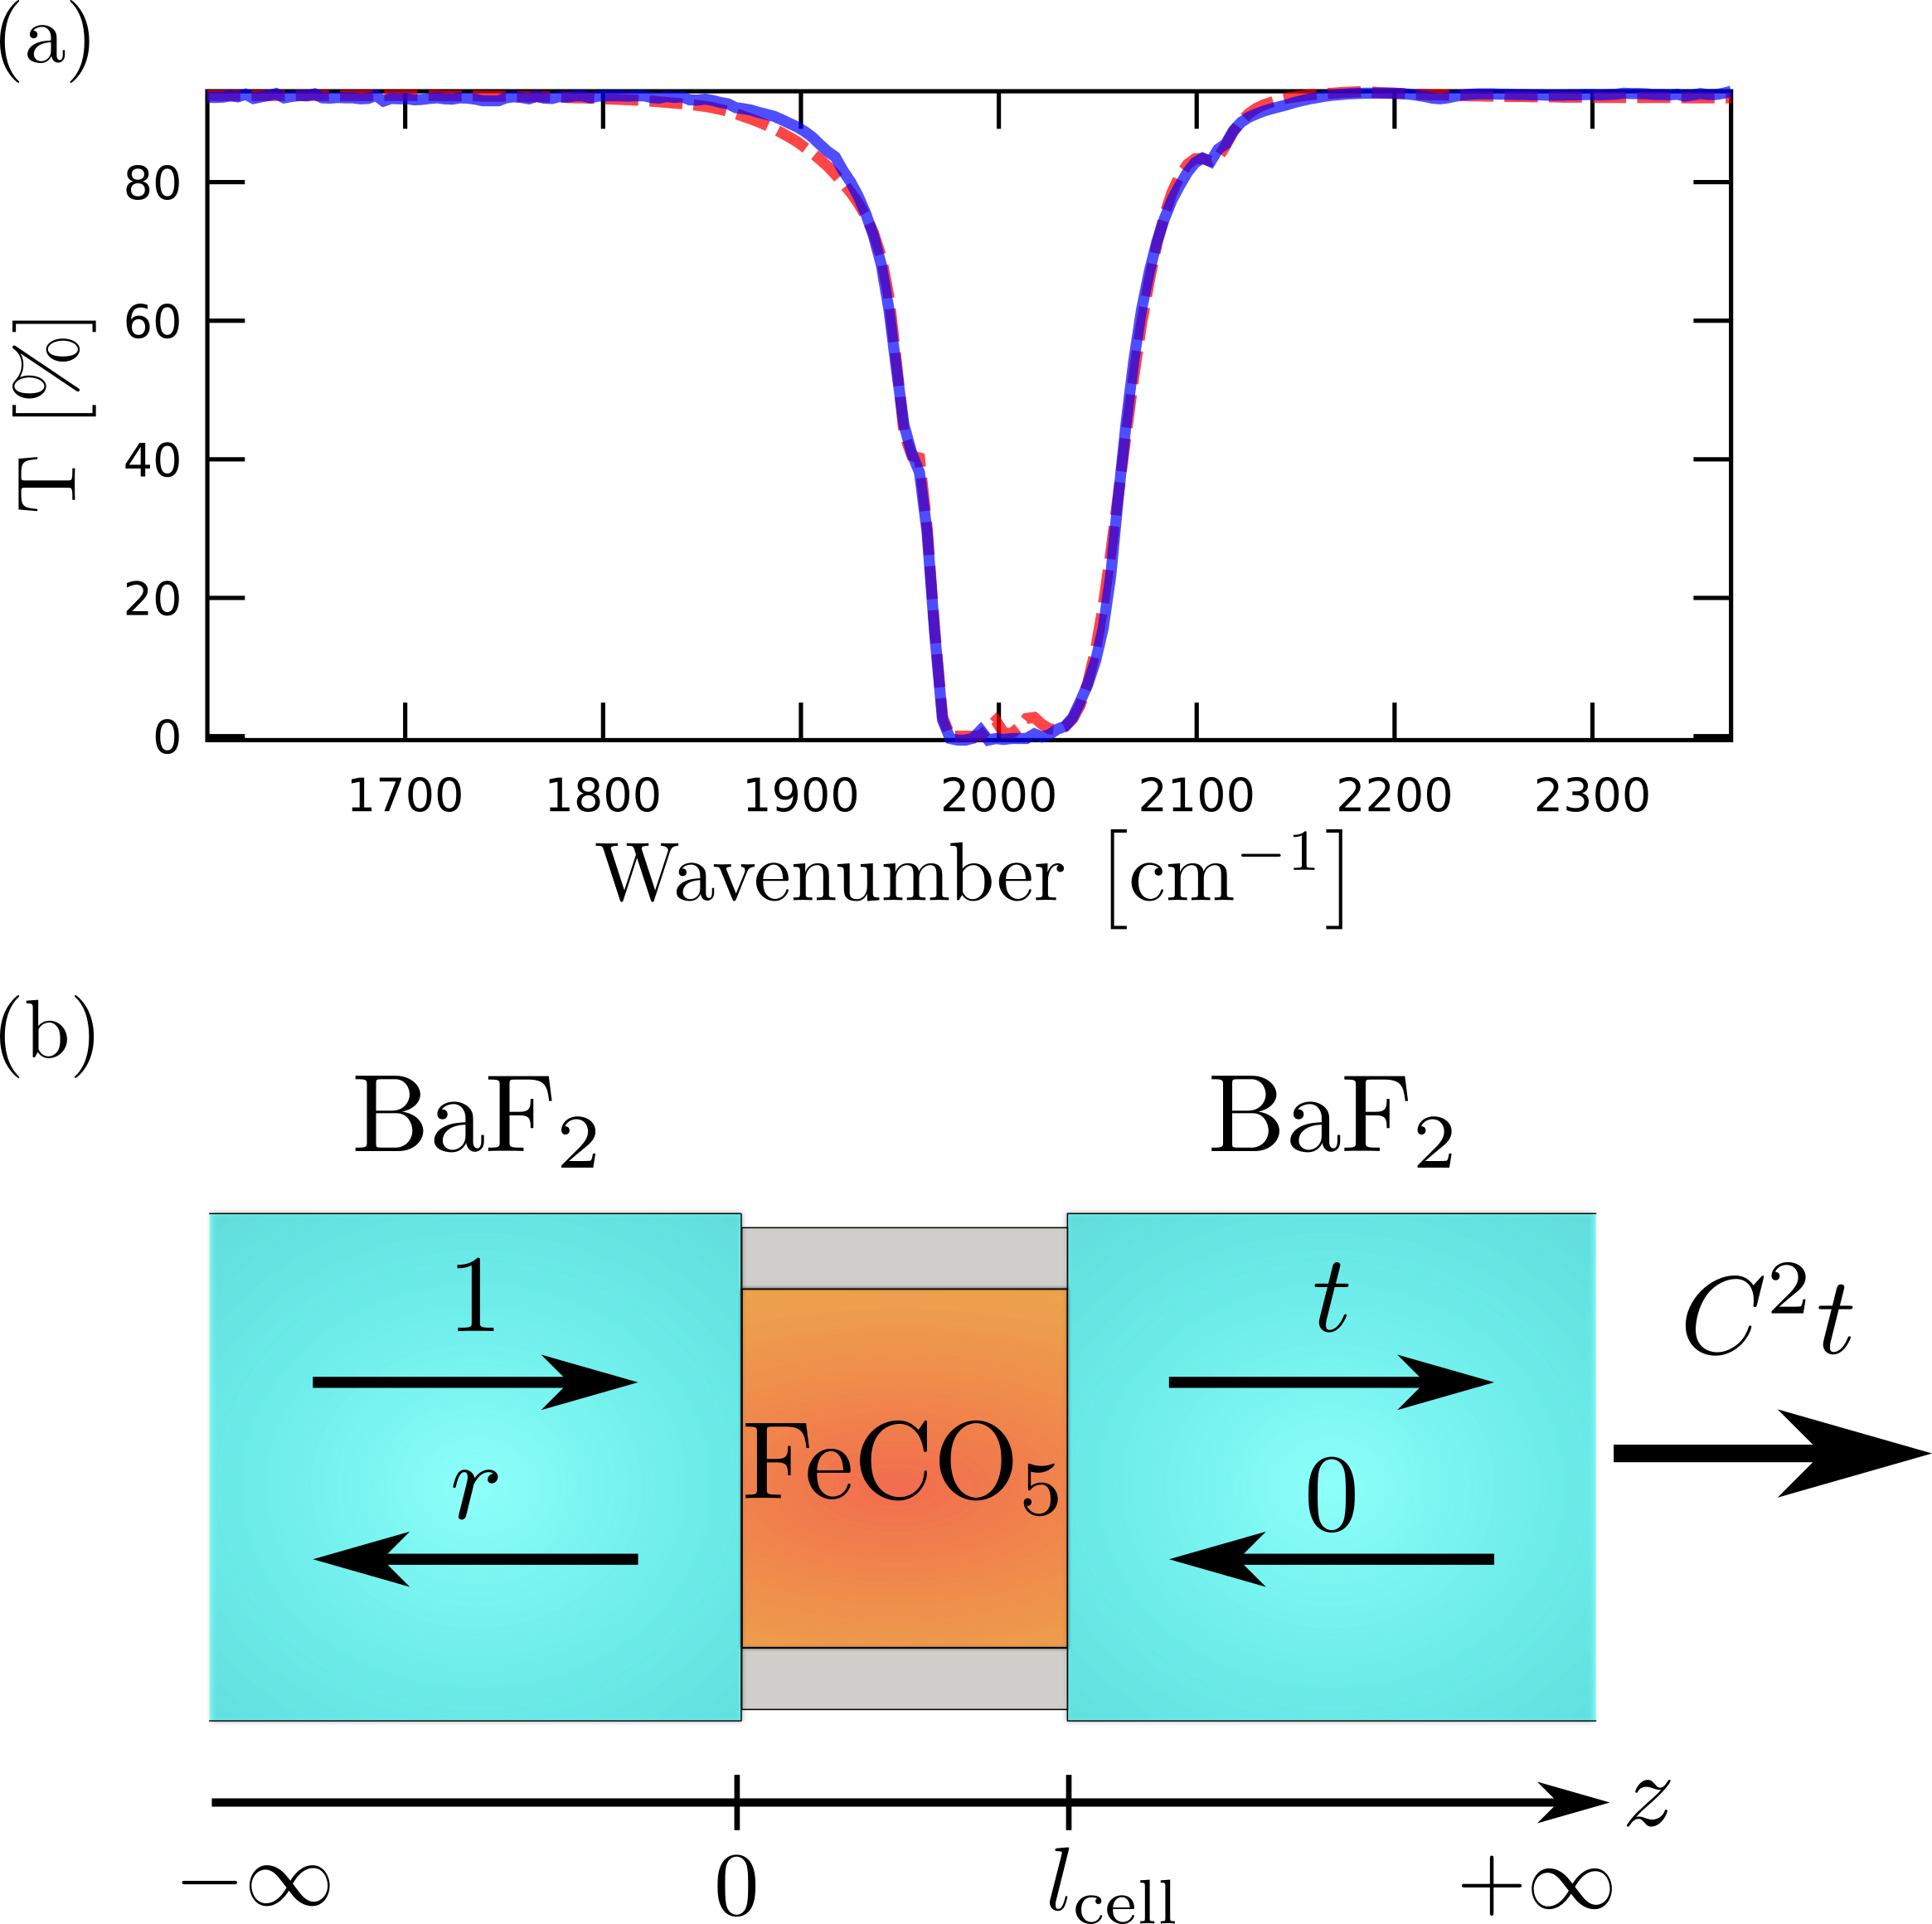
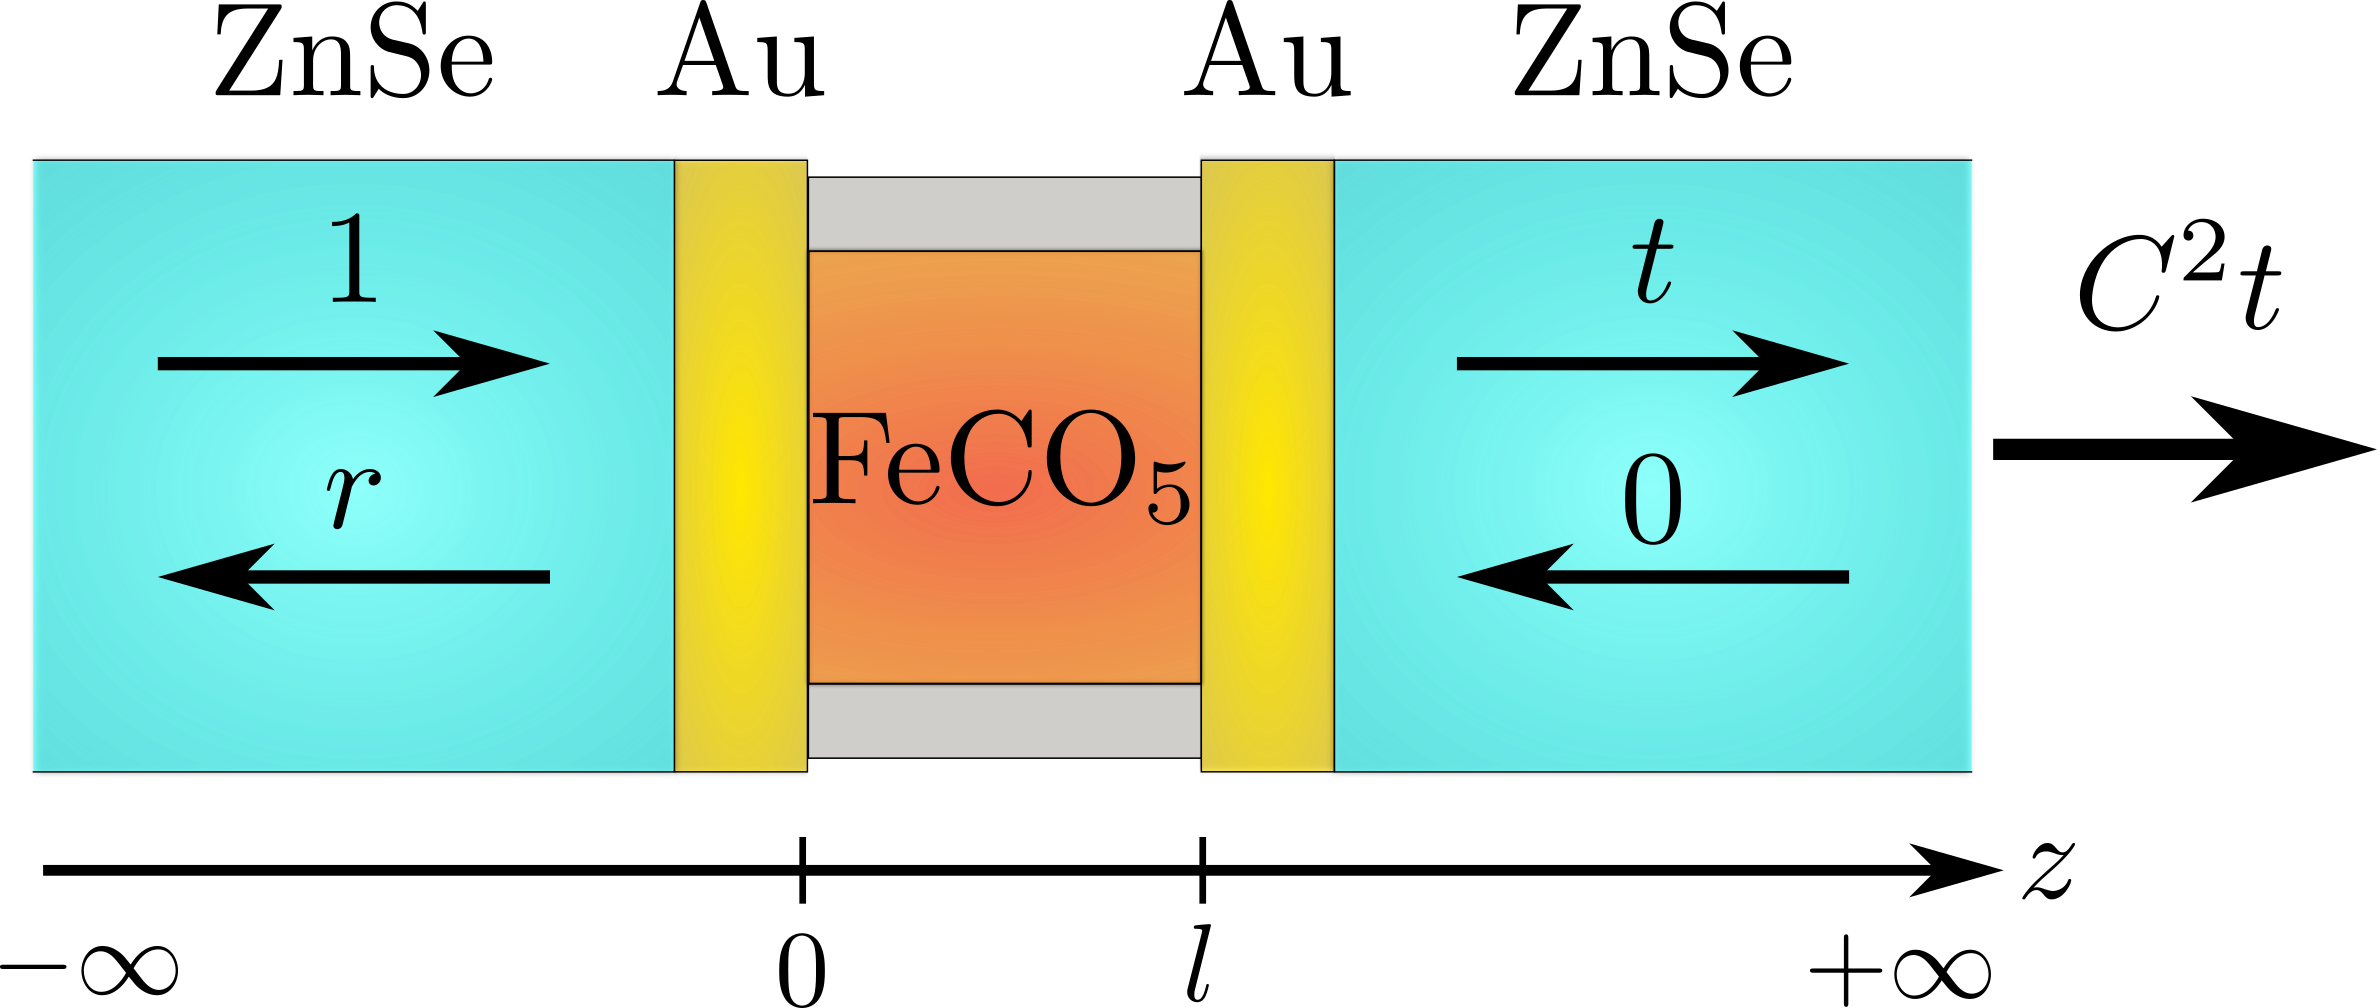
Our system consists of a micro-fluidic FP flow cell which can be filled with any given molecular liquid (see Appendix A). It is made of two ZnSe windows coated with thick Au films to form the FP mirrors and closing them with a Mylar spacer of the appropriate thickness produces a microcavity with IR modes of quality factors George et al. (2015). By varying the spacer thickness, one of the optical modes is brought into resonance with the targeted molecular vibration. Different concentrations of molecules are injected in the cell and the system is spectroscopically characterized using a commercial Fourier Transform IR spectrophotometer (FTIR, Nicolet-6700). The two molecules chosen for this study are the iron pentacarbonyl Fe(CO)5 (see Fig. 1) and carbon disulphide CS2. Fe(CO)5 liquid has a very strong oscillator strength with 3 equitorial and 2 axial CO-stretching degenerate modes having a fundamental frequency corresponding to a wave number of Cataliotti et al. (1971). The IR absorption band of a dilute Fe(CO)5 solution (10 wt % in toluene) is shown in Fig. 1. We inject the same solution into a FP cavity tuned to have its -order longitudinal mode resonant with the CO-stretching band. This resonant coupling splits the fundamental vibrational mode into an upper and lower mode separated by (Fig. 1, second column). Importantly, this mode splitting is larger than both the width of the cavity mode and of the vibrational peak, i.e. it corresponds to a genuine Rabi splitting.
Using pure Fe(CO)5 liquid under the same resonant conditions expectedly leads to an increase in the mode splitting up to , as shown in Fig. 1 (fourth column). In these conditions, the vibrational spectrum of the coupled Fe(CO)5 liquid also displays a series of sharp resonances that stem from the coupling of the CO-stretching band with successive longitudinal modes of the FP cavity. We report in Appendix B similar spectral evolutions for CS2. This multimode splitting theoretically predicted by Meiser and Meystre Meiser and Meystre (2006) is similar to that reported in the case of electronic strong coupling Dupont et al. (2007); Yu et al. (2009).
.
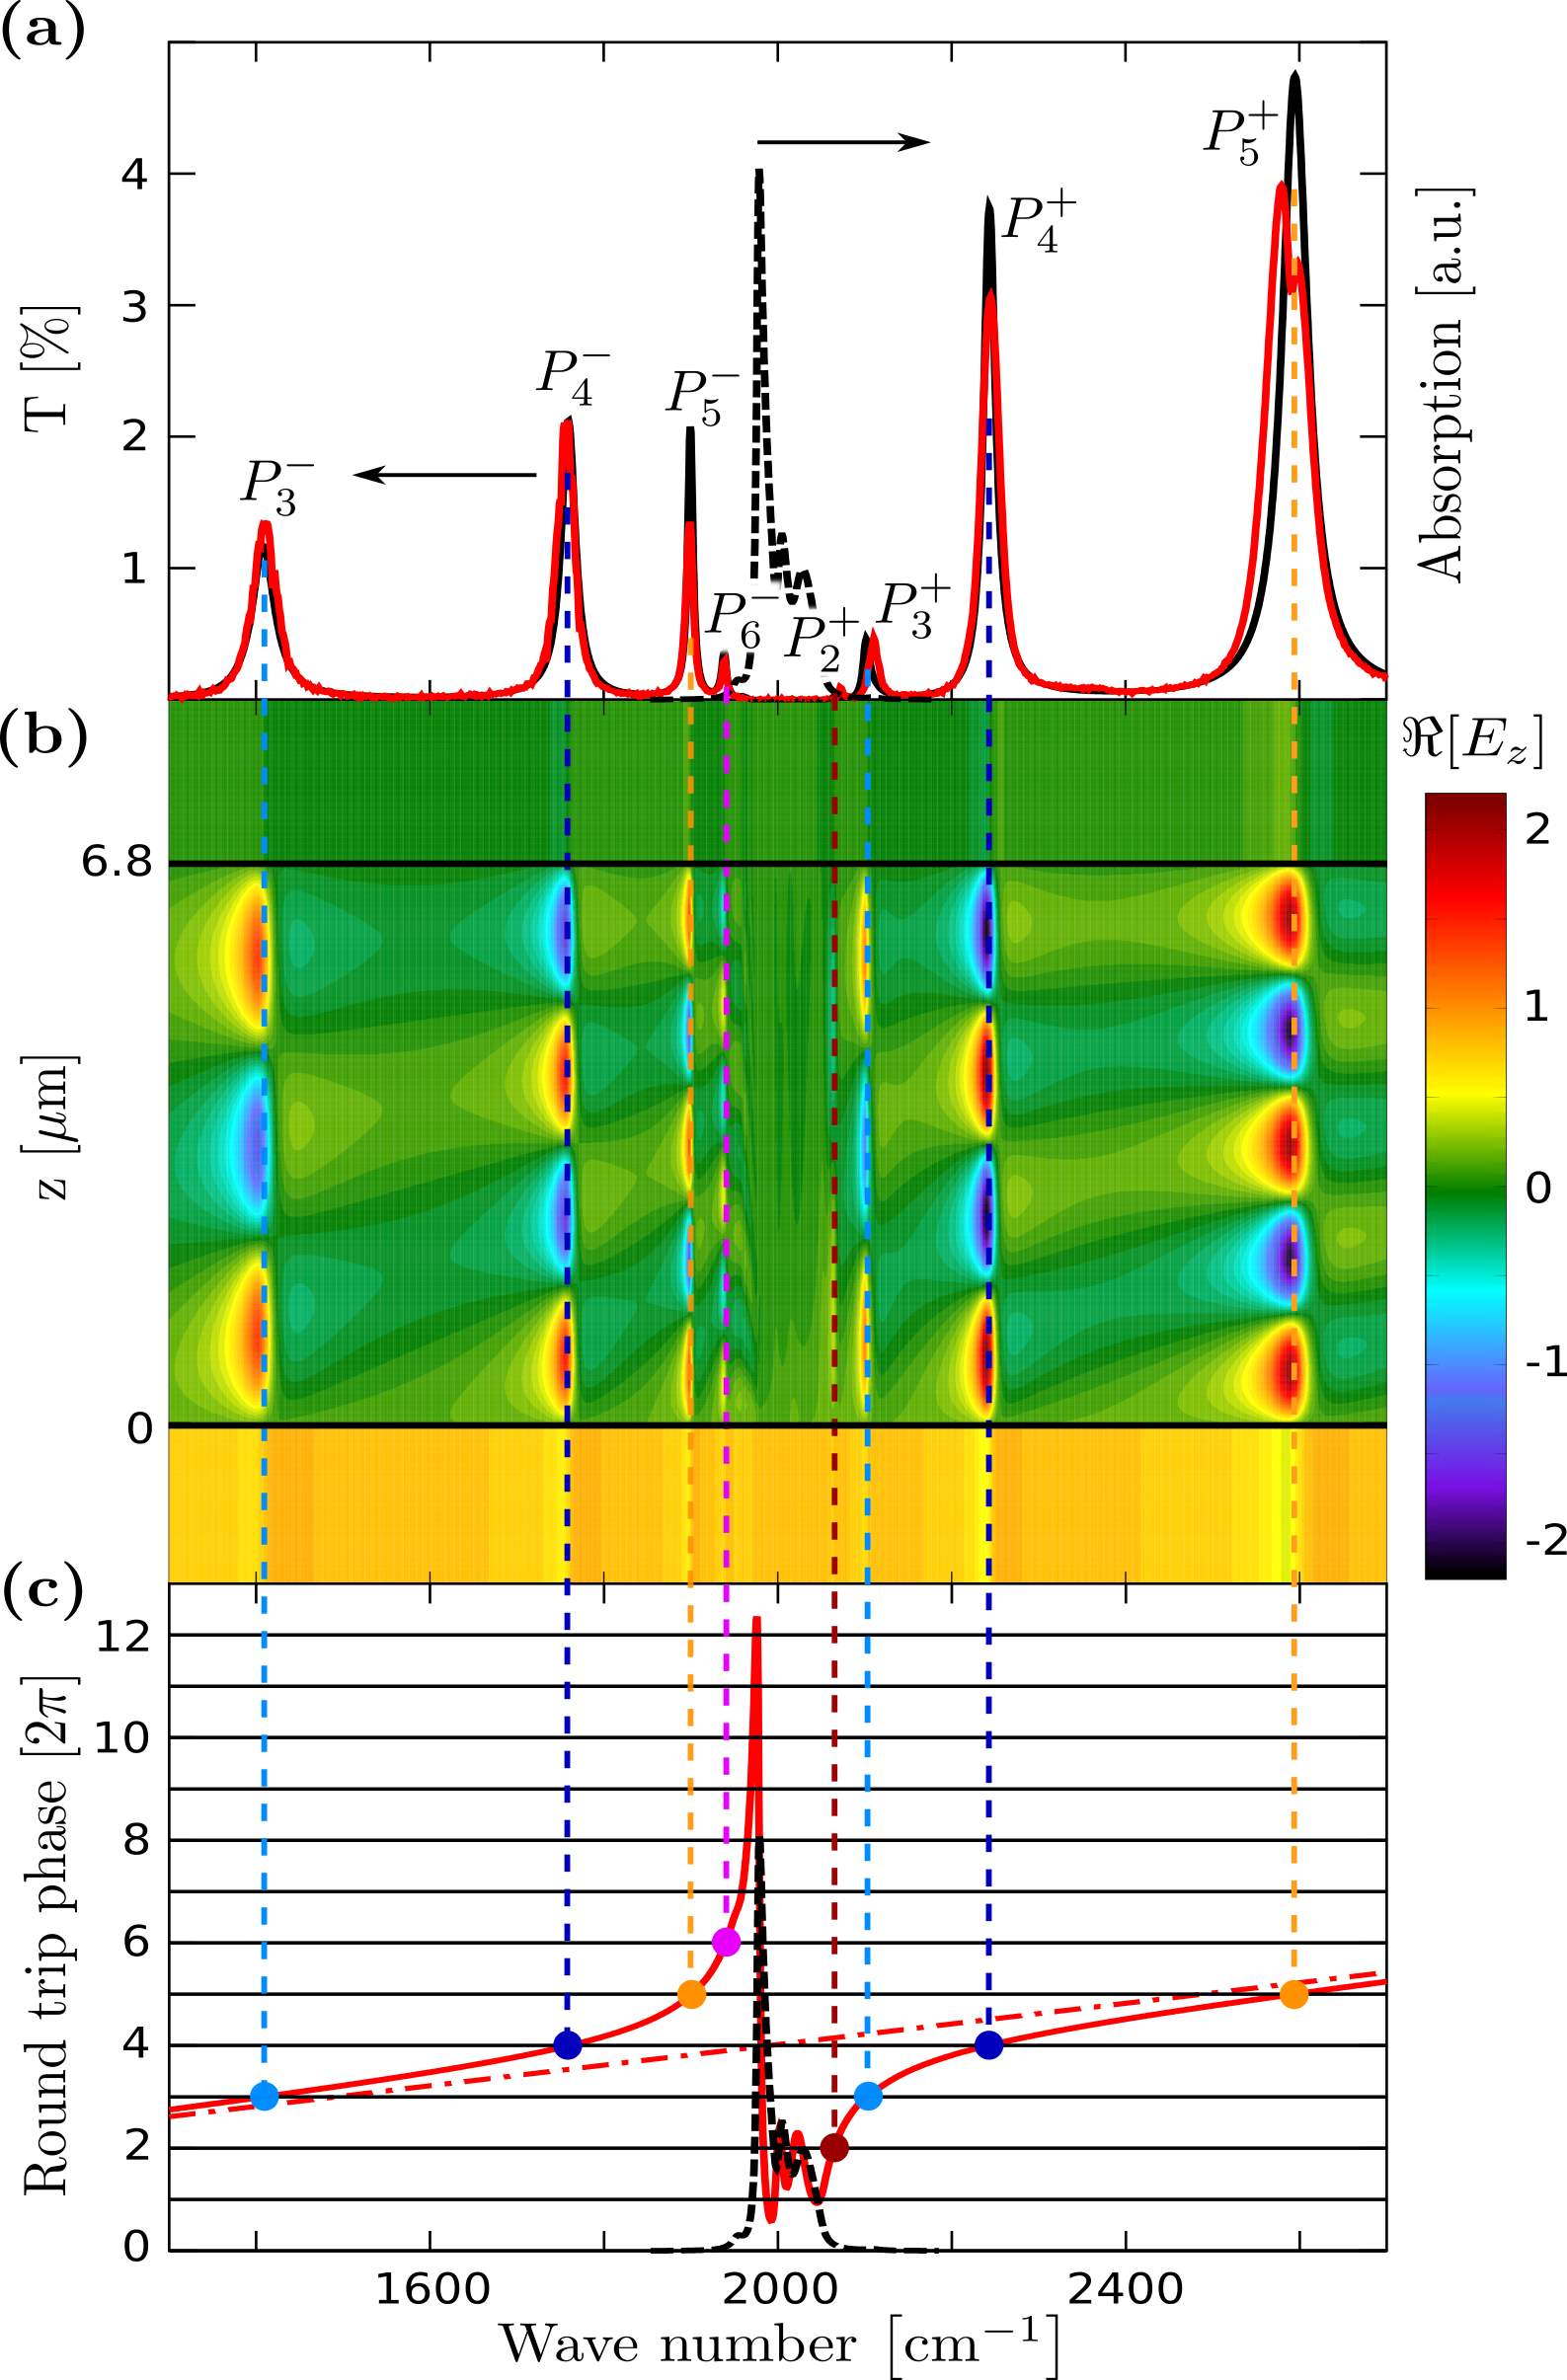
In order to understand the multi-peaked structure of the spectrum, we perform a transfer matrix simulation on a cavity filled with pure Fe(CO)5 liquid. Solving the multilayered structure consisting of the ZnSe flow cell windows, the Au cavity mirrors and the embedded absorbing medium, the calculated cavity transmission spectrum is shown together with the measured spectrum in Fig. 2(a). A detailed description of the modeling of our system is given in Appendix A. The electric field distribution inside the cavity was computed using the same parameters and is shown in Fig. 2(b). As can be seen from the field distributions, the CO-stretching mode of Fe(CO)5, when resonantly coupled to the -order mode of the FP cavity, gives rise to an upper and a lower mode, at and respectively. The other four new resonances on either sides of the fundamental CO-stretching mode are at (the other peaks outside this spectral window can be seen in Fig. 1). The field distributions enable us to identify the modes at higher energy as originating from the coupling between the vibrational band and lower optical modes of the cavity and vice versa for the modes at lower energy.
The positions of these modes is directly given by computing the round trip phase accumulation for the electromagnetic field in the cavity, where is the cavity length, is the vacuum frequency of light, is the speed of light, is real part of the refractive index and is the reflection phase due to the finite metal skin depth Zhu et al. (1990). As shown in Fig. 2(c), the dispersive character of the pure molecular liquid is so strong that optical modes of different -orders can satisfy simultaneously the resonant phase condition , with two solutions for each mode . The observed vibrational ladder is characterized by very large multi-mode splittings, with reaching ca. of the vibrational mode energy. Such a high ratio is often encountered in ultra-strongly coupled systems, and in order to confirm that our molecular liquid has entered into the USC regime, we now show that the spectral structure of the coupled vibrational ladder cannot be described outside the framework of ultra-strong light-matter interaction.
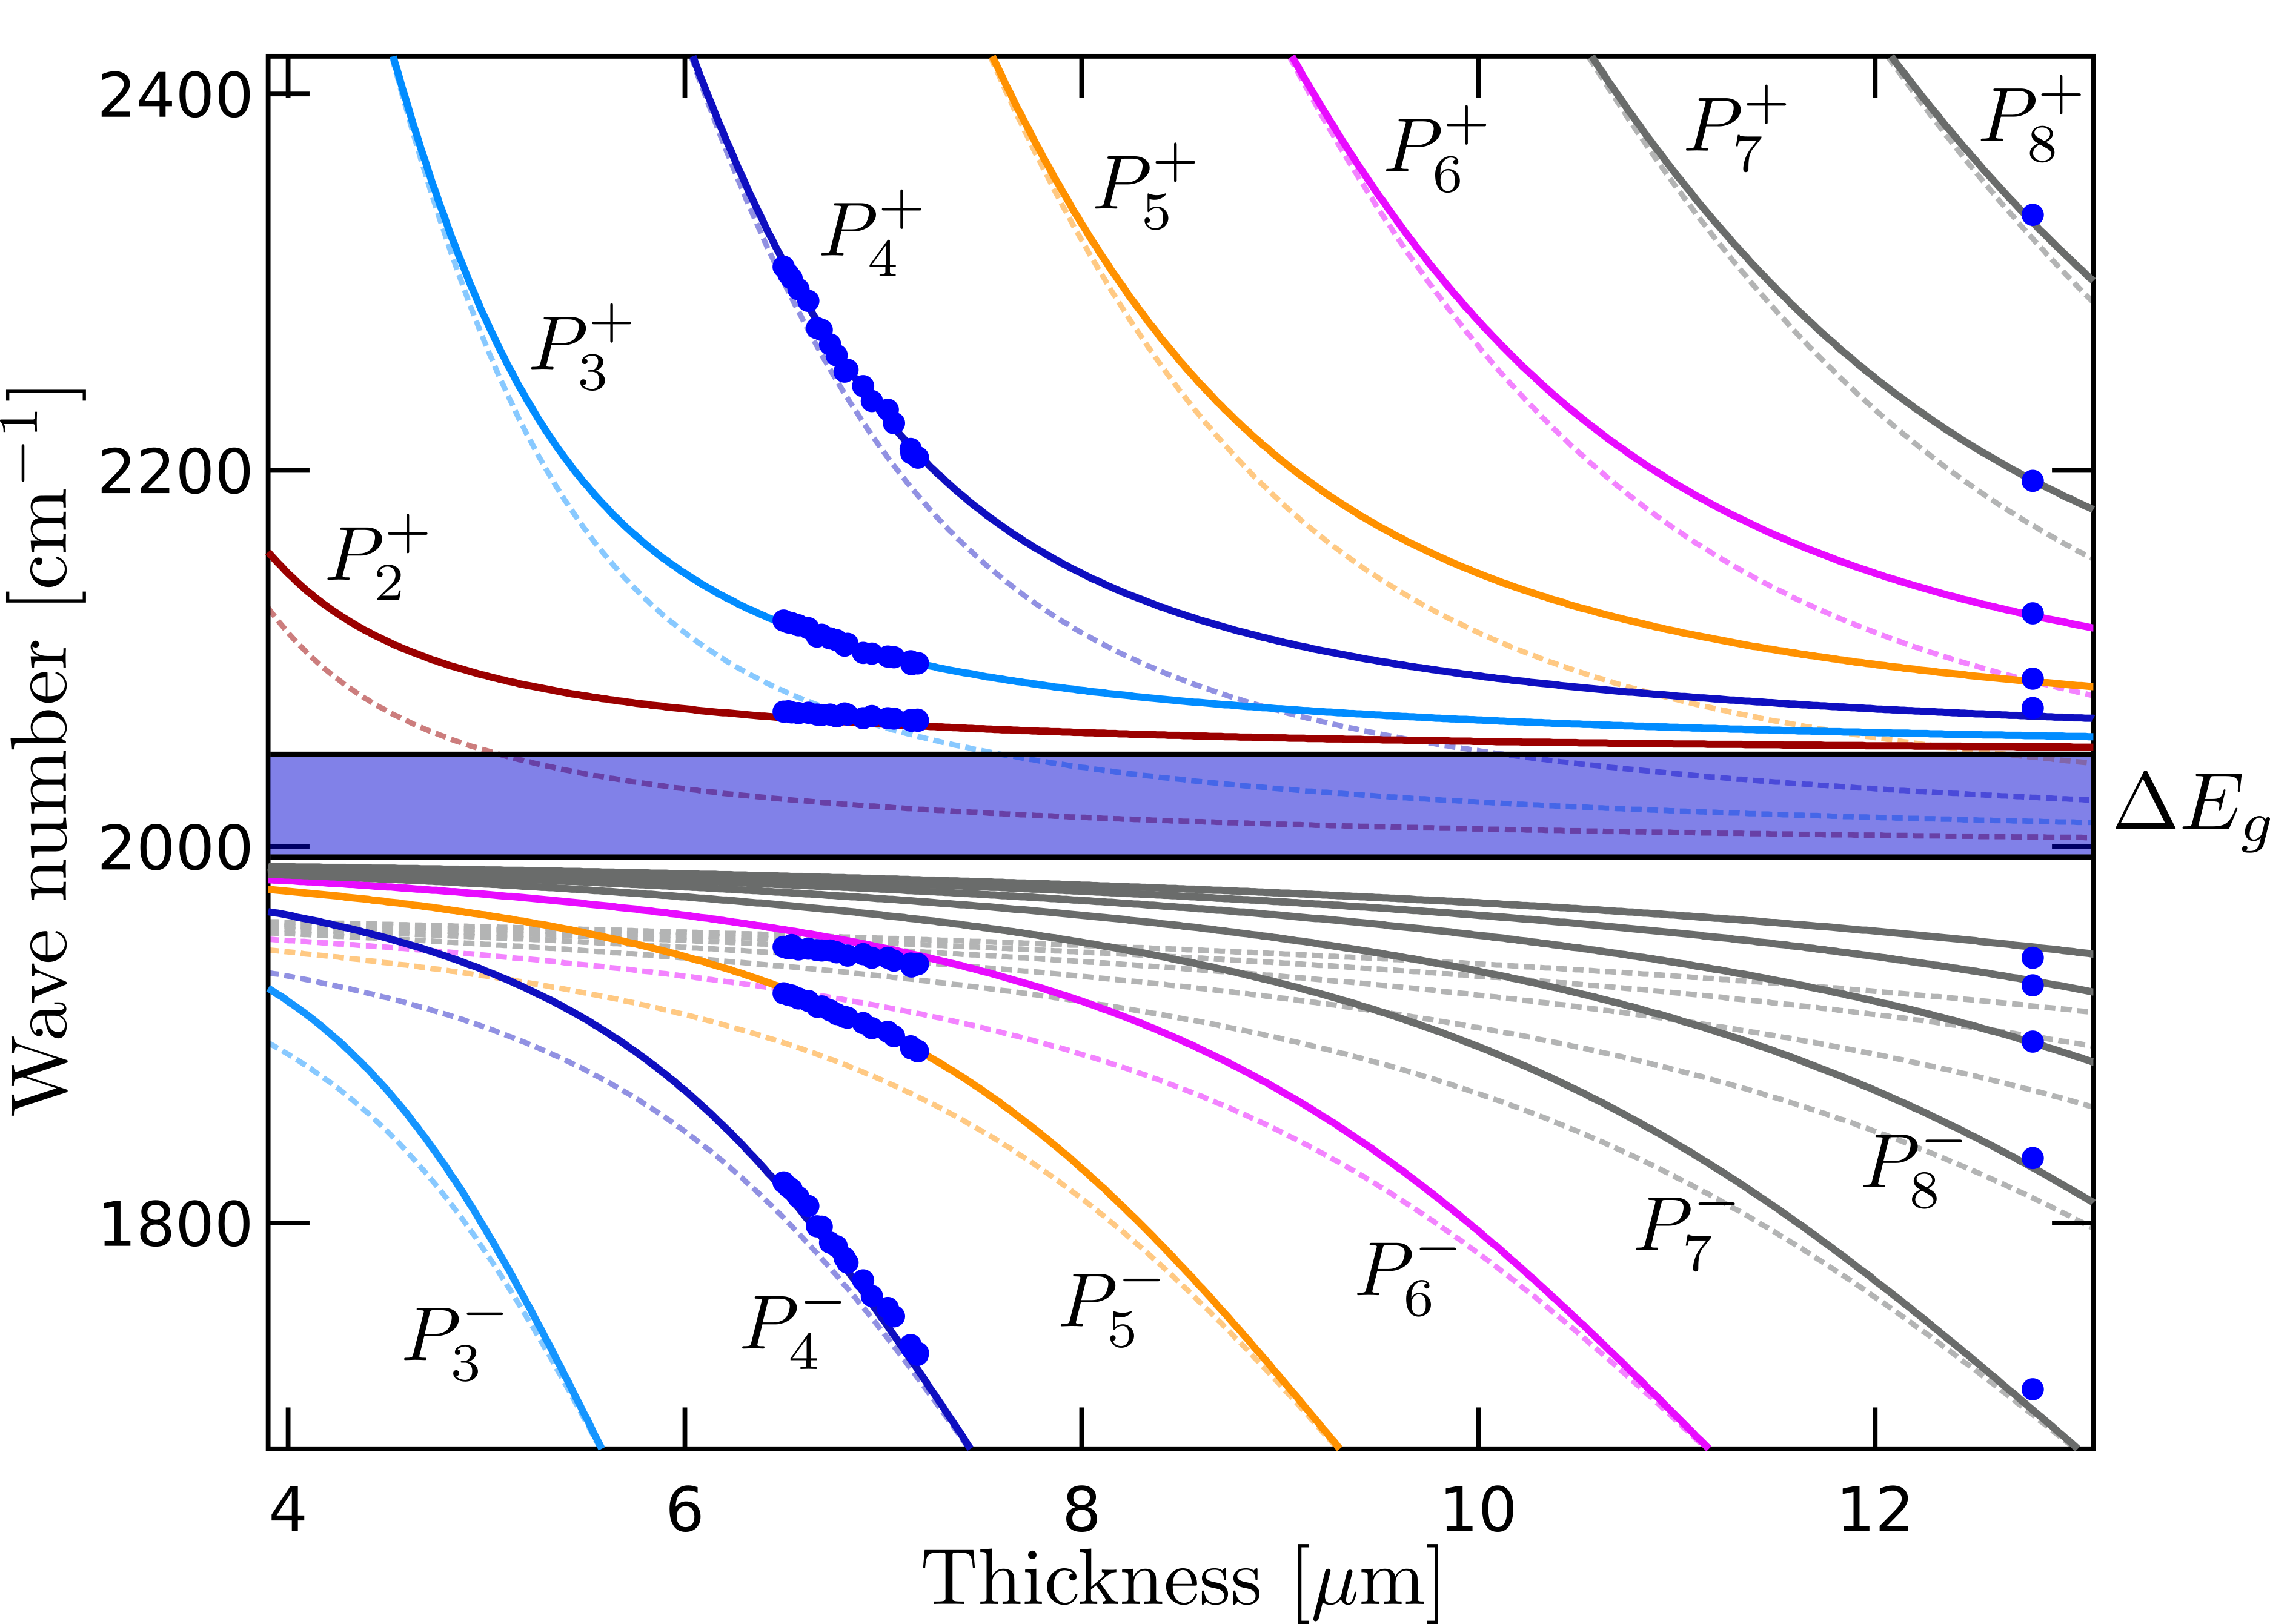
The involvement of specific features of the USC regime can be revealed most directly at the level of polaritonic dispersion diagrams. We have measured the dispersions of our coupled vibrational modes as a function of the cavity thickness (i.e. as a function of the detuning). This is done by varying the cavity thickness around a fixed value determined by the spacer inserted in our flow cell. The results are gathered in Fig. 3. Using a thicker spacer, we obtain the asymptotic positions of the coupled modes. These experimental data are compared to polaritonic dispersions that are calculated from a coupled oscillator model that takes explicitly into account the contributions of the vibrational dipolar self-energy in the molecular liquid and the anti-resonant coupling terms which are specific to the USC regime (see Appendix C for a detailed presentation of the model). We emphasize that in our model, there is only one free parameter which corresponds to the Rabi splitting .
As discussed in Appendix D, a coupled oscillator model keeping only the resonant interaction terms at order, and therefore neglecting the dipolar self-energy of the vibration (Jaynes-Cumming-type Hamiltonian), is unable to fit accurately the experiment close to the bare vibrational mode energy, as shown in Fig. 3 (blow up) and in full scale in the SM. This mismatch proves that our system is truly in the USC regime. Remarkably, the asymptotic values of the model yield a vibrational polaritonic bandgap of , as shown in Fig. 3. The opening of such a bandgap is an indisputable signature of the USC regime, as pointed out in the context of intersubband electronic transition systems Gambino et al. (2014); Askenazi et al. (2014). Here, we emphasize again that such a signature is observed for molecular vibrational transitions. More interestingly, the USC regime also implies that the vibrational ground state must shift to lower energies while acquiring a photonic admixture. Such modifications are analogous to those described at the level of electronic transitions, except that in our case, they imply a deep modification of the whole vibronic landscape of the dressed molecules.
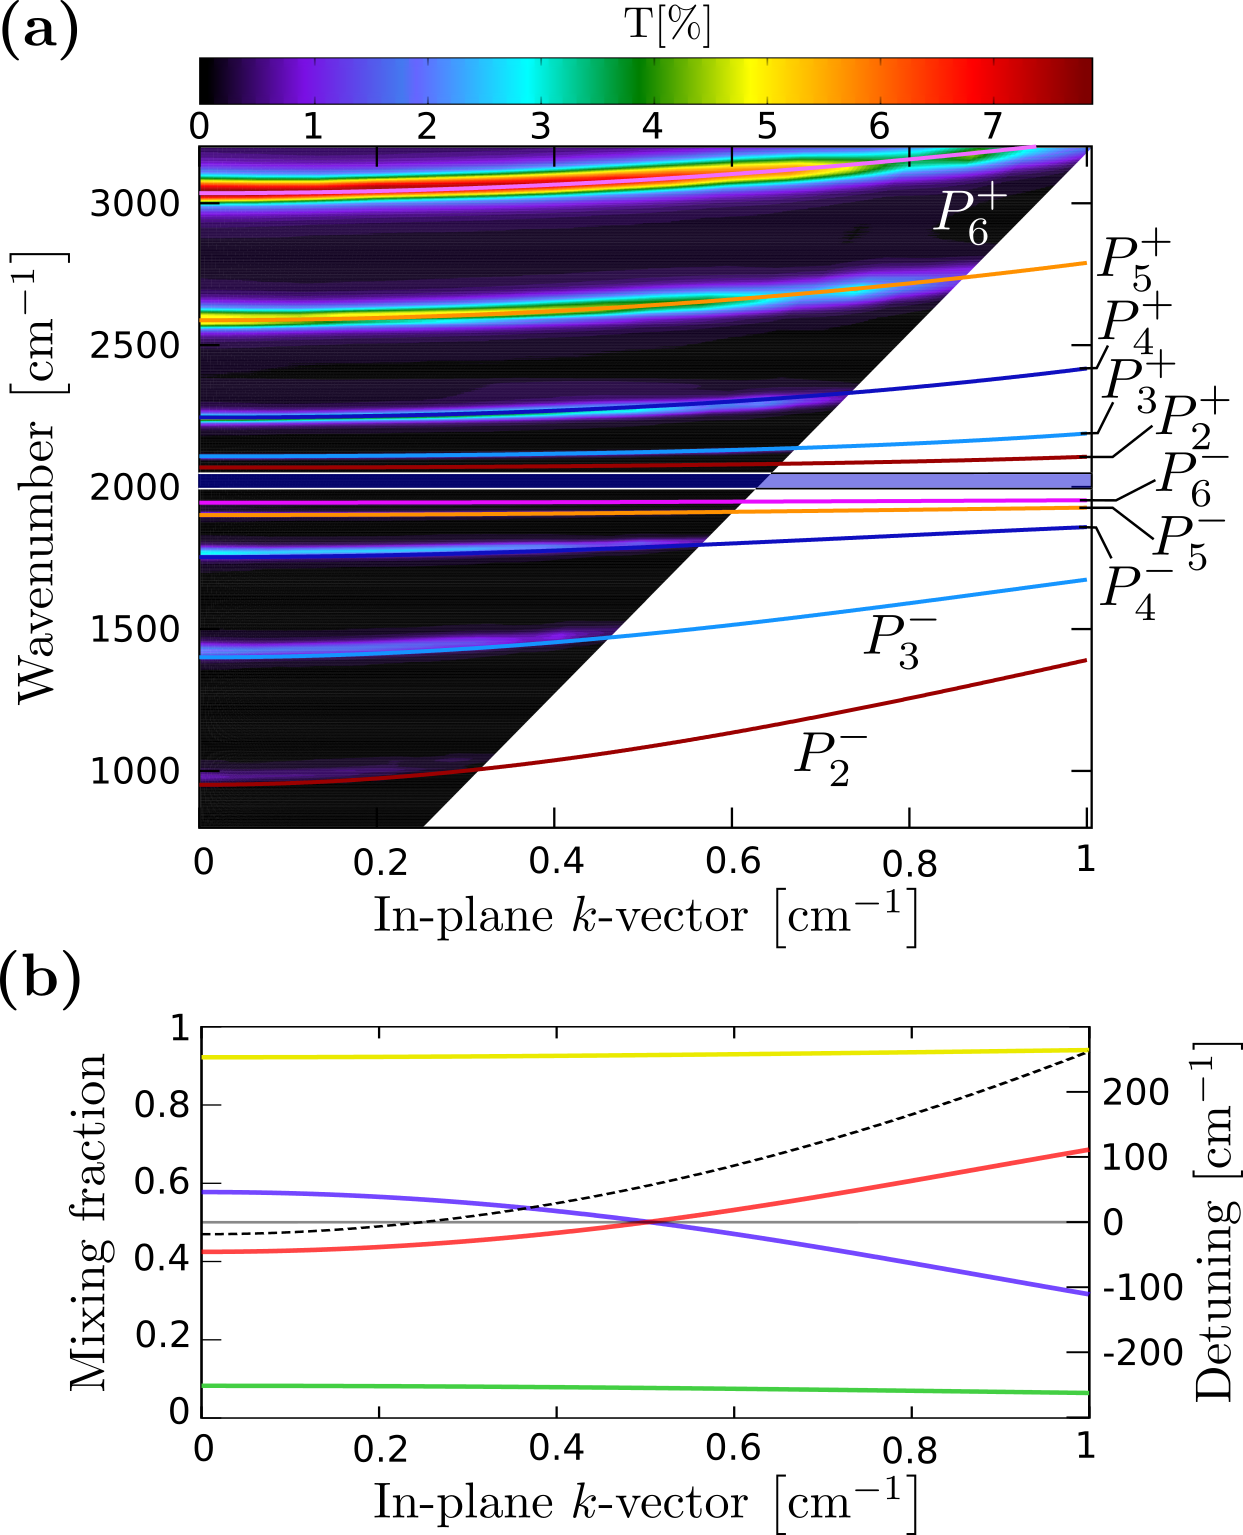
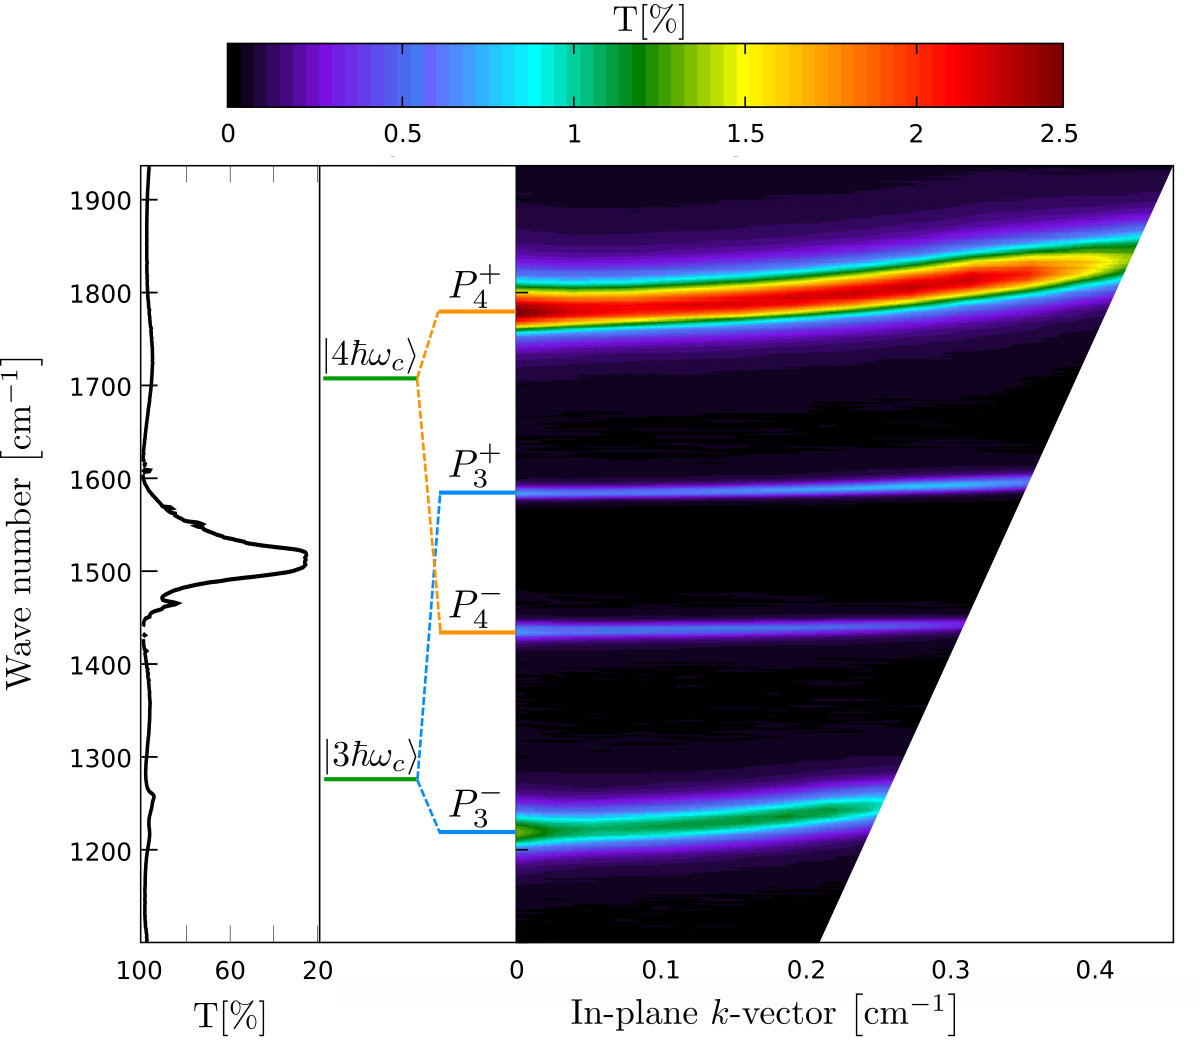
The second remarkable feature of the vibrational dressed states under USC is related to the presence of a genuine ladder of vibrational polaritonic states. To get further insight into the nature of these multiple polaritonic states, we perform angle-dependent experiments. The dispersion diagram shown in Fig. 4(a) clearly demonstrates the dispersive behavior of the different polaritonic states. This behavior is inherited from the photonic component of the polaritonic states, and is the signature of their hybrid light-matter nature. Taking the Rabi frequency parameter extracted from the best fit of the polaritonic thickness-dependent dispersions of Fig. 3, our USC oscillator model perfectly matches these experimental angular dispersion data. Again, the polaritonic bandgap is clearly seen, demonstrating that this forbidden energy band exists for any cavity thickness and at any angle. We stress that our model assumes no interaction between the polaritonic branches associated with different (orthogonal) cavity modes. However, non-trivial cross-talk between the different polaritonic branches should be expected when accounting for the non-Markovian behavior of our system ( Canaguier-Durand et al. (2015)). This analysis however goes beyond the scope of this work. The results of our fit are shown in Fig. 4(a), and the extracted Hopfield coefficients for the polaritonic states and are shown in Fig. 4(b) Deng et al. (2002). As expected, the vibrational content of the states increases as they approach the energy of the bare vibrational mode. It is interesting to note the non-trivial evolution of the Hopfield coefficients calculated for the lower polaritonic states which becomes more photon-like at resonance. This unbalanced matter- vs. photon-like mixing fraction is another remarkable feature of the USC regime that comes in clear contrast with the usual regime of strong coupling. Between and , the ladder consists of heavy (i.e. large vibrational content) polaritonic states. Surprisingly, those heavy polaritonic states display linewidths up to 5 times narrower than the width of the bare cavity mode, and up to 6 times smaller than the linewidth of the bare (inhomogeneoulsy broadened) molecular vibration. Because of the opening of the vibrational polaritonic bandgap, these heavy polaritonic states are pushed away from the dissipative region of the bare vibration, therefore remaining perfectly resolved with their narrow linewidths. The concomitance of multi-mode and ultra-strong coupling of vibrational modes can hence be seen as an interesting way to overcome a major hurdle encountered in the physics of electronic strong coupling Trichet et al. (2013).
In summary, we have demonstrated that it is possible to reach the regime of USC in the vibrational realm. This is done using high oscillator strength molecular liquids. We have revealed indisputable signatures of the USC regime, showing how the features inherent to the USC regime can be also found at the level of molecular vibrational modes. Remarkably, the molecular polaritonic multi-mode folding shown here is a practical way for generating heavy polaritonic states with smaller linewidths than both the optical transition and the molecular vibration, leading to enhanced coherence time. Perhaps more importantly, these results point to the potential impact of the USC regime in the context of bond-selective chemistry. As we already proposed Hutchison et al. (2012); Shalabney et al. (2015), the dynamics of bond breaking in the ground state could be significantly modified by vibrational strong coupling and even more under the USC regime where the whole vibrational ladder dressed by the IR cavity field is redefined. All these features will no doubt impact both the optical, the molecular and the material properties of these ultra-strongly coupled systems Galego et al. (2015), enriching the possibilities offered by such light-matter interactions.
Acknowledgements.
We thank David Hagenmuller for fruitfull discussions. This work was supported in part by the ERC Plasmonics no 22577, the ANR Equipex Union (ANR-10-EQPX-52-01), the Labex NIE projects (ANR-11-LABX-0058-NIE) and USIAS within the Investissement d’Avenir program ANR-10-IDEX-0002-02.Author Contributions - J.G. and T.C. contributed equally to this work.
Appendix A Transfer matrix simulations
Transfer matrix simulations amounts to solving the classical problem of a multi-layered stack of dispersive media in terms of forward and backward propagating electric field amplitudes. Thus for a given system to simulate, one needs to know the (complex) refractive indices and the thicknesses of each of the layers.
We first measure the IR transmission spectrum of a dilute Fe(CO)5 solution (10 wt % in toluene) injected in a barium fluoride BaF2 flow cell. BaF2 windows were preferred to ZnSe for this experiment as their lower refractive index minimizes Fabry-Pérot modulations of the transmission spectrum. As shown in Fig. 5(a), the spectrum consists of a strong inhomogeneously broadened absorption peak at . To fit this spectrum with the transfer matrix method, we model the complex refractive index of Fe(CO)5 with a multi-Lorentzian function:
| (1) |
where is the background refractive index, and , with the oscillator strength, the resonance wave vector and a phenomenological damping constant. It should however be noted that no specific meaning can be attributed to these individual Lorentzians since the only criterion here is to reproduce accurately the flow cell transmission spectrum. A good fit to this spectrum was obtained using 7 Lorentzians as shown in Fig. 5(a). In this fitting process, the cell length was also left a free parameter. Moreover, the calculations were performed assuming semi-infinite BaF2 cell windows, their actual thickness being (see Fig. 5(b)). Corrections for the front air/BaF2 and rear BaF2/air interfaces where done by using the bare BaF2 window transmission spectrum. The resulting fitted parameters are reported in Table 1.
| 111Cavity length in m. | 222All oscillator strengths are in m-2. | 333All resonant wave vectors are in m-1. | 444All phenomenological damping constants are in m-1. | ||||||||||||||||||||
We now use the fitted refractive index of Fe(CO)5 to model the transmission spectrum of the ZnSe cavity flow cell, again using the transfer matrix method. This time the only adjustable parameter is the exact cavity length , starting from a value of given by the manufacturer of the Mylar spacer. Indeed, as shown in Fig. 6, it is the Mylar spacer thickness that defines the length of the cavity. The best fit value is found to be . The cavity Au mirrors are thick as fixed by the sputtering parameters and their refractive indices are taken from Rakić et al. Rakić et al. (1998) with thickness corrections Shalabney et al. (2015). As before, the modeling is done assuming semi-infinite windows, and then correcting for the ZnSe/air interfaces (see Fig. 6). The results are shown in Fig. 2 of the main text.
The free spectral range (FSR) of the fitted cavity transmission spectrum, as determined by the peak-to-peak frequency spacing in a non-dispersive spectral region (), is . We note that this FSR is not directly related to the cavity length by the usual formula FSR because of the finite skin-depth of the Au cavity mirrors. Indeed, using this expression and the value of the FSR, we would expect a cavity thickness . The over-estimation factor with respect to the actual cavity thickness is . This factor only depends on the refractive indices of the Au/Fe(CO)5 and Au/ZnSe interfaces and on the Au mirror thickness. Thus, we will use it to correct the relationship between FSRs and cavity thicknesses in what follows: .
Appendix B Vibrational strong coupling of CS2
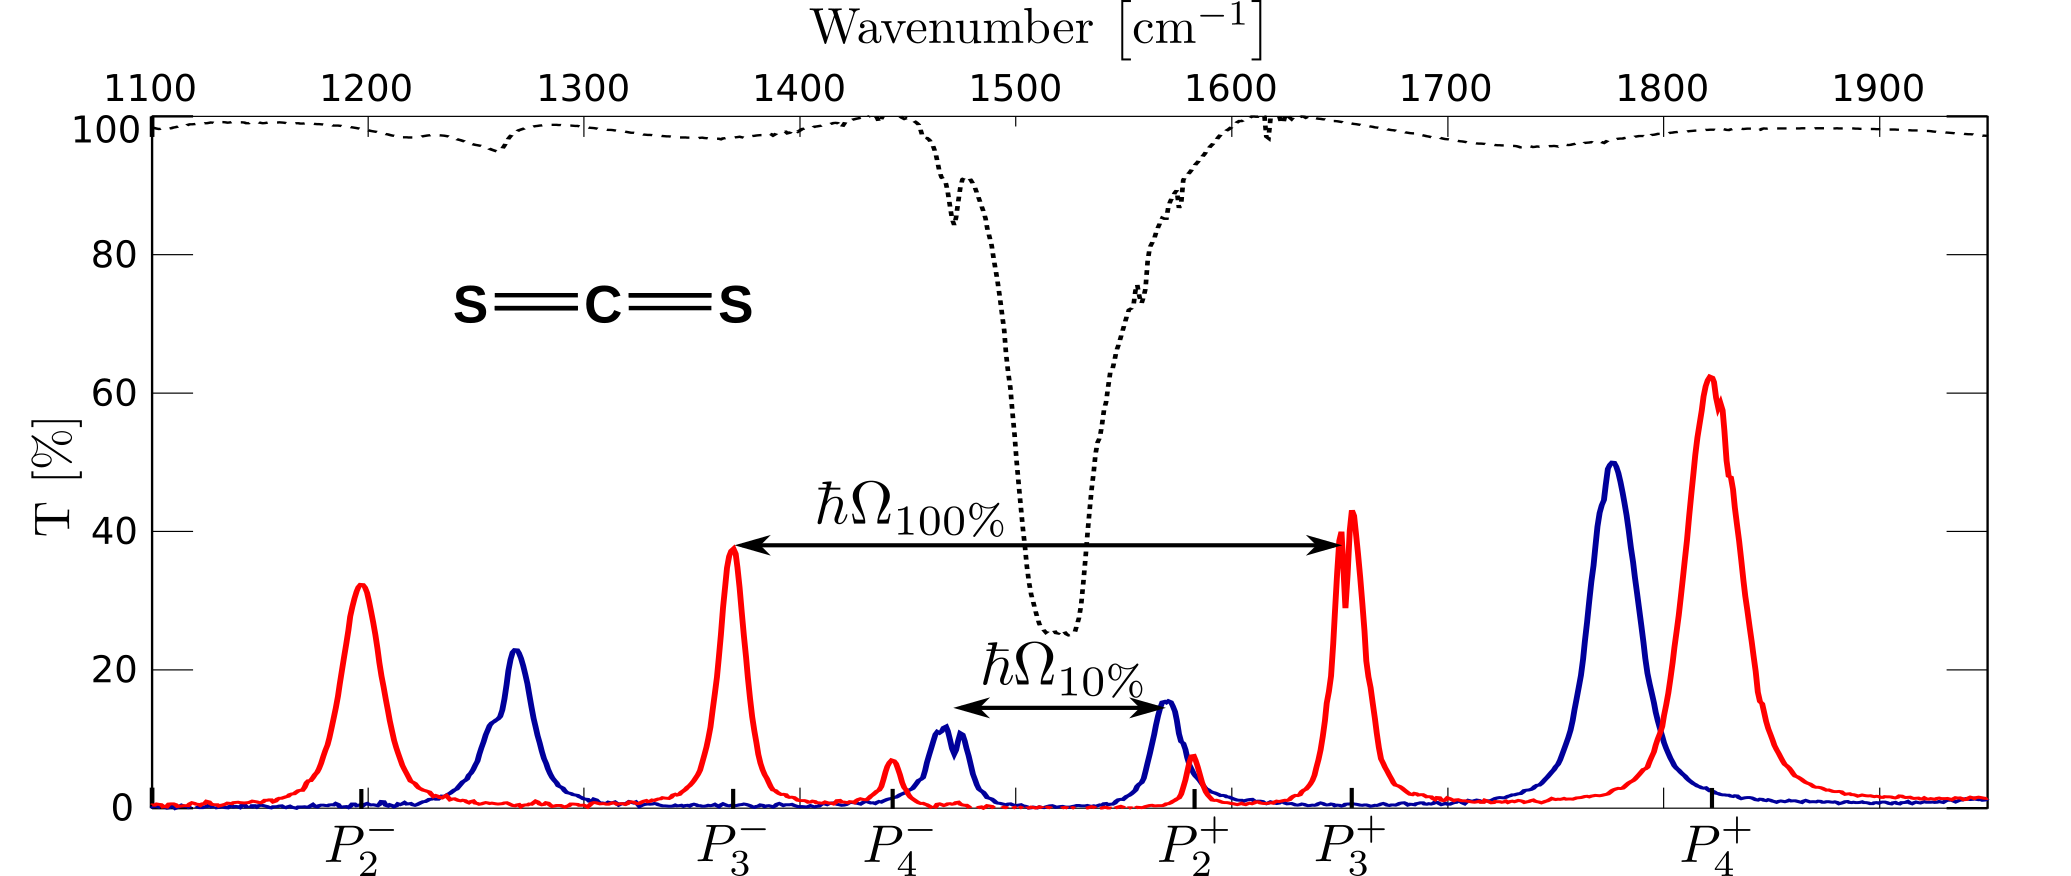
Similarly to the case of Fe(CO)5, the spectrum of strongly coupled CS2 goes from the normal double peaked spectrum at low concentration with a mode splitting to multi-mode splittings for a pure liquid with , as shown in Fig. 7. This large splitting amounts to ca. 19% of the vibrational transition frequency. Here the cavity is tuned to the asymmetric stretching mode of CS2 (structure in inset of Fig. 7) Plyler and Humphreys (1947).
As discussed in the main text, the high absorbance of the molecules can lead to multiple polaritonic states involving the off-resonance modes of the cavity. By a similar process, one can reach the extreme case in which polaritonic states are observed even when no optical mode is resonant with the vibrational transition. This is illustrated in Fig. 8 where pure liquid CS2 is injected into the cavity tuned so that the CS stretching mode energy lies in the cavity free spectral range, between the and modes as shown schematically in the left panel. The resulting transmission spectrum displays an off-resonance coupling with a skewed energy level distribution, with two new dispersive modes on either sides of the bare CS stretching band (Fig. 8, right panel). Moreover, it can be noted that the new states formed have an energy splitting at normal incidence of resulting from both the effect of detuning and coupling interaction. Again the dispersive behavior of these states is direct reflection of their photonic versus vibrational components. These characteristics of the off-resonant hybrid states are highly analogous to those resulting from orbital mixing in organometallic complexes in which the metal-ligand bonding molecular orbitals have more ligand character and anti-bonding molecular orbitals have more metal character, as explained by Ligand Field Theory (LFT) Figgis (1987).
Appendix C Collective vibrational coupling: a model for ultra-strongly coupled oscillators
We describe our molecular liquid as an ensemble of individual ground-state mechanical oscillators to each of which is associated a localized vibrational dipole . This yields a effective density of polarization which corresponds to a collective dipole localized on . This collective dipole is coupled to the electric displacement of a single -order longitudinal cavity mode of volume . In this effective dipolar point of view and neglecting the inhomogeneities of the cavity mode profile, the Hamiltonian describing the coupled system writes as
| (2) |
where corresponds to the intra-cavity volume occupied by the molecules.
With a background refractive index inside the cavity of length , the dispersion of the -order mode writes as
| (3) |
and is therefore parametrized by the conserved in-plane component of the light wavevector. This leads to define the cavity field Hamiltonian:
| (4) |
where the optical position and momentum quadratures are introduced, built from the annihilation (creation) photon operators as
| (5) |
with considering that .
Putting aside the rotational excitations which are not resolved in our experiment, the Born-Oppenheimer (BO) approximation enables us to separate the electronic and vibrational intra-molecular modes. We can thus consider that the vibrational dipole associated with each of the CO-stretching mode of one Fe(CO)5 molecule is merely defined from the dependence of the dipole moment on nuclear coordinates within the electronic state considered. The BO approximation also insures that the vibrational dynamics is performed within the same electronic quantum state -in our case, the electronic ground state of Fe(CO)5. Within this approach, each of the molecular vibrations are treated in the harmonic approximation (see Shalabney et al. (2015)) and we thus define the collective vibrational Hamiltonian as
| (6) |
with the vibrational transition associated with a single oscillator and
| (7) |
the vibrational position and momentum quadratures related to the annihilation (creation) operators of the vibrational mode of the molecule. The commutators simply write as and .
At room temperature, one only retains low vibrational excitation levels so that the vibrational dipole moment is given by a first-order expansion on the nuclear coordinates
| (8) |
This expansion is taken with respect to the equilibrium nuclear configuration (indicated by the subscript ) in the harmonic mean potential of the electronic ground state of the Fe(CO)5 molecule. The first term corresponds to the static dipole moment of the molecule at this equilibrium nuclear position. This static term cancels out due to the point group symmetry of the Fe(CO)5 molecule.
The nuclear coordinate associated with the harmonic molecular vibration is described in our model by a position quadrature operator
| (9) |
where is the reduced mass of the vibrational mode and the zero-point fluctuation amplitude of the molecular oscillator.
At this stage, we now assume that all vibrational modes are strictly degenerate in energy and mass . This leads us to the definition of the collective dipole operator
| (10) |
The operator corresponding to the electric displacement of the -order mode is given by Cohen-Tannoudji et al. (1997)
| (11) |
For the sake of the model’s simplicity, we will also assume (i) that the dipoles are all perfectly aligned with the polarization of the intracavity field and (ii) that . Under these assumptions, the Hamiltonian (2) becomes
| (12) | |||||
with
| (13) | |||||
| (14) | |||||
when at resonance .
Given the exceptionally high coupling strength provided by the molecular liquid, the dipolar self-energy term in the full Hamiltonian cannot be neglected in our description. The contribution of this self-energy can safely be neglected in the standard regime of strong coupling regime, but as it is known in the context of intersubband polaritonic modes Ciuti et al. (2005); Todorov et al. (2010), it must be fully accounted for in the definition of the equation of motion of the vibrational polaritonic states in the ultra-strong coupling regime. This is the central point that we demonstrate in the context of collective vibrational excitations.
To do so, we adapt the original procedure of Hopfield Hopfield (1958) (see also Ciuti et al. (2005)) to the case of an ensemble of vibrational modes. This procedure consists in writing down the equation of motion of a polaritonic annihilation operator defined as a normal mode operator of the system
| (15) |
where are the energies associated with the upper and lower polaritonic states.
Dealing with an ensemble of vibrational modes coupled to the cavity field, the definition of the normal mode operator
| (16) |
involves collective operators defined as
| (17) |
From , these collective operators obey canonical commutation relations
| (18) |
This implies that the normal mode operators will have the simple commutation relations
| (19) |
These definitions also lead to the following commutation rules
| (20) |
Using these rules, we derive the matrix for the equation of motion (Hopfield matrix)
| (21) |
where corresponds to the well-known fact that the collective coupling strength is time stronger than in the case of a single vibrational mode. The self-energy term is also enhanced by since we have .
The so-called rotating wave approximation (RWA) of the Hamiltonian (12) amounts to neglecting the off-diagonal blocks of the Hopfield matrix. Interestingly, as pointed out by Todorov et al. Todorov et al. (2010), polarization self-interaction must also be neglected in this regime, as it is a order term. The resulting matrix is
| (22) |
Appendix D Fitting the dispersion data
As explained in the main text, we measure experimentally the transmission spectra of cavities of different thicknesses, all filled with pure Fe(CO)5. The thickness of each of those cavities is directly accessible from the value of their FSR by making use of the correction factor described in section A. We thus end up with a set of cavity spectra of various thicknesses, each of them displaying multiple polaritonic resonances.
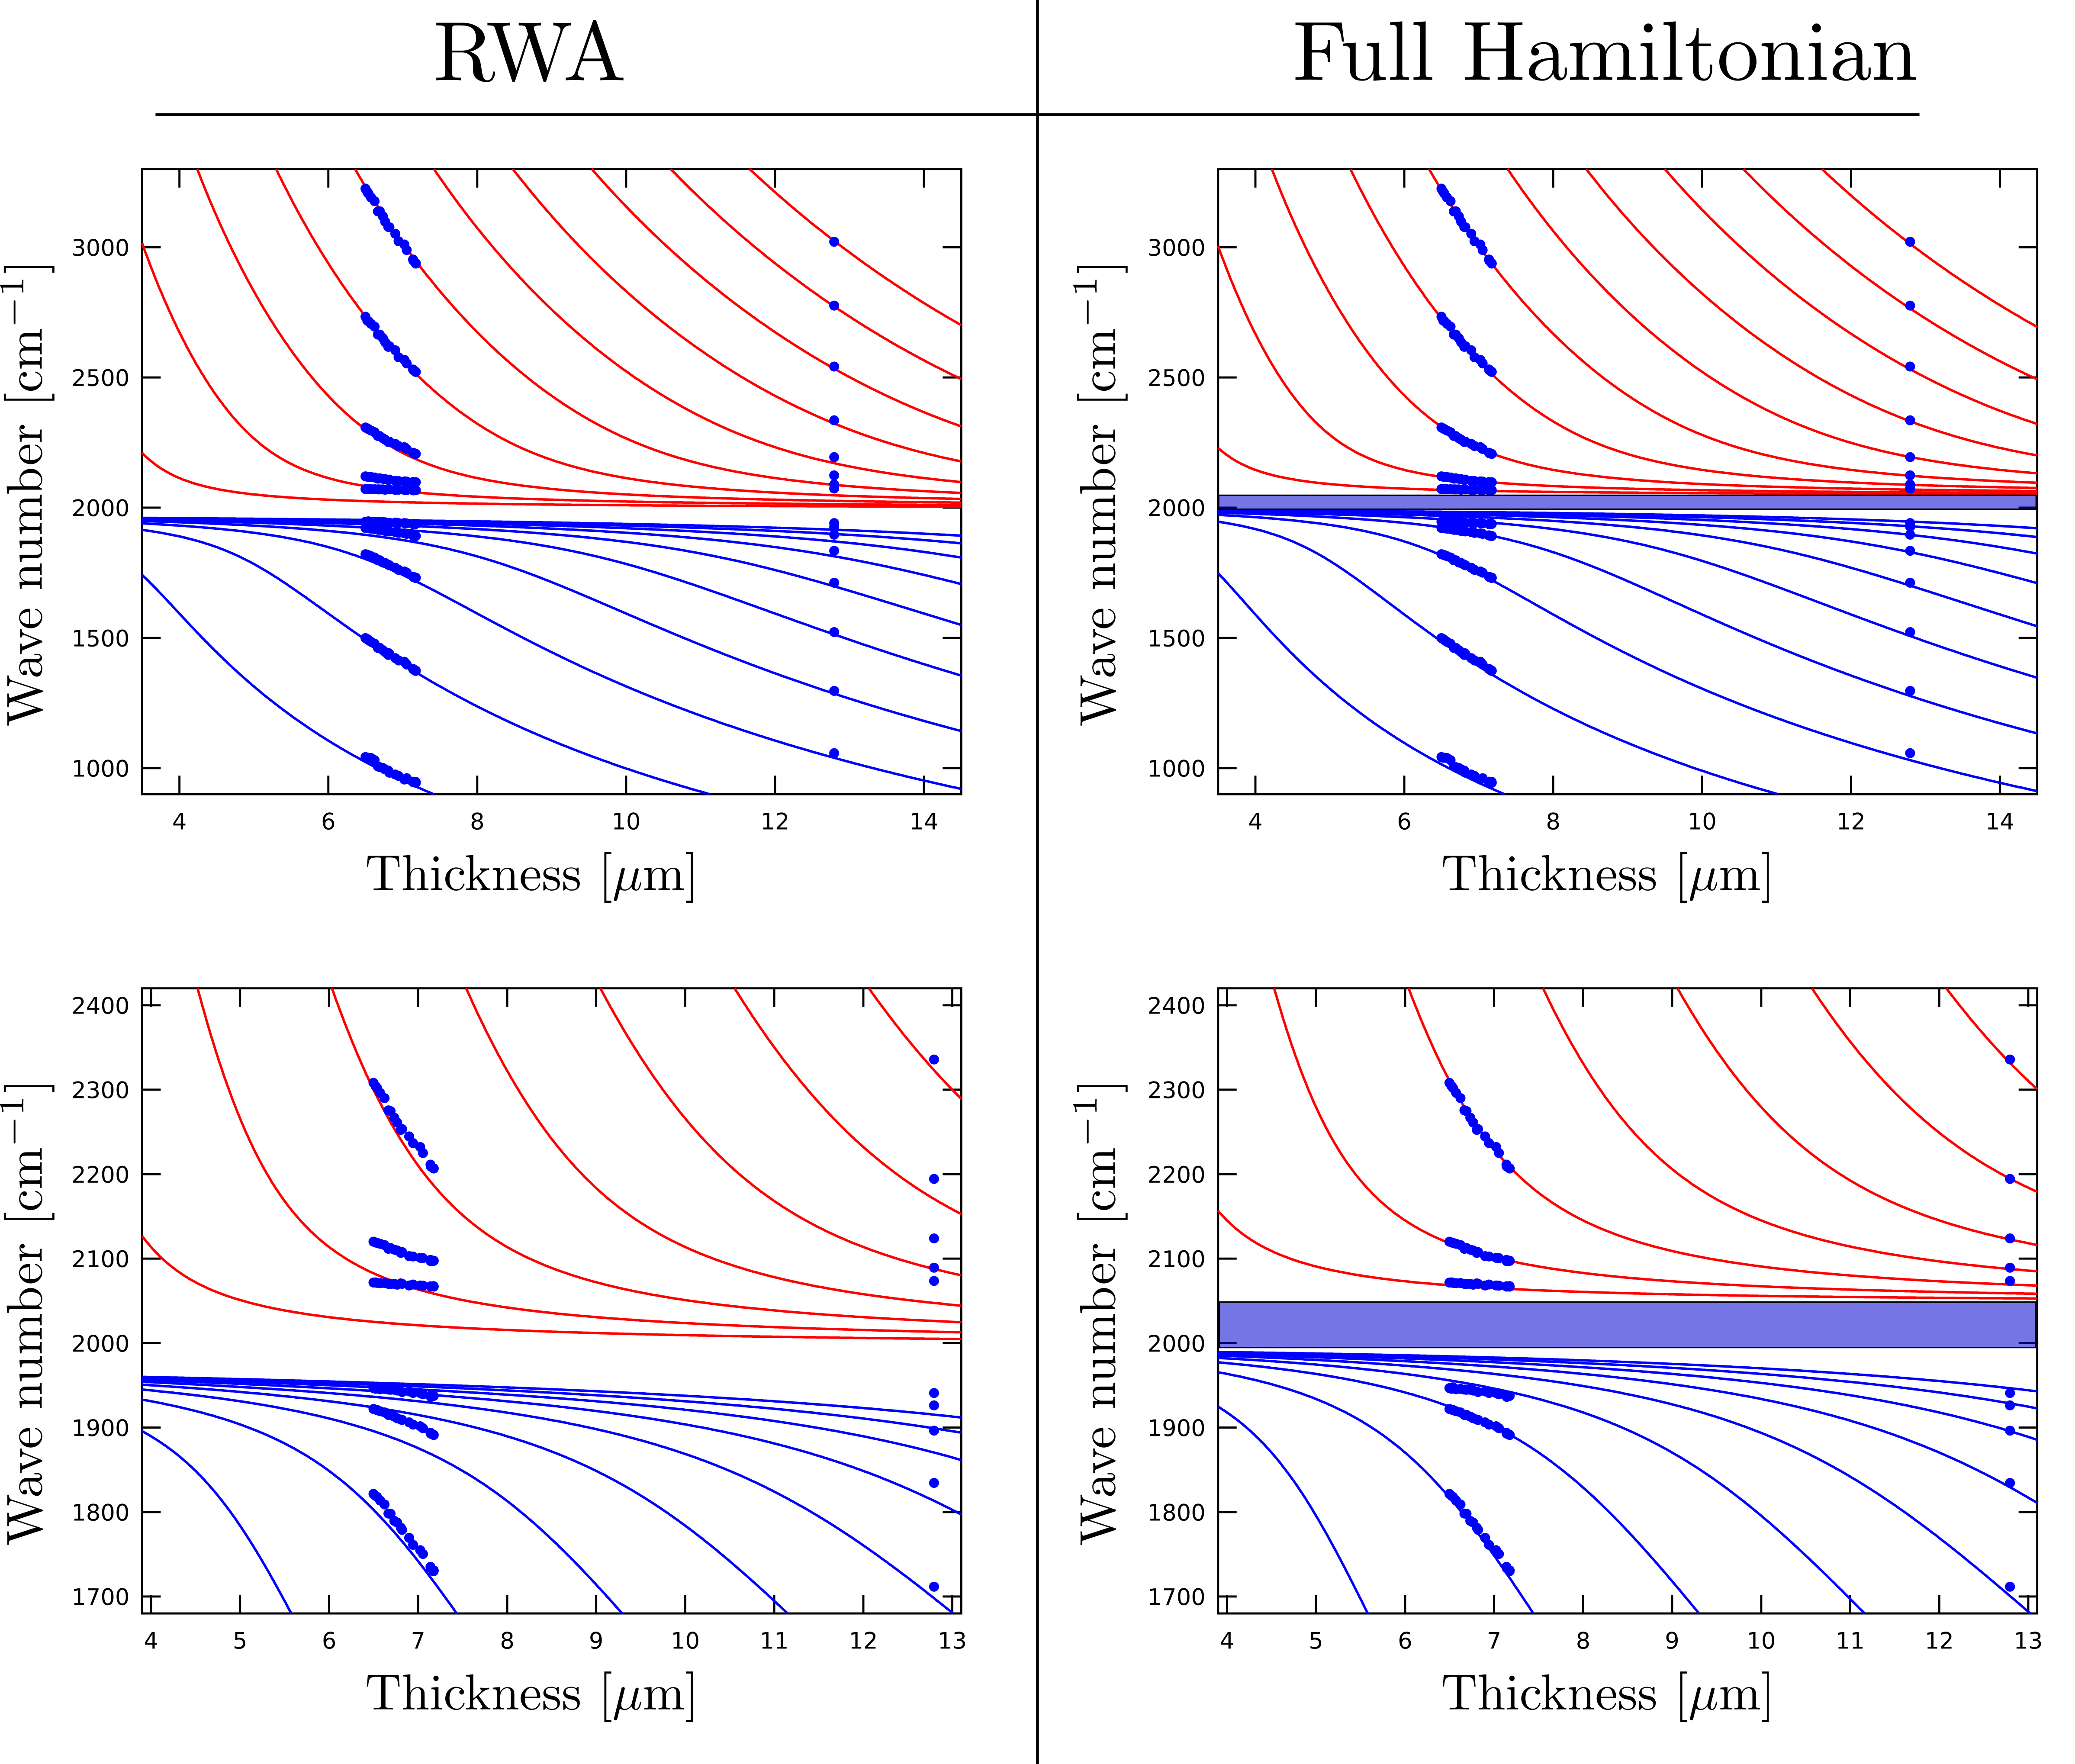
The resulting multimode polaritonic dispersion curves were compared successively to the full Hamiltonian model and to the RWA model by diagonalizing their respective Hopfield matrices (21) and (22). We stress that all the parameters entering those two models are determined experimentally, except for the Rabi splitting . Indeed, the cavity mode energy is directly known from the mode order, the cavity FSR and the refractive index, while the vibrational energy simply corresponds to the energy of maximal extinction in the dilute solution transmission spectrum of Fig. 5(a). This implies that the Rabi splitting is the unique free parameter in both fits.
In both cases, we search for a minimum of the following quantity Johnson :
| (23) |
where is the upper (lower) polaritonic branch of order, is the cavity thickness, is the corresponding measured vibrational polaritonic energy and is the calculated vibrational polaritonic energy which depends on the fitting parameter.
The main result of our analysis is the fact that even though both models match well the data on a broad energy range, the RWA model is totally unable to reproduce the measured dispersions close to the bare vibrational mode energy, as shown in Fig. 9. As emphasized in the main text, this proves that our system has genuinely reached the regime of USC.
References
- Agranovich et al. (2011) V. M. Agranovich, Y. N. Gartstein, and M. Litinskaya, Chem. Rev. 111, 5179 (2011).
- Raimond et al. (2001) J. M. Raimond, M. Brune, and S. Haroche, Rev. Mod. Phys. 73, 565 (2001).
- Skolnick et al. (1998) M. S. Skolnick, T. A. Fisher, and D. M. Whittaker, Semicond. Sci. Technol. 13, 645 (1998).
- Peter et al. (2005) E. Peter, P. Senellart, D. Martrou, A. Lemaitre, J. Hours, J. M. Gérard, and J. Bloch, Phys. Rev. Lett. 95, 067401 (2005).
- Wallraff et al. (2004) A. Wallraff, D. I. Schuster, A. Blais, L. Frunzio, R.-S. Huang, J. Majer, S. Kumar, S. M. Girvin, and R. J. Schoelkopf, Nature 431, 162 (2004).
- Pockrand et al. (1982) I. Pockrand, A. Brillante, and D. Möbius, J. Chem. Phys. 77, 6289 (1982).
- Lidzey et al. (1998) D. G. Lidzey, D. D. C. Bradley, M. S. Skolnick, T. Virgili, S. Walker, and D. M. Whittaker, Nature 395, 53 (1998).
- Holmes and Forrest (2004) R. J. Holmes and S. R. Forrest, Phys. Rev. Lett. 93, 186404 (2004).
- Bellessa et al. (2004) J. Bellessa, C. Bonnand, J. C. Plenet, and J. Mugnier, Phys. Rev. Lett. 93, 036404 (2004).
- Dintinger et al. (2005) J. Dintinger, S. Klein, F. Bustos, W. L. Barnes, and T. W. Ebbesen, Phys. Rev. B 71, 035424 (2005).
- Plumhof et al. (2014) J. D. Plumhof, T. Stäferle, L. Mai, U. Scherf, and R. F. Mahrt, Nat. Mater. 13, 247 (2014).
- Orgiu et al. (2015) E. Orgiu, J. George, J. A. Hutchison, E. Devaux, J. F. Dayen, B. Doudin, F. Stellacci, C. Genet, J. Schachenmayer, C. Genes, G. Pupillo, P. Samori, and T. W. Ebbesen, Nat. Mater. (2015).
- Törmä and Barnes (2015) P. Törmä and W. L. Barnes, Rep. Prog. Phys. 78, 013901 (2015).
- Shalabney et al. (2015) A. Shalabney, J. George, J. Hutchison, G. Pupillo, C. Genet, and T. W. Ebbesen, Nat. Commun. 6 (2015).
- George et al. (2015) J. George, A. Shalabney, J. A. Hutchison, C. Genet, and T. W. Ebbesen, J. Phys. Chem. Lett. 6, 1027 (2015).
- Muallem et al. (2015) M. Muallem, A. Palatnik, G. D. Nessim, and Y. R. Tischler, Ann. Phys. (2015).
- Long and Simpkins (2014) J. P. Long and B. S. Simpkins, ACS Photon. 2, 130 (2014).
- del Pino et al. (2015) J. del Pino, J. Feist, and F. J. Garcia-Vidal, New J. Phys. 17, 053040 (2015).
- Hutchison et al. (2012) J. A. Hutchison, T. Schwartz, C. Genet, E. Devaux, and T. W. Ebbesen, Angew. Chem. Int. Ed. 51, 1592 (2012).
- Ciuti et al. (2005) C. Ciuti, G. Bastard, and I. Carusotto, Phys. Rev. B 72, 115303 (2005).
- Todorov et al. (2010) Y. Todorov, A. M. Andrews, R. Colombelli, S. De Liberato, C. Ciuti, P. Klang, G. Strasser, and C. Sirtori, Phys. Rev. Lett. 105, 196402 (2010).
- Scalari et al. (2012) G. Scalari, C. Maissen, D. Turčinková, D. Hagenmüller, S. De Liberato, C. Ciuti, C. Reichl, D. Schuh, W. Wegscheider, M. Beck, and J. Faist, Science 335, 1323 (2012).
- Askenazi et al. (2014) B. Askenazi, A. Vasanelli, A. Delteil, Y. Todorov, L. Andreani, G. Beaudoin, I. Sagnes, and C. Sirtori, New J. Phys. 16, 043029 (2014).
- Gambino et al. (2014) S. Gambino, M. Mazzeo, A. Genco, O. Di Stefano, S. Savasta, S. Patanè, D. Ballarini, F. Mangione, G. Lerario, D. Sanvitto, and G. Gigli, ACS Photon. 1, 1042 (2014).
- Schwartz et al. (2011) T. Schwartz, J. A. Hutchison, C. Genet, and T. W. Ebbesen, Phys. Rev. Lett. 106, 196405 (2011).
- Cataliotti et al. (1971) R. Cataliotti, A. Foffani, and L. Marchetti, Inorg. Chem. 10, 1594 (1971).
- Meiser and Meystre (2006) D. Meiser and P. Meystre, Phys. Rev. A 74, 065801 (2006).
- Dupont et al. (2007) E. Dupont, J. A. Gupta, and H. C. Liu, Phys. Rev. B 75, 205325 (2007).
- Yu et al. (2009) X. Yu, D. Xiong, H. Chen, P. Wang, M. Xiao, and J. Zhang, Phys. Rev. A 79, 061803 (2009).
- Zhu et al. (1990) Y. Zhu, D. J. Gauthier, S. E. Morin, Q. Wu, H. J. Carmichael, and T. W. Mossberg, Phys. Rev. Lett. 64, 2499 (1990).
- Canaguier-Durand et al. (2015) A. Canaguier-Durand, C. Genet, A. Lambrecht, T. W. Ebbesen, and S. Reynaud, Eur. Phys. J. D 69, 1 (2015).
- Deng et al. (2002) H. Deng, G. Weihs, C. Santori, J. Bloch, and Y. Yamamoto, Science 298, 199 (2002).
- Trichet et al. (2013) A. Trichet, E. Durupt, F. Médard, S. Datta, A. Minguzzi, and M. Richard, Phys. Rev. B 88, 121407 (2013).
- Galego et al. (2015) J. Galego, F. J. Garcia-Vidal, and J. Feist, Phys. Rev. X 5, 041022 (2015).
- Rakić et al. (1998) A. D. Rakić, A. B. Djurišić, J. M. Elazar, and M. L. Majewski, Appl. Opt. 37, 5271 (1998).
- Plyler and Humphreys (1947) E. K. Plyler and C. J. Humphreys, J. Res. Natl. Bur. Stand 39, 59 (1947).
- Figgis (1987) B. N. Figgis, Comprehensive Coordination Chemistry 1, 213 (1987).
- Cohen-Tannoudji et al. (1997) C. Cohen-Tannoudji, J. Dupont-Roc, and G. Grynberg, Photons and Atoms: Introduction to Quantum Electrodynamics (Wiley-VCH, 1997).
- Hopfield (1958) J. Hopfield, Phys. Rev. 112, 1555 (1958).
- (40) S. G. Johnson, http://ab-initio.mit.edu/nlopt .