InfraredOfMixturesSup
Infrared Peak-Splitting from phonon localization in Solid Hydrogen
Abstract
We show that the isotope effect leads to a completely different spectroscopic signal in hydrogen-deuterium mixtures, compared to pure elements that have the same crystal structure. This is particularly true for molecular vibrations, which are the main source of information about the structure of high-pressure hydrogen. Mass disorder breaks translational symmetry, meaning that vibrations are localized almost to single molecules, and are not zone-center phonons. In mixtures, each observable IR peak corresponds to a collection of many such molecular vibrations, which have a distribution of frequencies depending on local environment. Furthermore discrete groups of environments cause the peaks to split. We illustrate this issue by considering the IR spectrum of the high pressure Phase III structure of hydrogen, recently interpreted as showing novel phases in isotopic mixtures. We calculate the IR spectrum of hydrogen/deuterium mixtures in the and -12 structures, showing that isotopic disorder gives rise to mode localization of the high frequency vibrons. The local coordination of the molecules leads to discrete IR peaks. The spread of frequencies is strongly enhanced with pressure, such that more peaks become resolvable at higher pressures, in agreement with the recent measurements.
pacs:
61.50.Ah, 63.20.dk 63.50.Gh 78.30.LyThe phase diagram of hydrogen is of intense interest at present as the search for crystalline metallic hydrogen hots upDias et al. (2016); Dalladay-Simpson et al. (2016); Howie et al. (2015, 2014); Eremets et al. (2016). Critically, metallic hydrogen must not only be madeDias and Silvera (2017), but an unambiguous experimental signal to prove its existence is needed. It is therefore central to the endeavour that the expected spectroscopic signature is properly understood.
Due to the poor X-ray scattering and small sample sizes, precision crystallography of high pressure hydrogen has proved impossible and most information is gleaned from Raman and Infrared (IR) spectroscopy. This measures the vibrational frequencies within the crystal, and cannot determine crystal structure. However, it often provides enough information to distinguish between theoretically produced candidate structures. For this combined calculation-experiment solution of crystal structure to work, it is essential that the calculated spectra are well understood.
Because of the mass difference between the isotopes, the spectroscopic signal in hydrogen and deuterium is different. For harmonic phonons, at the same atomic volume this gives a simple frequency rescaling of . Variations from this give information about anharmonic behaviour, which will normally be larger for the lighter isotope. But there are practical difficulties in “equal volume” comparisons. For a given volume, the calculated pressure and free energy depend on zero point effects, which can be different in D2 and H2 by up to 10 GPaAckland and Magdău (2015); McMinis et al. (2015); Drummond et al. (2015). Volume is extremely difficult to measure experimentally, while the “diamond edge” pressure scale has been twice recalibrated by up to 20 GPa in the last ten yearsAkahama and Kawamura (2010).
Although the H2 and D2 spectra are related by a simple scaling, the spectrum of hydrogen deuteride (HD) can be far more complicated. This is mainly because, once the reaction reaches equilibrium, the solid contains three molecular types. Molecular modes such as vibrons and rotons then split into three, while lattice modes such as layer vibration adopt an average frequency. Furthermore, because of mass-disorder, Bloch’s theorem no longer applies and the difference in masses can drive mode localization, provided the frequency is high enough Anderson (1958); Monthus and Garel (2010). These features mean that the spectroscopic signal from hydrogen-deuterium mixtures, whether Raman on IR, can look very different from the single element even if the underlying structure is identical. The importance of high frequency in allowing localization means that it is the vibron spectra where this is most pronouncedMonthus and Garel (2010); Howie et al. (2014).
Phase III of elemental H2 and D2 has a particularly strong and simple IR signatureHemley and Mao (1988); Lorenzana et al. (1989); Goncharov et al. (2001); Loubeyre et al. (2002); Zha et al. (2012); Goncharov et al. (2013), so it was surprising when very complex spectra were found in recent experiments starting with HD at low temperaturesDias et al. (2016). At low pressures only the HD infrared peak was observed, corresponding to Phase II. Upon entering phase III, an H2 peak was observed, but no D2. Subsequently two new phases were reported, based on the infrared spectra. The first transition to a new phase IV* happened at 200 GPa where both HD and H2 peak split in two and two new D2 vibron peaks appeared. The second transition around 250 GPa to a phase called HD-PRE was identified by further splitting in the HD vibron.
Different phase behaviour in isotopic mixtures from pure elements is extremely difficult to understand with equilibrium thermodynamics. The electronic structure in the Born-Oppenheimer approximation is the same in each case, so isotopic differences are due to vibrational effects, notably zero point energy, which depends on mass 111We disregard the possibility that all previous experiments on H/D were somehow trapped in an para/ortho ground state, and that those different nuclear states somehow lead to the same energetics which are, in turn, different from the energetics of HD which has no ortho/para states.. Hydrogen and deuterium exhibit the same phase sequence, so different HD phases would require that, as mean molecular mass increases from 1, to 1.5 to 2, the structure is first destabilized then restabilized by increasing mass. This observation is sufficiently unexpected as to merit further explanation.
Density functional theory (DFT) calculations using the PBE functional have produced a range of possible candidate structures for hydrogen under these conditions, with good agreement for Raman and IR spectra of phases III and IV in pure isotopesClark et al. (2005); Perdew et al. (1996); Pickard and Needs (2007); Pickard et al. (2012); Lebègue et al. (2012); Magdău and Ackland (2013); Monserrat et al. (2016). In calculations with static ions, DFT exhibits no isotope effects: these enter only through the vibrational behaviour, mainly zero-point effects. Spectroscopy probes this vibrational behaviour, so isotopic differences can be studied using lattice dynamics. Here we calculate the expected IR spectroscopic signature from candidate structures above 150 GPa and below room temperature.
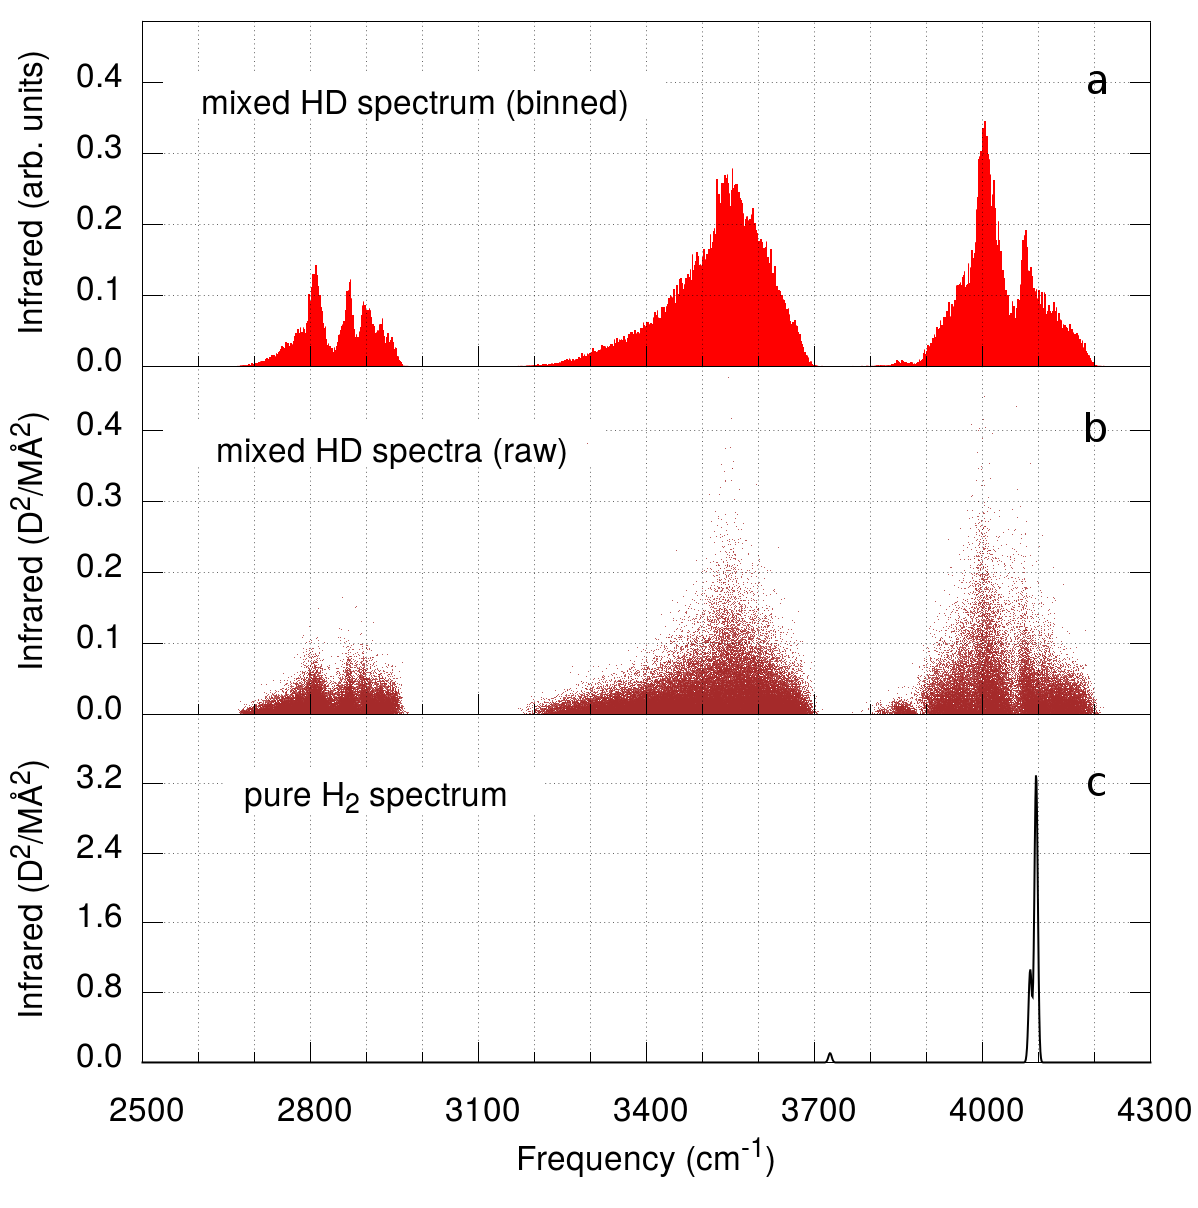
We calculated the pressure evolution of the infrared spectra for 50:50 hydrogen-deuterium mixtures at the equilibrium concentrations of 25% H2, D2 and 50% HD. According to now-routine calculations the energetically-favored crystal is one of a number of similar structures such as or which can be viewed as atomic layersPickard et al. (2012); Monserrat et al. (2016), or as close-packed moleculesMagdău et al. (2017). We choose to represent these phases with and for contrast, we also consider the -12 structure, predicted to be stable at higher pressures (Fig.1. ). We calculated the full Raman spectra, but we concentrate on the vibron modes because they can be directly compared with experiment (Fig.3) and because the low frequency modes do not show localization effectsMonthus and Garel (2010).
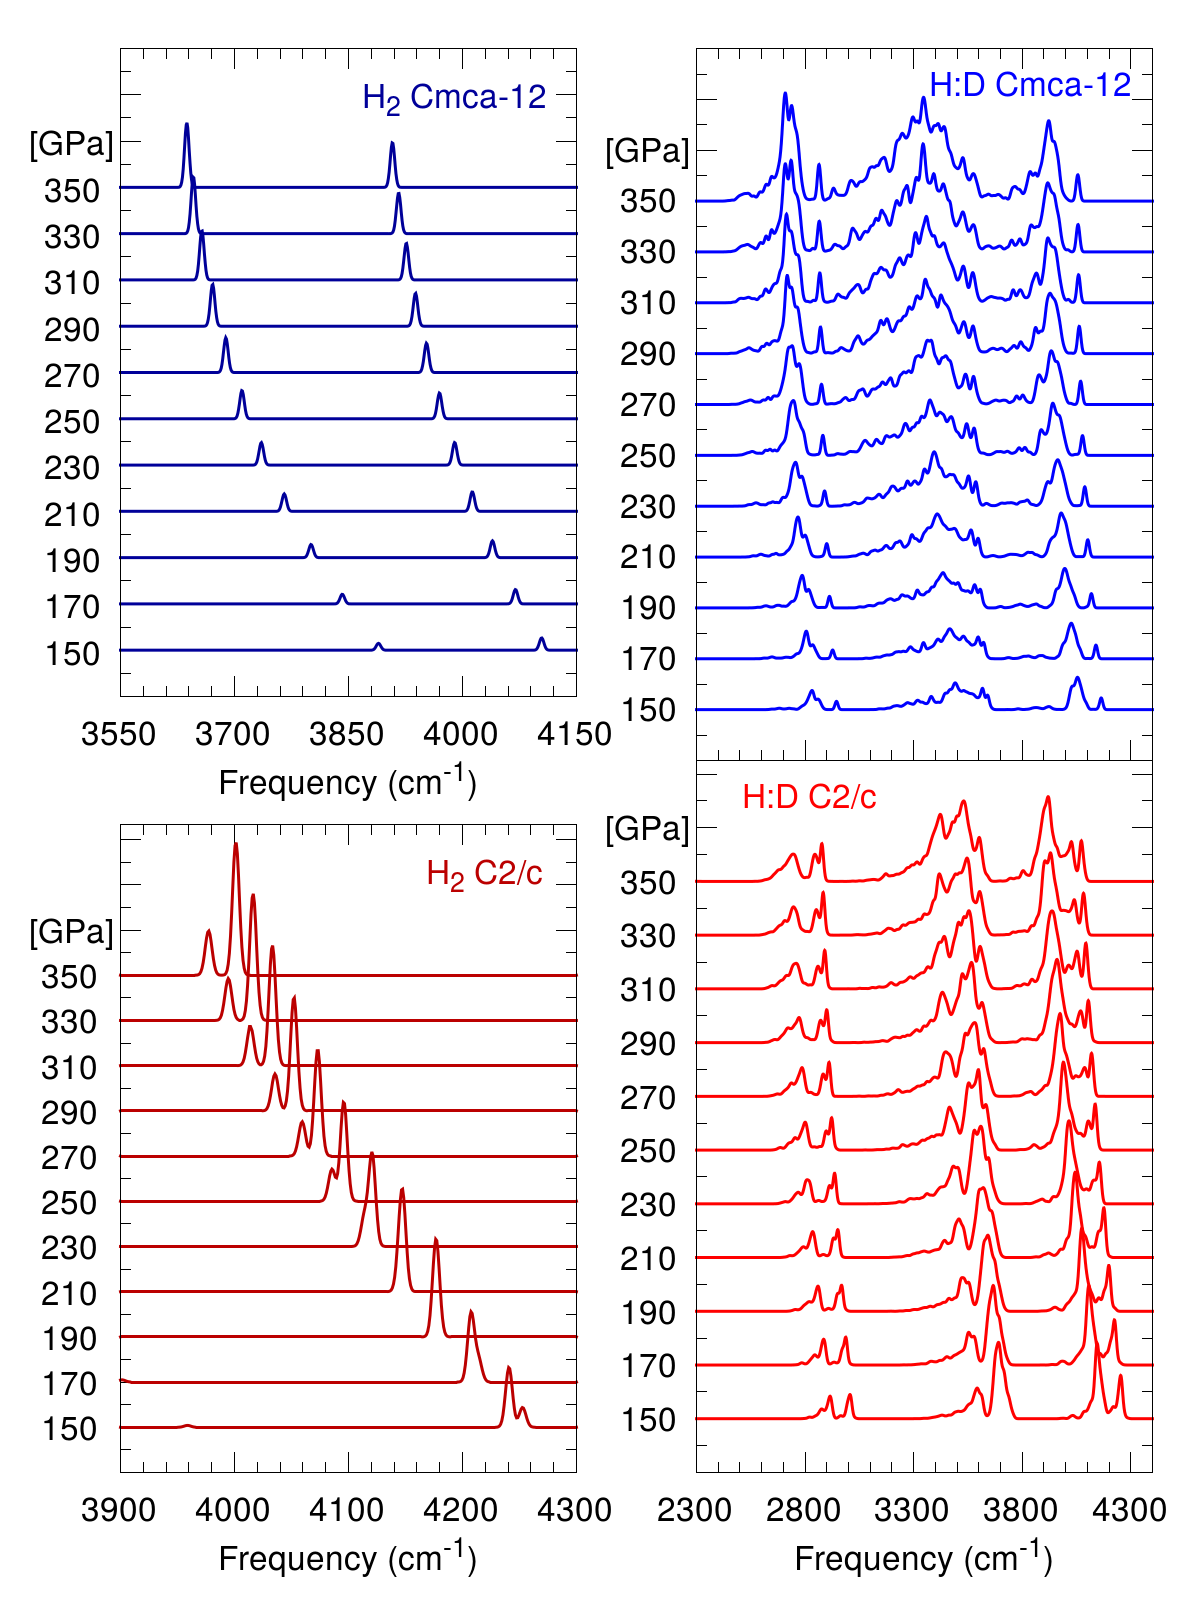
has two strongly IR-active vibron modes for pure hydrogen, which reduce in frequency with increased pressure. This unusual softening can be traced to the weakening of the covalent bond, which lengthens and loses charge as pressure increases. A cursory inspection of the full pressure dependence for (Fig.3) shows two peaks at the onset of phase III (150 GPa), a single peak in the range 170-230 GPa, and two peaks above 250 GPa. Based only on these results, it would be easy to draw a mistaken conclusion that this peak “splitting” signified a phase transition: but since all calculations are in the same phase this can be ruled out - it is simply the effect of different pressure dependencies of the mode frequencies. To avoid this type of confusion, in this letter we draw a distinction between “peaks” - the spectroscopic observables and “modes” - their calculated cause.
Lattice dynamics in mixtures is considerably more involved than in pure elements, and we have developed sophisticated methods to tackle the problem using extended supercells (See Fig.2SM (.); Howie et al. (2014)). The difficulty arises because the disorder breaks translational symmetry so that crystal momentum, , is no longer a good quantum number and the -point selection rule becomes meaningless. The twofold D/H mass difference is sufficient to cause the vibron modes to become localized. This broken symmetry confers IR activity on all modes. Comparing Fig.2b and 2c shows that the IR activity of any individual mode in the mixture is much lower than for the -point phonon in . So whereas the pure H2 spectrum has peaks corresponding to a few unique normal modes, the peaks in the mixtures correspond to many different localized modes (c/f Fig.1). The localised modes form three groups based on H2, HD, and D2 vibrations, with each group split further due to different local environments.
Coupling between molecules causes dispersion in vibron energies. Typically, the antisymmetric IR-active modes are shifted to higher frequencies and the symmetric Raman-modes to lower frequencies. In HD mixtures, the coupling is weaker than in pure hydrogen because and have different resonant frequencies. So at an equivalent pressure the dispersion-like effects are smaller. Consequently strongly IR-active -type modes can be expected to have lower frequencies than in pure , while Raman frequencies for the equivalent modes in mixtures will tend to be higher. Because all modes have some IR activity, the peaks are skew with a low-frequency tail.
The H2 IR vibron frequency is sometimes used experimentally to measure pressure. The different dispersion between H2-like peaks in mixtures and pure elements makes this approach unreliable.
In our isotopic mixture calculations, at low pressures, we find that the modes cluster to produce six clear distinct vibron peaks in , two for each molecular species H2, HD and D2. These modes are typically localized on one molecular type (Fig. 1). At higher pressures (above 230 GPa), we find the remarkable result that all the peaks split further, but most notably the HD signal splits into three peaks. The qualitative difference from the pure elements arises from the existence of a finite number of well-defined environments in which the molecule can find itself. This type of splitting is also observed in the -12 structure.
The central result from the calculations is that the different appearance of the IR spectra in isotopic mixtures compared to pure elements is a consequence of mode localization rather the different crystal structures.
We now compare our results to the recent experiments reported by Dias et al. For convenience the main data from that paper are reproduced in the supplemental materials. Consistent with previous studies of pure H2 and D2 and free energy calculation assuming the structure they report the onset of phase III around 150 GPa. The observed IR spectrum (See SMSM (.); Dias et al. (2016) is consistent with our lattice dynamics (Fig.1c) assuming mass scaling appropriate for HD molecules.
At around 200 GPa, Dias et al report a change in the IR spectra with new peaks appearing at frequencies consistent with Phase III of H2 and D2. Each of these peaks is further split, so they label this Phase HD-IV*, while noting that its phase lines are very different to the previously-named Phase IV and IV’.
We presume that this change is associated with the conversion of . The equilibrium state has H and D distributed randomly between molecules, consistent with calculations showing negligible dependence of binding energy on isotope orderingHowie et al. (2014). After the transition from II to III, the HD dissociation might occur by lattice rebonding. Previous molecular dynamics calculations in similar layers of Phase IV have shown that the isotope-disordered equilibrium can be reached by solid-state molecular rebonding effects on the picosecond timescale, albeit at higher temperaturesLiu et al. (2012); Magdău and Ackland (2014), and that the dissociation rate increases exponentially with pressure as the bond weakens.
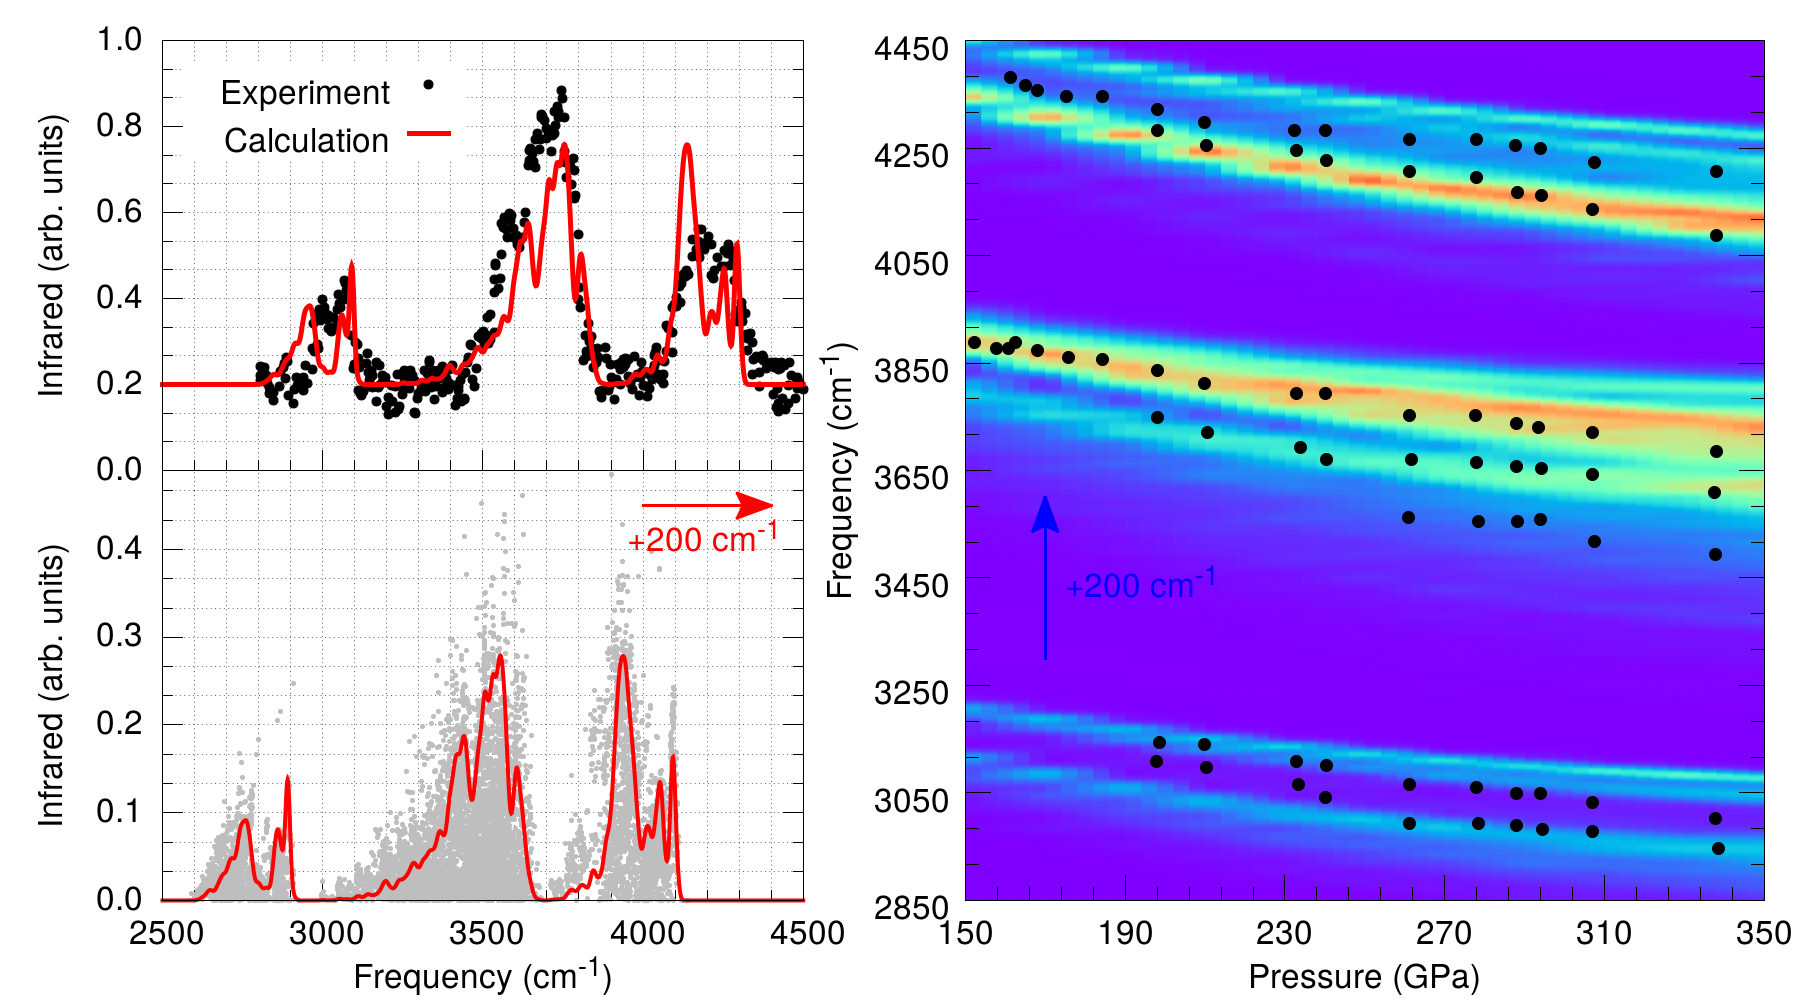
To compare our calculated results with experiment, we calculated phonon frequencies and IR intensities at a range of pressures from 3000 isotopically-disordered samples based on the structure. In Fig.4 we compare experimental data points Dias et al. (2016) and calculations without making any assumption about the number of peaks in either case. Our calculations of mixtures in the phase produce peak splitting in excellent agreement with this data: is significantly worse. Similar analysis has been done across a range of pressures, and by tracing the evolution it is possible to pick out persistent features. Unlike the phonons of pure hydrogen, these peaks all have similar pressure dependence. This surprising result can be traced back to the localisation of the modes, and the splitting being due to the nearby environment rather than the long range symmetry. As pressure increases stronger coupling between molecules both broadens the splitting and equalises the IR activity of the modes, making it possible to resolve the distinct local environments as seen in the HD-PRE phase. The important point is that the improved ability of resolve multiple peaks with increasing pressure does not correspond to a breaking of symmetry or to a structural phase transition.
Thus we propose that observed phases III, IV* and HD-PRE, all have the same crystal structure, probably Pickard et al. (2012) or a closely related structureMonserrat et al. (2016). The observed changes in the IR spectrum are due to isotopic effects rather than structural change. Free-energy calculations imply that III-IV* involves an isostructural equilibration reaction and that only the structure with disordered H and D atoms should appear on the equilibrium phase diagram.
As the thermodynamic equilibrium phase IV* is approached, D2 molecules form and a peak corresponding to D2 vibrons is observed222we note that the experimental sample had a slight excess of hydrogen over deuterium. The splitting of the IR vibron peaks in IV* is due to different modes and local environments in isotope-disordered , as opposed to the two-layer structure in Phase IV, IV’ and V.
We have shown that due to mode localisation the Raman and Infrared spectra of hydrogen-deuterium mixtures are a lot more complex than those of pure isotopes, even for the same crystal structures. Moreover, under pressure the dispersion of phonon bands increases, such that vibron frequencies move further apart. So our main message is that the observation of different numbers of well-resolved peaks does not necessarily indicate a different crystal structure. This applies both to a single system under pressure, where modes have different pressure dependencies (Fig. 3) and when comparing spectra of disordered mixtures to those with a single molecular type.
These effects are sufficient to explain the multiple peaks observed in recent IR data without recourse to new crystal structuresDias et al. (2016). There is no reason to suppose that the equilibrium phase diagram for hydrogen-deuterium mixtures contains any phases other than those observed in pure hydrogen.
Thanks to the richness of the spectra, spectroscopic measurement with the resolution reported by Dias et al on mixtures provides important data which cannot be obtained from pure H2 or D2. Although spectroscopy does not provide a conclusive crystal structure determination, in combination with calculation can be ruled out and a layered structure such as with molecules arranged close to hcp such as remains a favored candidate for Phase IIIMagdău et al. (2017).
Very recent work reporting cold metallic hydrogen remains controversialDias and Silvera (2017), there is no indication about the crystal structure, or even whether the sample is crystalline. This can be addressed with spectroscopy, but as yet no data is available. When it comes, the resolution is likely to be poor and interpretation difficult, and to relate it to candidate crystal structures it will be essential that it is analysed correctly as we have described. Our work here shows that studies of isotopic mixtures will provide additional information not available from pure hydrogen or deuterium, which will be crucial in finally deciphering how the long-sought Wigner-Huntingdon transition occurs.
Acknowledgements.
We thank E.Gregoryanz, I.Silvera, R. P. Dias, and O Noked for useful discussions about experimental details and providing their raw data. We thank M.Martinez-Canales, C.J.Pickard, B.Monserrat for insightful comments about the calculations. We thank the Archer computing service at EPCC (EPSRC grant K01465X and a studentship). GJA acknowledges support from the ERC fellowship “Hecate” and a Royal Society Wolfson fellowship.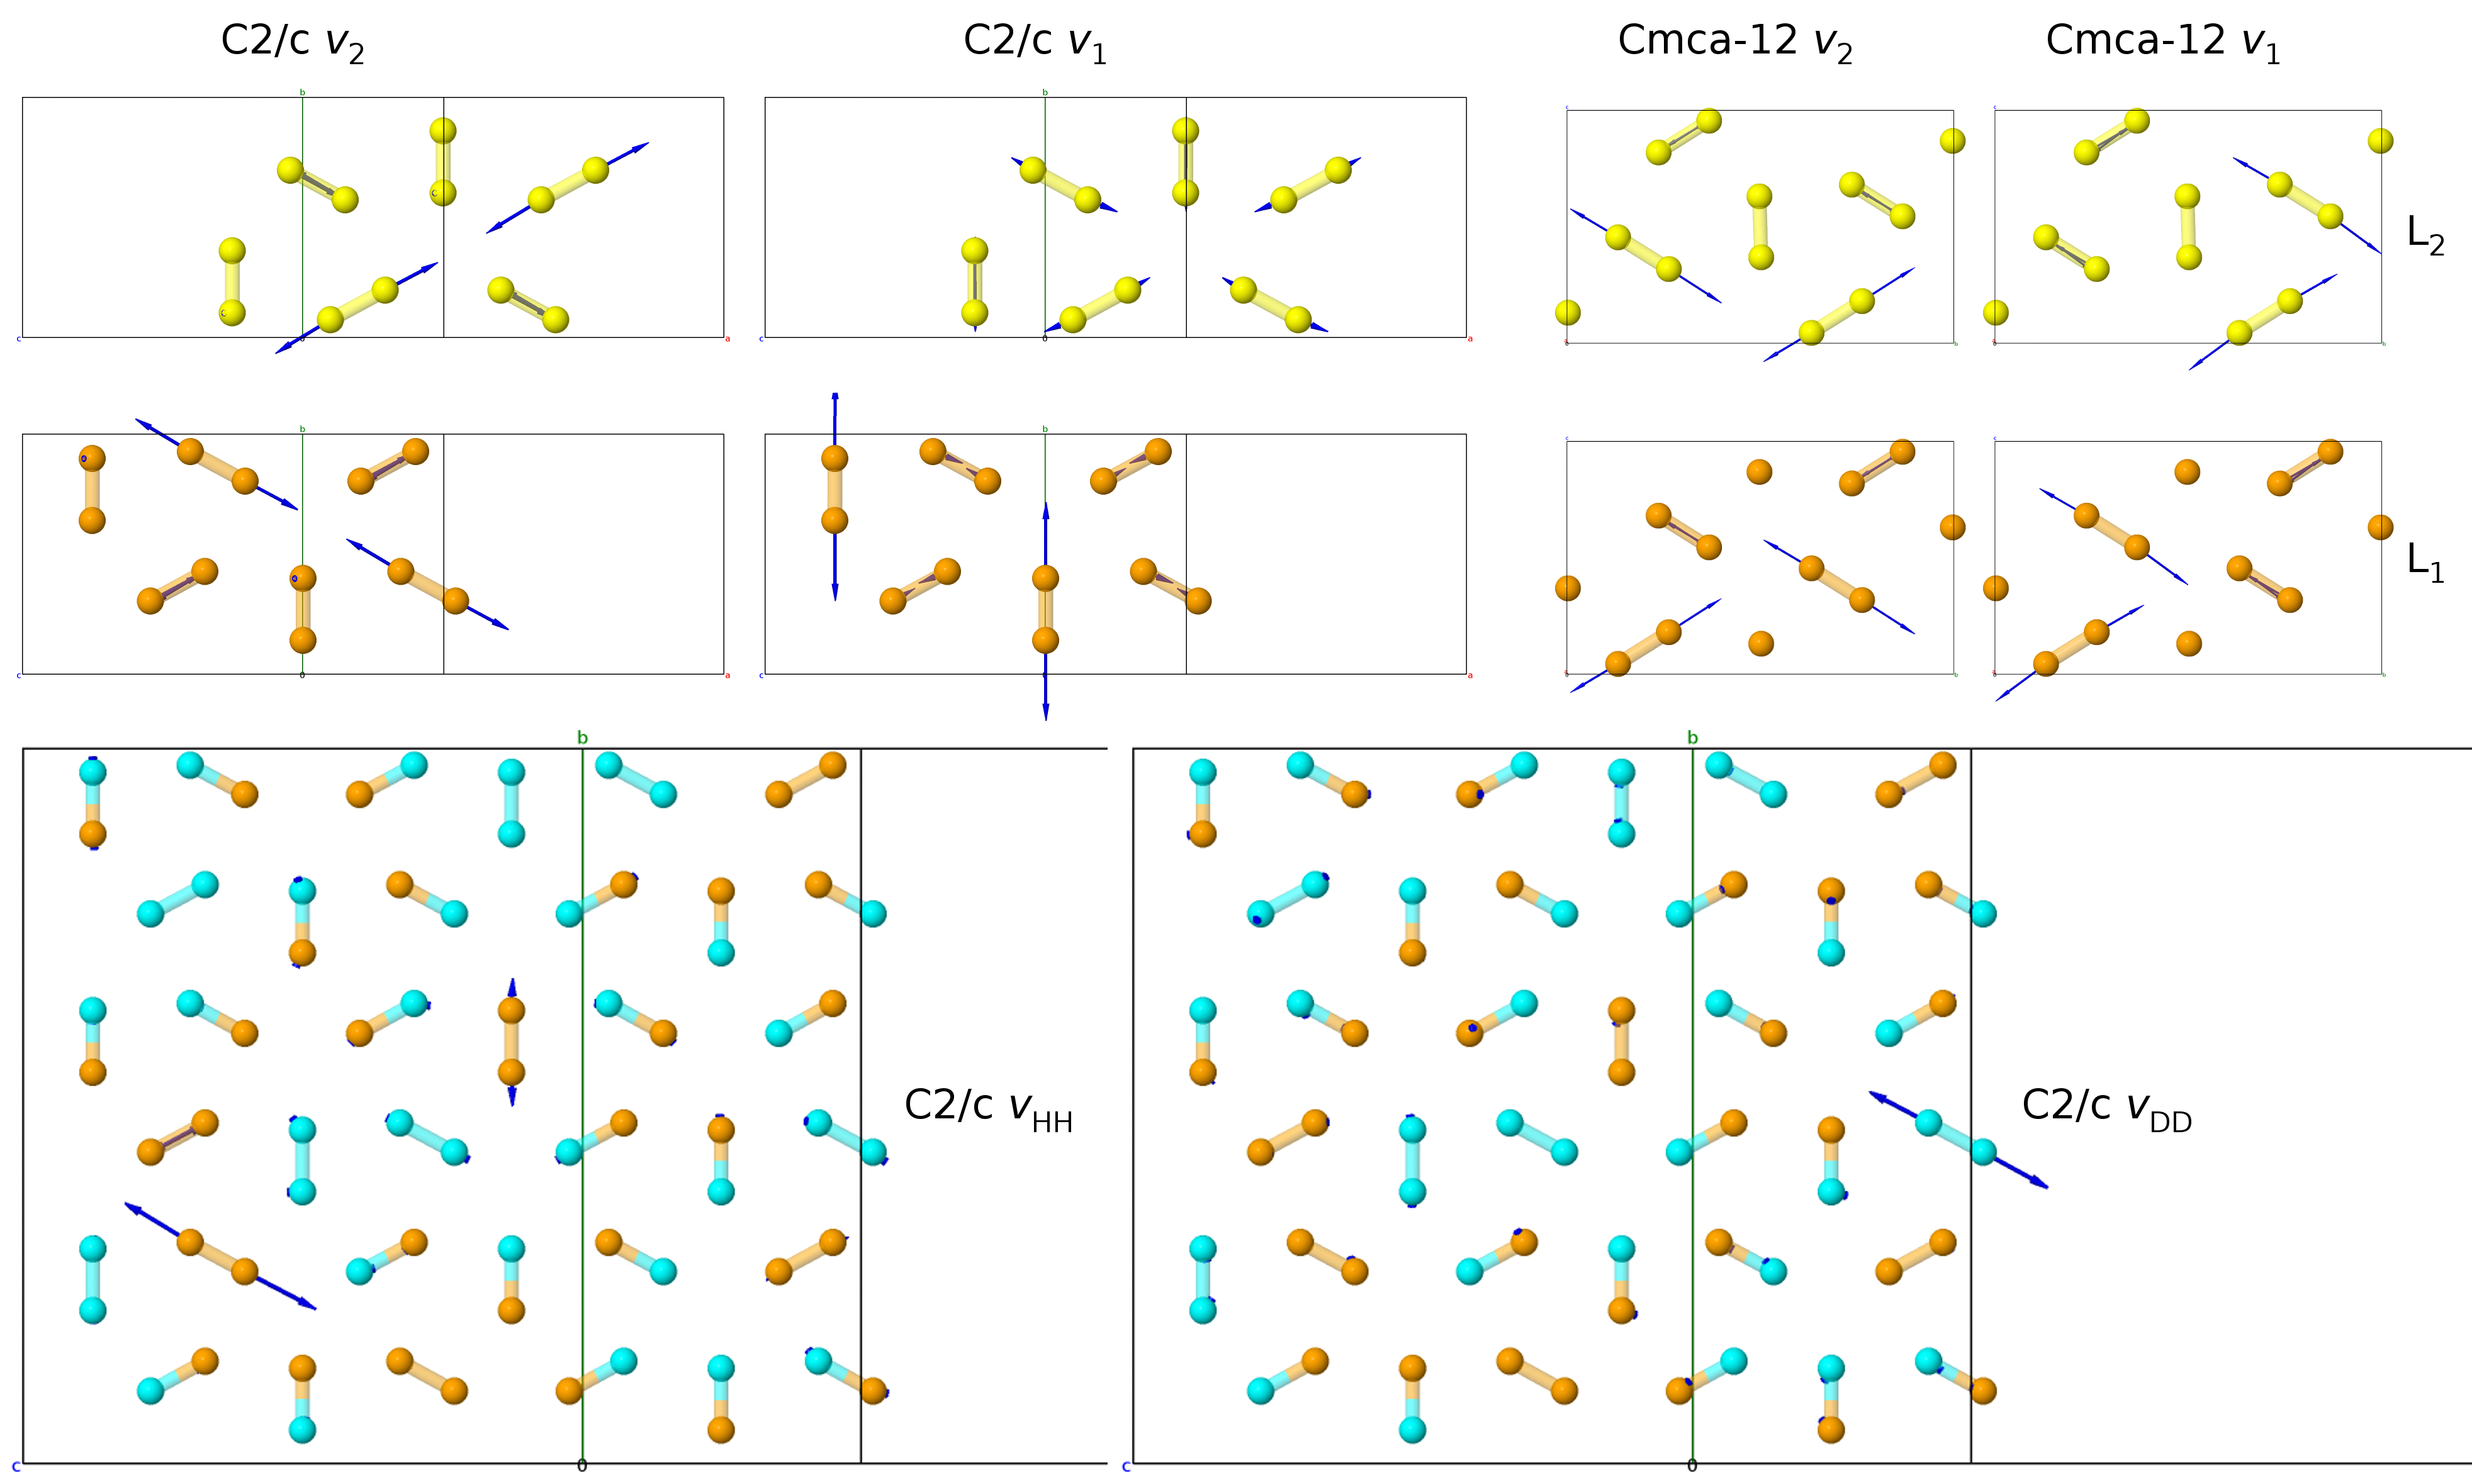
References
- Dias et al. (2016) R. P. Dias, O. Noked, and I. F. Silvera, Phys.Rev.Letters 116, 145501 (2016).
- Dalladay-Simpson et al. (2016) P. Dalladay-Simpson, R. T. Howie, and E. Gregoryanz, Nature 529, 63 (2016).
- Howie et al. (2015) R. T. Howie, P. Dalladay-Simpson, and E. Gregoryanz, Nature materials 14, 495 (2015).
- Howie et al. (2014) R. T. Howie, I. B. Magdău, A. F. Goncharov, G. J. Ackland, and E. Gregoryanz, Phys. Rev. Letters 113, 175501 (2014).
- Eremets et al. (2016) M. Eremets, I. Troyan, and A. Drozdov, arXiv preprint arXiv:1601.04479 (2016).
- Dias and Silvera (2017) R. P. Dias and I. F. Silvera, Science 355, 715 (2017).
- Ackland and Magdău (2015) G. J. Ackland and I. B. Magdău, Cogent Physics 2, 1049477 (2015).
- McMinis et al. (2015) J. McMinis, R. C. Clay III, D. Lee, and M. A. Morales, Phys.Rev.Letters 114, 105305 (2015).
- Drummond et al. (2015) N. D. Drummond, B. Monserrat, J. H. Lloyd-Williams, P. L. Ríos, C. J. Pickard, and R. J. Needs, Nature communications 6 (2015).
- Akahama and Kawamura (2010) Y. Akahama and H. Kawamura, J. Phys.: Conf. Ser. 215, 012195 (2010).
- Anderson (1958) P. W. Anderson, Phys. Rev. 109, 1492 (1958).
- Monthus and Garel (2010) C. Monthus and T. Garel, Phys. Rev. B 81, 224208 (2010).
- Hemley and Mao (1988) R. J. Hemley and H. K. Mao, Phys.Rev.Letters 61, 857 (1988).
- Lorenzana et al. (1989) H. E. Lorenzana, I. F. Silvera, and K. A. Goettel, Phys.Rev.Letters 63, 2080 (1989).
- Goncharov et al. (2001) A. F. Goncharov, E. Gregoryanz, R. J. Hemley, and H.-K. Mao, Proceedings of the National Academy of Sciences 98, 14234 (2001).
- Loubeyre et al. (2002) P. Loubeyre, F. Occelli, and R. LeToullec, Nature 416, 613 (2002).
- Zha et al. (2012) C. S. Zha, Z. Liu, and R. J. Hemley, Phys. Rev. Letters 108, 146402 (2012).
- Goncharov et al. (2013) A. F. Goncharov, R. T. Howie, and E. Gregoryanz, Low Temperature Physics 39, 402 (2013).
- Clark et al. (2005) S. J. Clark, M. D. Segall, C. J. Pickard, P. J. Hasnip, M. I. Probert, K. Refson, and M. C. Payne, Zeitschrift für Kristallographie-Crystalline Materials 220, 567 (2005).
- Perdew et al. (1996) J. P. Perdew, K. Burke, and M. Ernzerhof, Phys.Rev.Letters 77, 3865 (1996).
- Pickard and Needs (2007) C. J. Pickard and R. J. Needs, Nature Physics 3, 473 (2007).
- Pickard et al. (2012) C. J. Pickard, M. Martinez-Canales, and R. J. Needs, Phys. Rev. B 85, 214114 (2012).
- Lebègue et al. (2012) S. Lebègue, C. M. Araujo, D. Y. Kim, M. Ramzan, H.-K. Mao, and R. Ahuja, Proceedings of the National Academy of Sciences 109, 9766 (2012).
- Magdău and Ackland (2013) I. B. Magdău and G. J. Ackland, Phys. Rev. B 87, 174110 (2013).
- Monserrat et al. (2016) B. Monserrat, R. J. Needs, E. Gregoryanz, and C. J. Pickard, Physical Review B 94, 134101 (2016).
- Magdău et al. (2017) I. B. Magdău, M. Marques, F. Balm, and G. J. Ackland, Phys.Rev.B in press (2017).
- SM (.) Supplemental Materials (.).
- Liu et al. (2012) H. Liu, L. Zhu, W. Cui, and Y. Ma, J.Chem.Physics 137, 074501 (2012).
- Magdău and Ackland (2014) I. Magdău and G. J. Ackland, 500, 032012 (2014).
- Azadi and Foulkes (2013) S. Azadi and W. M. C. Foulkes, Phys. Rev. B 88, 014115 (2013).
- Rohatgi (2011) A. Rohatgi, URL http:// arohatgi.info/ WebPlotDigitizer/ app (2011).