Molecular Gas Kinematics and Line Diagnostics in Early-type Galaxies: NGC 4710 & NGC 5866
Abstract
We present interferometric observations of CO lines (12CO(1-0, 2-1) and 13CO(1-0, 2-1)) and dense gas tracers (HCN(1-0), HCO+(1-0), HNC(1-0) and HNCO(4-3)) in two nearby edge-on barred lenticular galaxies, NGC 4710 and NGC 5866, with most of the gas concentrated in a nuclear disc and an inner ring in each galaxy. We probe the physical conditions of a two-component molecular interstellar medium in each galaxy and each kinematic component by using molecular line ratio diagnostics in three complementary ways. First, we measure the ratios of the position-velocity diagrams of different lines, second we measure the ratios of each kinematic component’s integrated line intensities as a function of projected position, and third we model these line ratios using a non-local thermodynamic equilibrium radiative transfer code. Overall, the nuclear discs appear to have a tenuous molecular gas component that is hotter, optically thinner and with a larger dense gas fraction than that in the inner rings, suggesting more dense clumps immersed in a hotter more diffuse molecular medium. This is consistent with evidence that the physical conditions in the nuclear discs are similar to those in photo-dissociation regions. A similar picture emerges when comparing the observed molecular line ratios with those of other galaxy types. The physical conditions of the molecular gas in the nuclear discs of NGC 4710 and NGC 5866 thus appear intermediate between those of spiral galaxies and starbursts, while the star formation in their inner rings is even milder.
keywords:
galaxies: lenticulars - galaxies: individual: NGC 4710 and NGC 5866 - galaxies: ISM - ISM: molecules1 Introduction
Molecular clouds are the stellar nurseries of galaxies, and probing their physical properties in different galaxy types has the potential to answer many important open questions regarding star formation processes and galaxy evolution. Actively star-forming spiral galaxies, including our own Milky Way, are rich in cold gas and their molecular gas reservoirs have been studied for many years. However, since so-called ’red and dead’ early-type galaxies (ETGs; lenticulars and ellipticals) are generally thought to be very poor in molecular gas, star formation within them is thought to have largely stopped. Nevertheless, roughly years after the first detection of molecular gas in external spiral galaxies (Rickard et al., 1975; Solomon & de Zafra, 1975), different phases of the interstellar medium (ISM) of ETGs were also studied, through observations of X-rays (e.g. Forman et al., 1985), optical emission lines (e.g. Caldwell, 1984), H I (e.g. Knapp et al., 1985) and CO (e.g. Wiklind & Rydbeck, 1986; Welch & Sage, 2003; Sage et al., 2007).
Young et al. (2011) carried out the most extensive survey of molecular gas (12CO(1-0)) in ETGs so far, in the galaxies of the volume-limited ATLAS3D sample111http://www-astro.physics.ox.ac.uk/atlas3d/ (Cappellari et al., 2011). They obtained a detection rate, with H2 masses ranging from to . The CO-rich ETGs in the ATLAS3D sample were further studied to probe the molecular gas properties in more details. Interferometric observations of 12CO(1-0) in objects were presented in Alatalo et al. (2013), revealing a variety of CO morphologies (discs, rings, bars, and spiral arms), with sizes smaller than in spirals in absolute terms but similar when compared to their optical extent (Davis et al., 2013a). The molecular gas kinematics is generally regular (Davis et al., 2013a), allowing one to easily probe the Tully-Fisher (luminosity-rotational velocity; Tully & Fisher 1977) relation of ETGs (Davis et al., 2011b). However, gas-star kinematic misalignments indicate that the molecular gas has an external origin in at least one third of the systems, with significant field–cluster environmental differences (Davis et al., 2011a).
The molecular gas can also be used to study the physical conditions (temperature, density, column density, opacity, excitation mechanism, etc) within the dense cold gas of ETGs, where star formation takes place. For example, different transitions of a given molecule are good proxies for the gas temperature (e.g. 12CO(2-1)/CO(1-0)), isotopologues probe the gas optical depth and column density (e.g. 13CO/CO), and complex molecules (e.g. HCN, HCO+, HNC, and HNCO) require much larger critical densities (up to cm-3) to be excited compared to simpler ones (typically cm-3). More subtle effects also exist. HCN and its isotopomer HNC trace respectively the warm-dense and cool-slightly less dense parts of a cloud, while HCO+ traces even more tenuous regions (Huettemeister et al., 1995). HCO+ can also be enhanced in shocks associated with young supernova remnants (SNRs), due to cosmic rays (CRs) in the shocked material (Dickinson et al., 1980; Wootten, 1981; Elitzur, 1983), and is therefore also an important tracer of CR-dominated regions of the ISM. HNCO, on the other hand, is a good tracer of shocked gas (Meier & Turner, 2005, 2012; Rodríguez-Fernández et al., 2010; Ott et al., 2014), and it correlates well with SiO, a well-known shock tracer (Zinchenko et al., 2000).
Focusing on the physical conditions of the ISM through single-dish observations of several 12CO transitions, the 13CO isotopologue, and other molecules, Krips et al. (2010) and later Crocker et al. (2012) (see also Davis et al. 2013b) found that the molecular line ratios of ETGs are generally similar to those of spirals and Seyferts, but different from those of starbursts and (ultra-) luminous infrared galaxies ((U)LIRGs). Interestingly, the line ratios are statistically correlated with several other ISM and stellar properties, e.g. the molecular-to-atomic gas ratio, dust temperature, dust morphology, K-band absolute magnitudes and stellar population age (Crocker et al., 2012). The 13CO(1-0)/CO(1-0) ratio of ETGs also seems to depend on environment (Alatalo et al., 2015).
Here, we conduct interferometric observations of two typical edge-on lenticular galaxies (with large bulges and central dust lanes), NGC 4710 and NGC 5866 (morphological type and , respectively; HyperLEDA222http://leda.univ-lyon1.fr/). Both galaxies are fast rotating and their ionised gas is kinematically-aligned with the stellar kinematics, indicating that the gas is likely supplied by internal processes (e.g. stellar mass loss; Davis et al. 2011a) or is left over from the galaxy formation event itself. NGC 4710 is a member the Virgo Cluster (Kraan-Korteweg, 1982) at a distance of Mpc (Tully, 1988), while NGC 5866 is in a small group including two spirals at a distance of Mpc (Tully, 1988). However, since NGC 4710 is located in the outskirts of the cluster and the distance between NGC 5866 and its nearest companion is rather large, both galaxies are unlikely to have had recent significant interactions with other galaxies or to have been affected by environmental effects. The general properties of the galaxies are listed in Table 1.
NGC 4710 and NGC 5866 also happen to be CO-bright, unusual for supposedly ’red and dead’ systems, allowing the first spatially-resolved study of multiple molecular tracers in an early-type galaxy. We map the entire discs of NGC 4710 and NGC 5866 in common low- CO lines such as 12CO(1-0), 12CO(2-1), 13CO(1-0) and 13CO(2-1), thus probing relatively tenuous molecular gas, as well lines of more complex molecules such as HCN(1-0), HCO+(1-0), HNC(1-0) and HNCO(4-3) (the latter two lines being detected for the first time in those galaxies), thus probing denser gas.
| Galaxy | Property | Value | Reference |
|---|---|---|---|
| NGC 4710 | Type | S03(9) | a |
| RA (J2000) | b | ||
| Dec (J2000) | b | ||
| Distance (Mpc) | c | ||
| d | |||
| SFR22µm ( yr-1) | e | ||
| Vsys (km s-1) | f | ||
| Major diameter | c | ||
| Minor diameter | c | ||
| Position angle | g | ||
| Inclination | h | ||
| NGC 5866 | Type | S03(8) | a |
| RA (J2000) | b | ||
| Dec (J2000) | b | ||
| Distance (Mpc) | c | ||
| f | |||
| SFR22µm ( yr-1) | e | ||
| Vsys (km s-1) | f | ||
| Major diameter | c | ||
| Minor diameter | c | ||
| Position angle | g | ||
| Inclination | h |
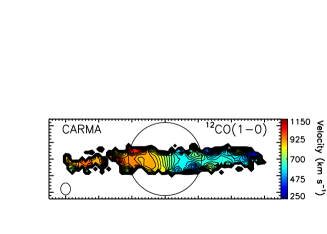
The most abundant tracers reveal an X-shaped position-velocity diagram (PVD) in both galaxies, indicating the presence of an edge-on barred disc (see Bureau & Athanassoula, 1999; Athanassoula & Bureau, 1999; Bureau & Freeman, 1999), with gas concentrated in a nuclear disc within the inner Lindblad resonance and in an inner ring around the end of the bar (corotation) and possibly farther out. Infrared observations also support a nuclear disc surrounded by a ring-like structure in the disc of NGC 5866. Indeed, Xilouris et al. (2004) found that the and emission in NGC 5866 peaks in the centre and at kpc on either side of it (see their Fig. 10). The barred nature of NGC 4710 is consistent with its box/peanut-shaped bulge, but that of NGC 5866 is more surprising given its classical bulge. Should the ring-like structure in NGC 5866 have a different origin, however, the barred nature of NGC 5866 would have to be revisited. Nevertheless, we discuss our empirical and model results in light of these facts throughout.
The first goal of our study is thus to exploit the variations of the molecular line ratios along the galaxy discs (as a function of projected radius and velocity), to study the physical properties of the molecular gas in each of those two dynamical components independently (i.e. nuclear disc and inner ring). We also do this quantitatively by modeling the molecular line ratios with a non-local thermodynamic equilibrium (non-LTE) code (RADEX; van der Tak et al. 2007). A secondary goal is to compare the star formation activity in ETGs to that in other types of galaxies. For this, the observed line ratios are compared with those at the centre of spirals, starbursts, Seyferts and other lenticulars, as well as with those of some giant molecular clouds (GMCs) in the spiral arms and inter-arm regions of nearby galaxies (Sorai et al., 2002; Brouillet et al., 2005; Baan et al., 2008; Krips et al., 2010; Crocker et al., 2012).
The paper is divided as follows. Section 2 describes the observations and data reduction, while § 3 presents the results and a basic analysis of the data. We discuss the line ratio diagnostics in § 4, both empirically and through modelling, the latter detailed in Appendix B. A detailed discussion is presented in § 5 and we conclude briefly in § 6.
2 Observations & Data Reduction
2.1 Observations
2.1.1 NGC 4710
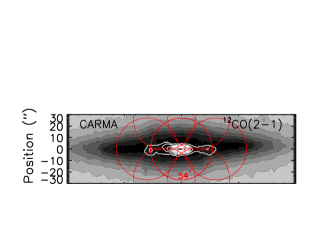
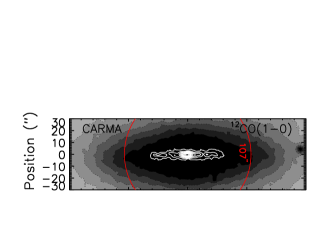
NGC 4710 was primarily observed using the Combined Array for Research in Milimeter-wave Astronomy (CARMA), which includes antennae ( m, m) and thus baselines. The 12CO(1-0) and 13CO(1-0) observations were carried out in April 2009, with spectral windows per line ( MHz or km s-1 bandwidth, with MHz or km s-1 channels), in the D configuration (maximum baseline of m, yielding a synthesized beam and thus angular resolution of at GHz). The CO(2-1) observations were carried out in January 2011, with spectral windows per line ( MHz or km s-1 bandwidth, with MHz or km s-1 channels), using the E configuration (maximum baseline of m, yielding a resolution of at GHz). The 12CO(2-1) and 13CO(2-1) observations were obtained with a mosaic of pointings, a central pointing surrounded by pointings in an hexagonal pattern (see Fig. 1). Simultaneous observations of HCN(1-0), HCO+(1-0), HNC(1-0) and HNCO(4-3) were obtained in October 2011. For each of HCN(1-0) and HCO+(1-0), spectral windows per line were used ( MHz or km s-1 bandwidth, with MHz or km s-1 channels), using the D configuration (yielding an average resolution of for these lines). Observations of HNC(1-0) and HNCO(4-3) used a single spectral window for each line ( MHz or km s-1 bandwidth, with MHz or km s-1 channels). All the lines except HNCO(4-3) were detected with a signal-to-noise ratio .
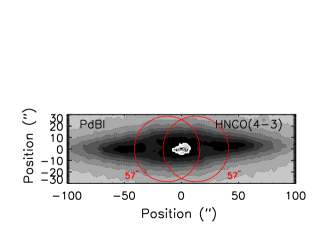
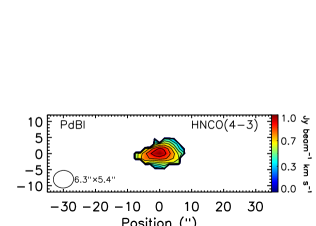
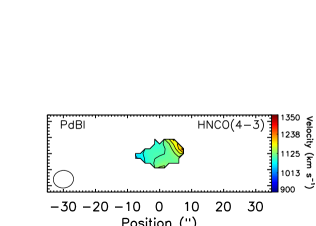
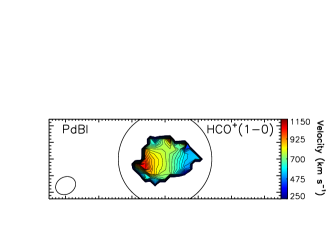
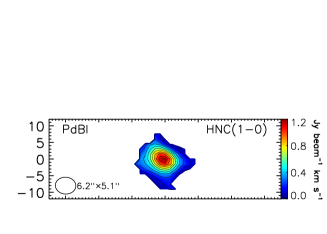
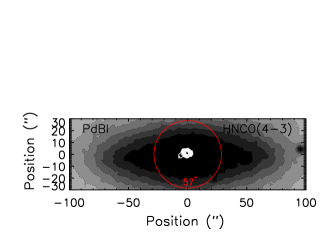
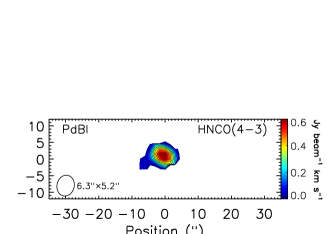
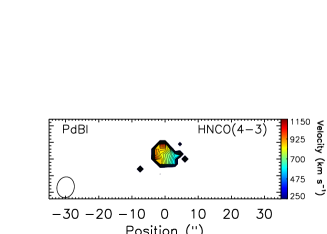
All four dense gas tracers, namely HCN(1-0), HCO+(1-0), HNC(1-0) and HNCO(4-3), were also observed using the Institut de Radio Astronomie Millimetrique (IRAM) Plateau de Bure Interferometer (PdBI), with six m antennae and thus baselines in the 6ant-Special configuration (yielding an average resolution of for these lines). A GHz or km s-1 bandwidth with a spectral resolution of MHz or km s-1 was used. The observations of the dense gas tracers were obtained with a mosaic of pointings, centred at offsets (, ) and (, ) with respect to the galaxy centre (and thus along the galaxy major axis; see Fig. 1).
At the distance of NGC 4710, corresponds to pc. The resolution of the CARMA observations thus corresponds to a linear scale of and pc for the tenuous (CO) and dense gas tracers, respectively, while that of the PdBI observations corresponds to pc. The main observational parameters for NGC 4710 are listed in Table 2.
| Galaxy | Transition | Rest Freq. | Obs. Date | Total Obs. Time | Interferometer | Beam | Conversion factor | Noise |
| (GHz) | (hours) | (arcsec) | (K Jy-1 beam) | (mJy beam-1) | ||||
| NGC4710 | 12CO(1-0) | APR | 6.42 | CARMA | ||||
| 13CO(1-0) | ||||||||
| 12CO(2-1) | JAN | CARMA | ||||||
| 13CO(2-1) | ||||||||
| HCN(1-0) | OCT | CARMA | ||||||
| HCO+(1-0) | ||||||||
| HNC(1-0) | ||||||||
| HCN(1-0) | NOV 2011, JAN | PdBI | ||||||
| HCO+(1-0) | ||||||||
| HNC(1-0) | ||||||||
| HNCO(4-3) | ||||||||
| NGC 5866 | 12CO(1-0) | AUG | CARMA | |||||
| 13CO(1-0) | APR & MAY | PdBI | ||||||
| HCN(1-0) | MAY | PdBI | ||||||
| HCO+(1-0) | ||||||||
| HNC(1-0) | ||||||||
| HNCO(4-3) |
2.1.2 NGC 5866
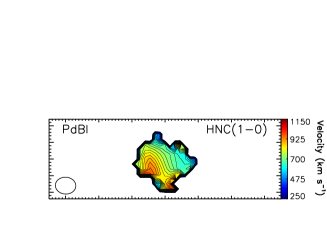
NGC 5866 was primarily observed with PdBI. Observations of 13CO(1-0) and the dense gas tracers HCN(1-0), HCO+(1-0), HNC(1-0) and HNCO(4-3), were carried out using the 6Dq configuration during April–May 2011, yielding a resolution of at GHz and for the dense gas tracers. The total bandwidth was GHz or km s-1, with a spectral resolution of MHz or km s-1. 12CO(1-0) observations were obtained at CARMA in the D configuration, yielding a resolution of at GHz. Three spectral windows were used ( MHz or km s-1 bandwidth, with a spectral resolution of MHz or km s-1)
At the distance of NGC 5866, corresponds to pc. The resolution of the PdBI observations thus corresponds to a linear scale of and pc for 13CO(1-0) and the dense gas tracers, respectively, while that of the CARMA observations corresponds to pc. The main observational parameters for NGC 5866 are listed in Table 2.
2.2 Data reduction
2.2.1 CARMA data reduction
The CARMA data were reduced using the Multichannel Image Reconstruction, Image Analysis and Display (MIRIAD) package (Sault et al., 1995). First, for each track, initial data corrections were applied (i.e. line-length calibration, baseline and rest frequency corrections). The temporal behaviour of the phase calibrator was then checked to flag de-correlations when necessary. Second, the bandpass and phase calibrations were performed using a bright calibrator, usually a quasar within of the source (3C273, 1224+213 or 1419+513). The gain solutions were then derived and applied to the source. Flux calibration was carried out using the latest calibrator flux catalog maintained at CARMA (typically using a planet). After successfully calibrating the source data for each track and each observed line, all data for a given line were combined into one visibility file and imaged using the MIRIAD task invert. As CARMA is a heterogeneous array, invert was run with the mosaicking option, to take into account the different primary beams. All data cubes were created with a pixel size of and for the CO lines and dense gas tracers, respectively, typically yielding pixels across the synthesized beam major axis. The dirty cubes were cleaned to a threshold equal to the rms noise of the dirty channels in regions devoid of emission. The cleaned components were then added back and re-convolved using a Gaussian beam of full-width at half-maximum (FWHM) equal to that of the dirty beam. A fully calibrated and reduced data cube was thus obtained for each molecular line.
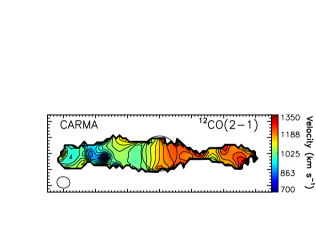
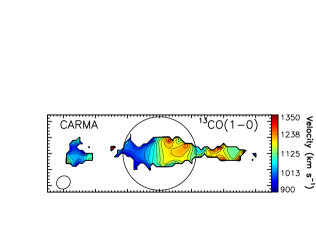
We note that to simplify the discussion, the fully-calibrated and cleaned data cubes were rotated using the MIRIAD task regrid with the keyword rotate and the molecular gas position angle (see Table 1), so that the emission (galaxy major-axis) is horizontal. The data presented in Figures 1 and 2 therefore do not represent the true orientation of the galaxies on the sky.
2.2.2 PdBI data reduction
The PdBI data were reduced using the Grenoble Image and Line Analysis System (GILDAS) packages Continuum and Line Interferometer Calibration (CLIC) and MAPPING333http://www.iram.fr/IRAMFR/GILDAS. CLIC was used for the initial data reduction, including the bandpass, phase and flux calibrations, and the creation of the tables. MAPPING was then used to create fully calibrated and cleaned cubes, with the same procedure and pixel sizes as above. Those cubes were then converted into Flexible Image Transport System (FITS) files for further analysis in MIRIAD and Interactive Data Language (IDL) environments.
3 Imaging & Analysis
3.1 Emission regions and moment maps
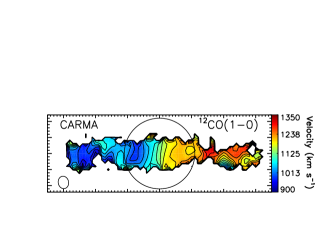
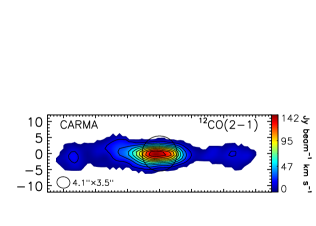
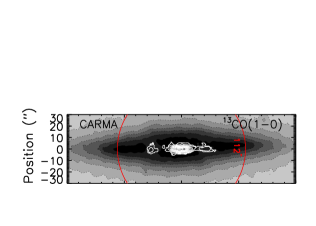
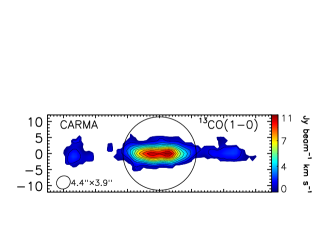
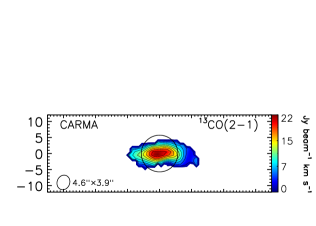
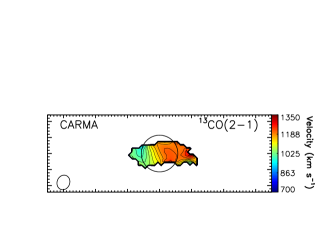
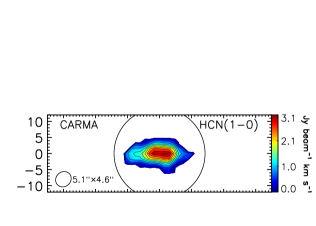
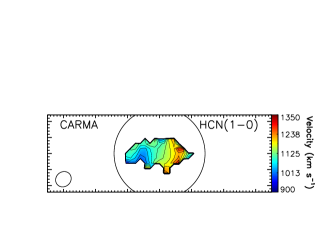
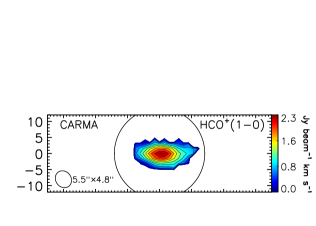
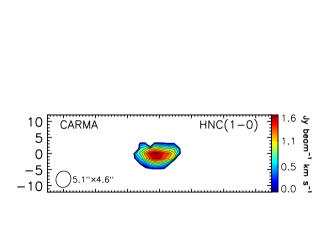
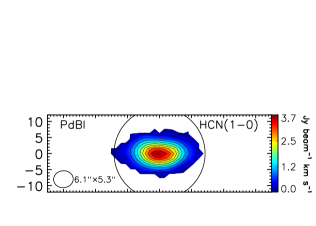
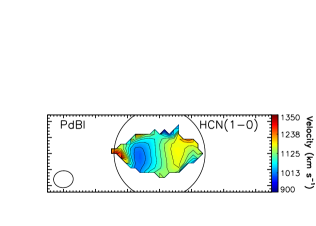
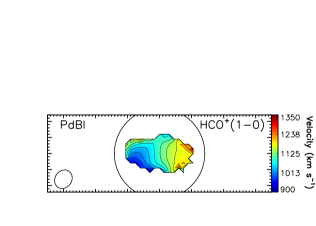
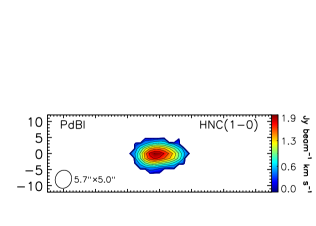
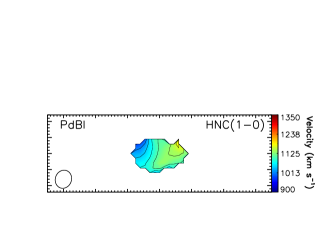
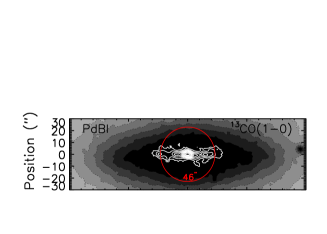
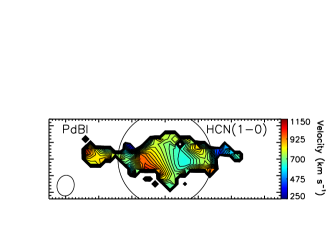
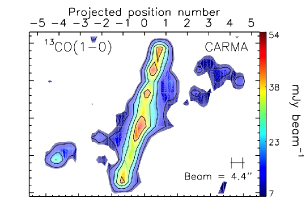
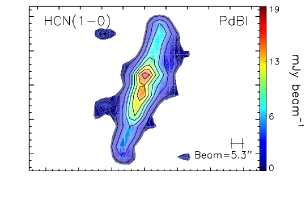
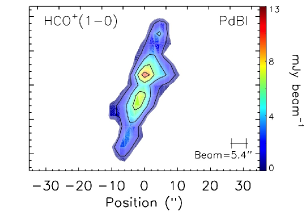
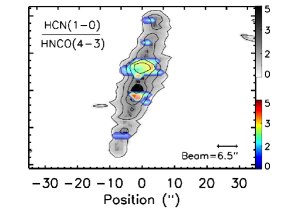
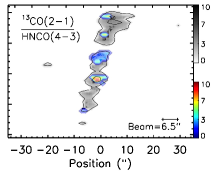
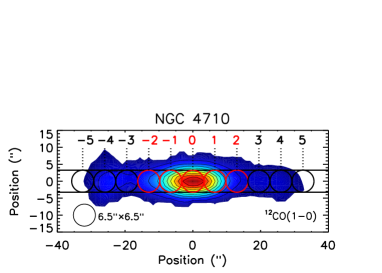
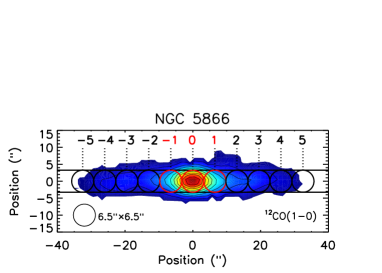
To derive the moment maps of NGC 4710 and NGC 5866, the spatial extent of the emission must first be defined in the fully-calibrated and cleaned cube of each line. The data cubes were therefore first Hanning-smoothed spectrally and Gaussian-smoothed spatially with a FWHM equal to that of the beam. The smoothed cubes were then clipped (in three dimensions) at a threshold (where is the rms noise of the smoothed cube) and (smoothed) moment maps created. Regions of contiguous emission for each line were then defined using the IDL region-growing algorithm label_region and the (smoothed) moment 0 maps. The largest central contiguous emission region for each line was then adopted as a two-dimensional mask, and used to derive the moments of the original (unsmoothed and unclipped) cube in that line. The moment maps are shown in Figures 1 and 2 for all lines.

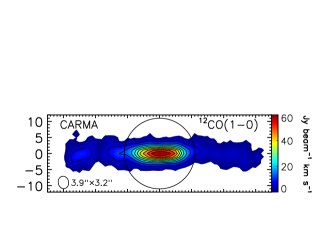


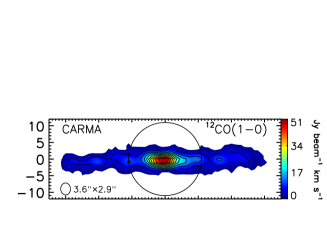
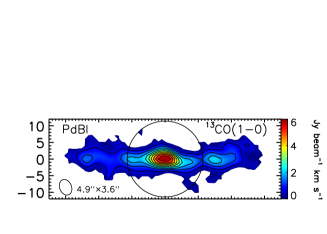
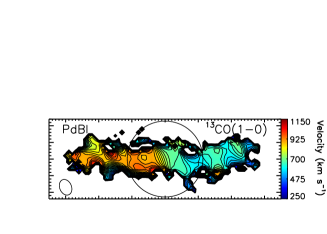


As the 12CO(1-0) is the most spatially extended line in both galaxies, the contiguous emission region for the other lines cannot be more extended than this. Furthermore, as all 12CO(1-0) emission lies along the major axis of the galaxies, we assume that this must be the case for the other lines as well. These two criteria were thus also used to define the real extent of the line emission when this emission is discontinuous, typically in the centre (nuclear disc) and nearly symmetric regions farther along the disc on either side (inner ring edges; see, e.g., the 13CO(1-0) emission in Fig. 1). The rms noise levels listed in Table 2 were calculated using all pixels outside of the identified emission regions in the original cubes.
3.2 Position-velocity diagrams
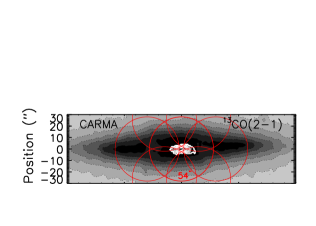
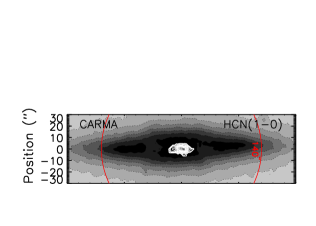
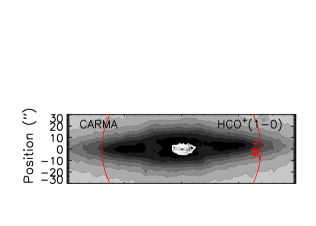
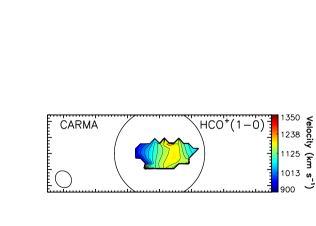
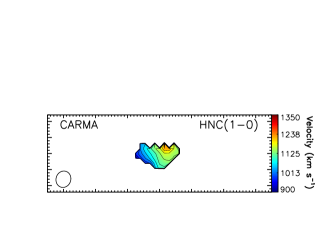
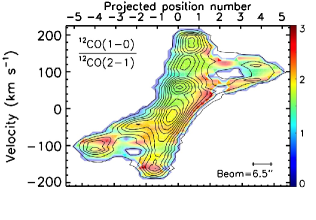
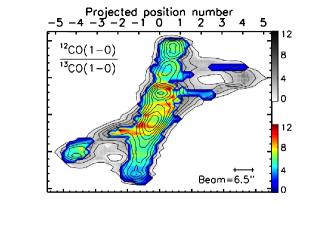
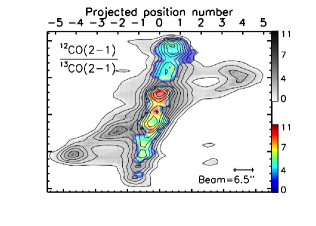
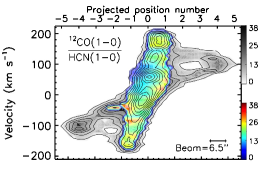
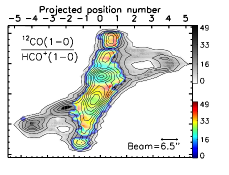
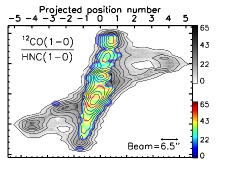
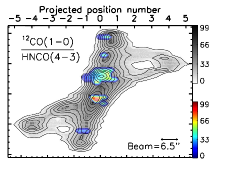
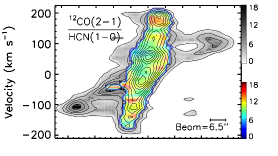
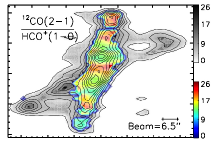
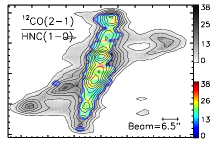
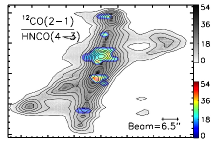
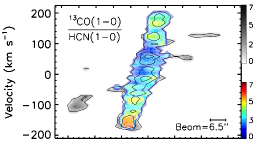
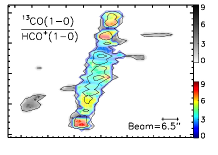
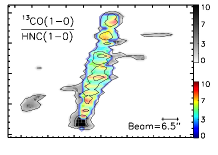
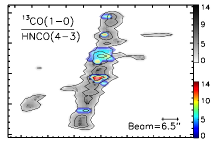
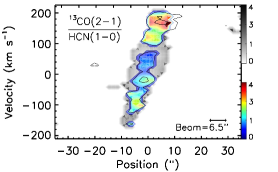
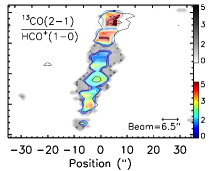
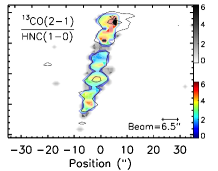
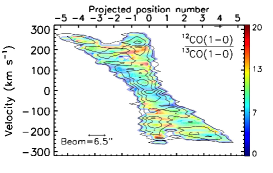
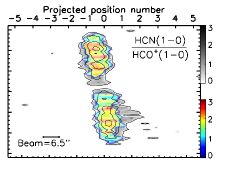
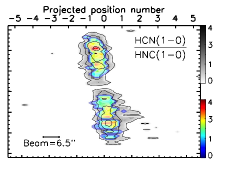
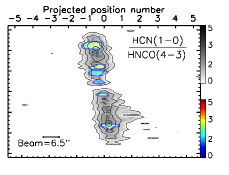
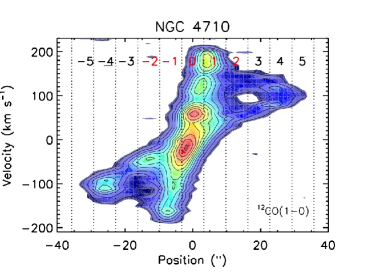
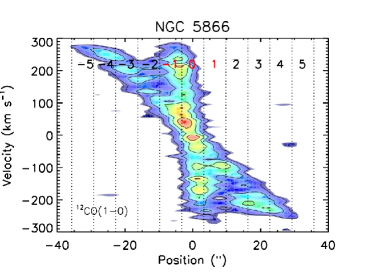
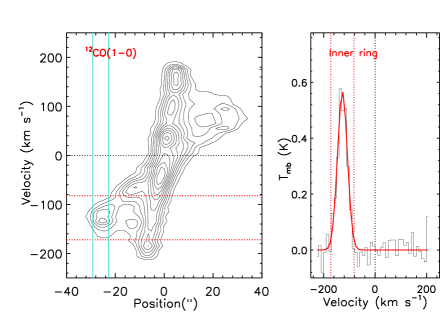
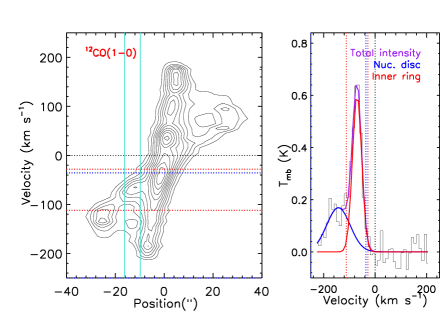
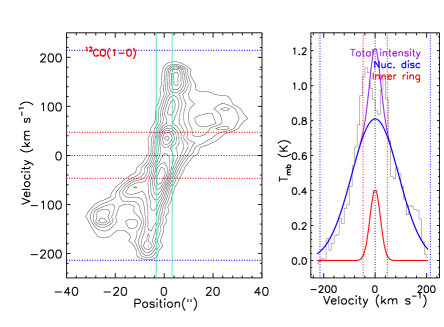
To create a PVD for each molecular line detected, we simply took a slice along the major axis of the galaxies in the fully-calibrated and cleaned data cubes, averaging pixels in the perpendicular direction (i.e. along the galaxy minor axis; slightly larger than the synthesised beam, maximising as the emission is generally not resolved perpendicular to the disc). The PVDs of all the lines detected in NGC 4710 and NGC 5866 are shown in Figures 3 and 4, respectively. The spatial resolution of each PVD, i.e. the size of the beam along the major axis of the galaxy, was calculated by taking into account the position angle, major axis and minor axis of synthesised beam (see Davis et al. 2013a).
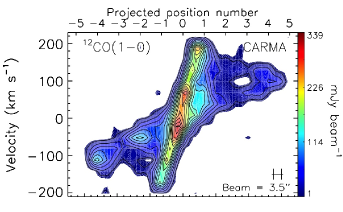
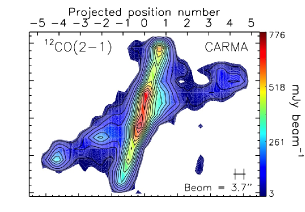
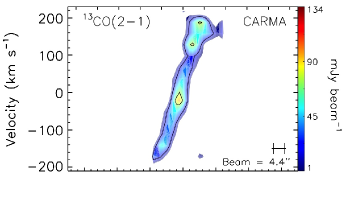
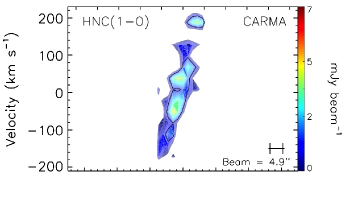
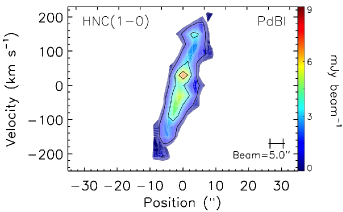
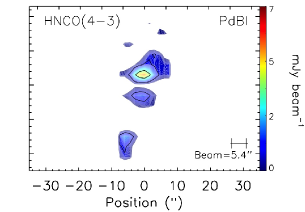
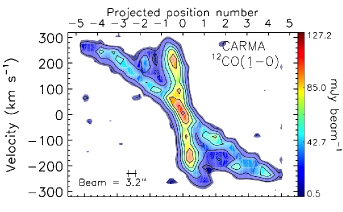
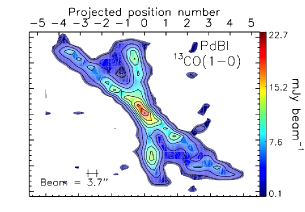
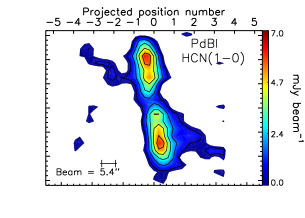
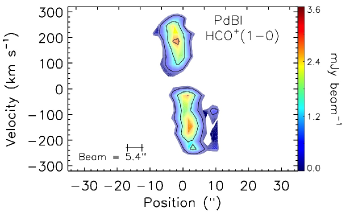
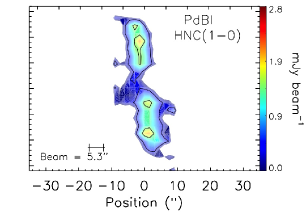
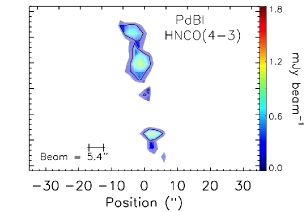
As seen in Figures 3 – 4, the PVDs of the CO lines in both galaxies (except 13CO(2-1) in NGC 4710) and the PVD of HCN(1-0) in NGC 5866 reveal X-shape patterns, with two distinct velocity components: a central rapidly-rising velocity component (hereafter nuclear disc) and an outer slowly-rising velocity component (hereafter inner ring). Both can easily be understood in the context of barred galaxy dynamics (see Sellwood & Wilkinson 1993 for a general review; Bureau & Athanassoula 1999, Athanassoula & Bureau 1999 and Bureau & Freeman 1999 for the observed kinematics of edge-on systems). Bar-driven inflows cause gas to accumulate on orbits (elongated perpendicular to the bar) within the inner Lindblad resonance (ILR; when present) at the centre of the galaxy, creating a feature known as a nuclear disc (or ring), and giving rise to the central rapidly-rising velocity component seen in the PVDs. Gas also accumulates just beyond the end of the bar near corotation (and possibly beyond), creating a feature known as an inner ring, and giving rise to the outer slowly-rising velocity component of the PVDs. The intermediate region occupied by orbits (elongated parallel to the bar) is swept free of gas, creating a gap between the nuclear disc and inner ring (both morphologically and in the PVDs). However, there is some material there, at least in NGC 4710, where the X shape of the 12CO(1-0) PVD resembles a figure of eight at positive projected radii (see position in Fig. 10; less so for other tenuous gas transitions). The emission coming from the intermediate region is less clear at position and since higher S/N emission coming respectively from the central disc and inner ring mostly contributes to the flux at these positions. These three morphological and kinematic features (nuclear disc, inner ring and empty intermediate region) generally constitute reliable bar signatures.
The boxy/peanut-shaped bulge of NGC4710 confirms that it is barred, while the dominant classical bulge of NGC5866 makes the characteristic kinematic bar signatures observed somewhat surprising (see the optical images in Figures 1 and 2). The X-shaped PVD (and thus kinematic bar signature) was first observed in NGC 4710 by Wrobel & Kenney (1992) and in NGC 5866 by Alatalo et al. (2013), both from 12CO(1-0) observations.
3.3 Comparisons with IRAM 30m data
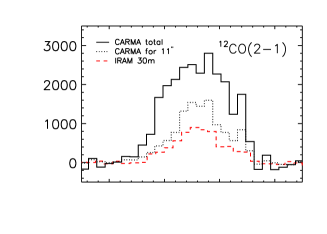
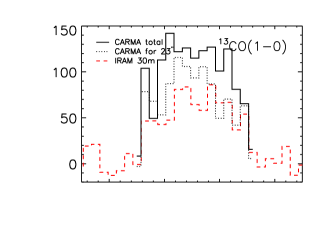
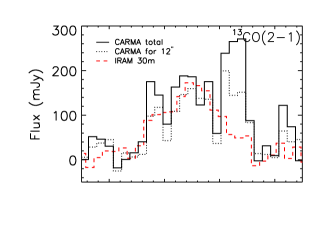
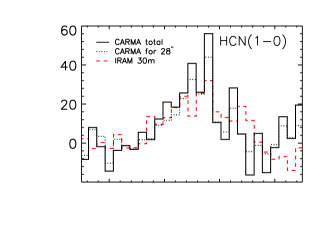
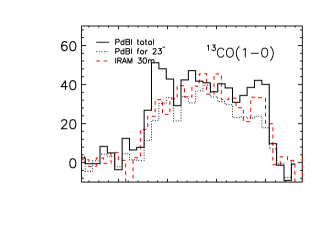
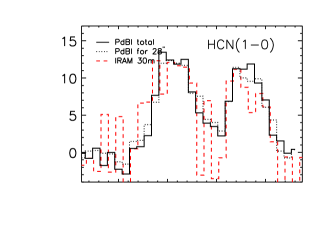
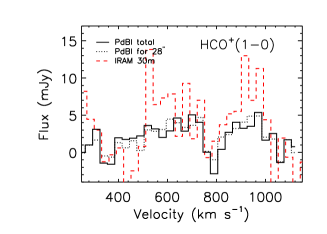
Some lines detected with CARMA and PdBI in this work were also previously detected with the IRAM 30m single-dish telescope. For NGC 4710, the relevant lines are 12CO(1-0), 12CO(2-1) (Young et al., 2011), 13CO(1-0), 13CO(2-1), HCN(1-0) and HCO+(1-0) (Crocker et al., 2012), while those for NGC 5866 are 12CO(1-0) (Welch & Sage, 2003), 13CO(1-0), HCN(1-0) and HCO+(1-0) (Crocker et al., 2012). As the IRAM 30m beam is smaller than the primary beams of CARMA and PdBI at any frequency (see Figs. 1 and 2), CARMA and PdBI are better able to recover the true integrated molecular gas content of the galaxies (as long as the interferometer does not filter out diffuse, extended emission).
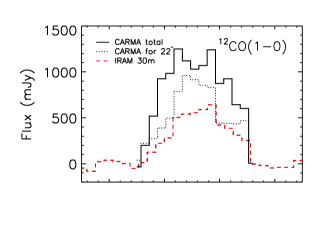
To check the consistency of the datasets from the IRAM 30m single-dish telescope and the interferometers, we simulated IRAM 30m integrated spectra using our CARMA and PdBI interferometric data cubes. To do this, for each line we summed the flux in our cubes spatially using a Gaussian weighting function of FWHM equal to that of the single-dish beam at the given frequency (and centred on the galaxies, thus assuming no 30m pointing error). The IRAM 30m beam size adopted for the 12CO(1-0), 13CO(1-0), 12CO(2-1) and 13CO(2-1) line was , , and , respectively, while that for the HCN(1-0), HCO+(1-0), HNC(1-0) and HNCO(4-3) lines was . When the IRAM 30m fluxes were listed in Kelvin (either antenna temperature or main beam temperature ), we converted the fluxes using the conversion factors given in the associated papers or listed on the IRAM website444http://www.iram.es/IRAMES/mainWiki/Iram30mEfficiencies. For values at frequencies not specified there, we linearly interpolated between the two nearest values.
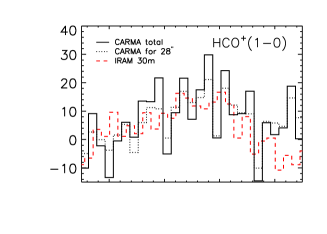
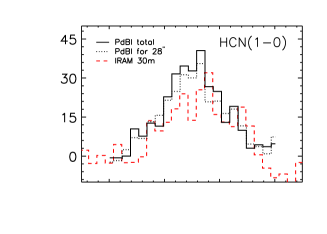
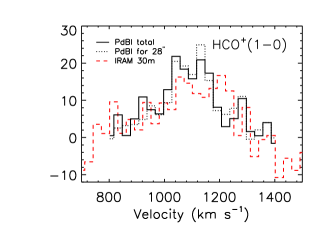
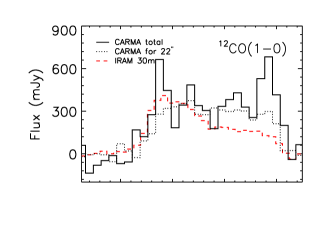
The true IRAM 30m spectra, simulated IRAM 30m spectra and spatially-integrated CARMA and PdBI spectra (the latter without beam weighting applied, thus recovering more flux if the emission extends beyond the 30m beam) are shown in Figure 5 and 6 for NGC 4710 and NGC 5866, respectively (see also § 5.4).


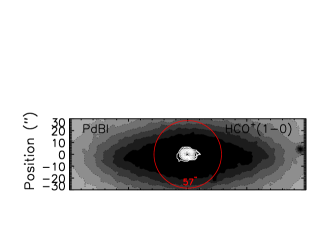
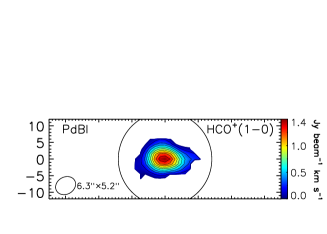
3.4 Continuum emission
NGC 4710 and NGC 5866 do not reveal spatially extended continuum emission, but they do harbour a continuum point source at their respective centre. We thus measured the continuum flux of each galaxy by fitting a point source model in the plane, using only channels free of line emission. To do this, for PdBI data we used the MAPPING task uv_fit, and for CARMA data we used the MIRIAD task uvfit.
In NGC 4710, we found a continuum flux of mJy at GHz and upper limits of and mJy at and GHz, respectively. We were not able to estimate a continuum flux at and GHz, as there is no line free channel, but Alatalo et al. (2013) list a upper limit of mJy at GHz. In NGC 5866, we found a continuum flux of mJy at GHz, mJy at GHz and mJy at GHz.
4 Line ratio diagnostics
Different molecular lines require different physical conditions to be excited, so a multitude of line ratios are required to probe complex media. In this work, we perform three types of line ratio analyses, providing complementary information on the physical conditions of the gas along the disc (major-axis) of NGC 4710 and NGC 5866. First, we analyse direct ratios of the major-axis PVDs (see § 4.1), providing a qualitative view of the physical conditions in both kinematic components of the galaxies (nuclear disc and inner ring). Second, we calculate the ratios of integrated line intensities as a function of projected radius along the galaxy discs, by extracting integrated spectra as a function of projected position for each kinematic component separately (see § 4.2). Third, we model these line ratios using a non-LTE radiative transfer code, thus estimating a number of physical parameters describing a two-component molecular ISM (see § 4.3 and Appendix B).
When the density exceeds a given molecular transition critical density , collisions become the dominant excitation and de-excitation mechanism. In dense clouds, gas excitation is thus dominated by collisions with H2, by far the most abundant species. Low- CO lines, such as 12CO(1-0) and its isotopologue 13CO(1-0), have cm-3, whereas high density tracers, such as HCN(1-0), HCO+(1-0), HNC(1-0) and HNCO(4-3), have critical densities up to cm-3. We note however that when the emitting gas gets optically thick (), radiative-trapping occurs (as some spontaneously-emitted photon are absorbed within the cloud), resulting in a reduction of the critical density by a factor and a higher excitation temperature than that expected due to collisions with H2 only (Scoville, 2013).
In this paper, we separate our line ratios in three different groups, to better probe the physical conditions of different phases of the molecular ISM. The three groups are: i) ratios of low- CO lines only, tracing the temperature, opacity and column density of the relatively tenuous molecular gas; ii) ratios of dense gas tracers only, tracing the density, chemical state and dominant excitation/ionisation mechanisms of the dense molecular gas (e.g. UV and X-ray radiation, stellar winds and supernova explosions); and iii) ratios of CO to dense gas tracers, tracing the dense gas fraction. As our PdBI observations of HCN(1-0), HCO+(1-0), HNC(1-0) and HNCO(4-3) in NGC 4710 are roughly twice as deep as our CARMA observations of the same lines, we will exclusively use the PdBI data of those lines for the line ratio analyses of this galaxy.
4.1 PVD ratios
We start all line ratio analyses by first creating identical data cubes for all molecular lines. These identical cubes have the same number of channels, channel width, start and end velocities, and pixel size. They are also convolved to a common circular beam size of , the largest synthesised beam in our dataset (i.e. the beam of the high density tracers observed at PdBI; see Table 2). The pixel size of these data cubes was chosen to be , yielding pixels across the beam. We then converted our fluxes from Jy beam-1 to Kelvin (K) using the conversion factors calculated by the MIRIAD task imstat (see Table 2), so that by convention and throughout this paper we take the ratio of line intensities expressed in K.
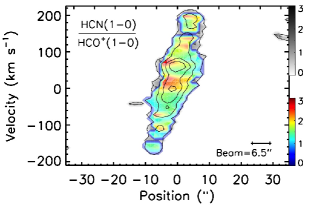
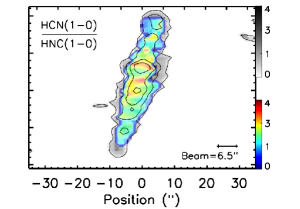
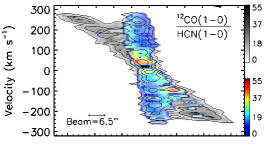
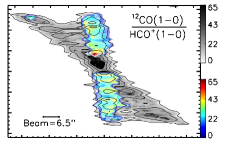
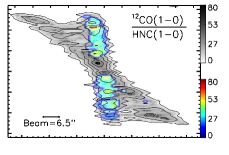
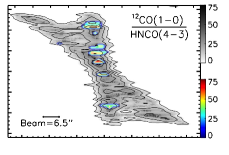
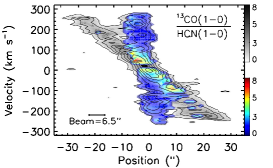
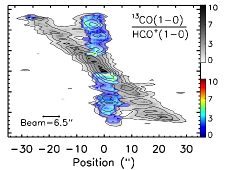
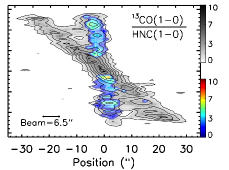
For our first approach to line ratio analysis, PVDs were created from these identical cubes as before, and ratios of these PVDs were calculated for relevant line pairs in each of the three aforementioned line ratio groups (CO lines only, dense gas tracers only, and CO versus dense gas tracers). For the high density tracer and 13CO lines that remain undetected in some regions of the discs, a flux upper limit was adopted, yielding a lower limit on the line ratios considered. The PVD ratios are shown in Figures 7 – 9, where the greyscales indicate lower limits.

4.2 Integrated line intensity ratios as a function of projected radius
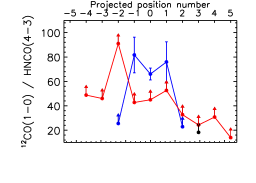
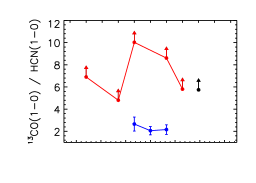
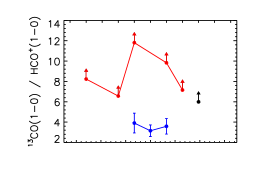
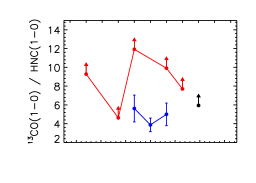
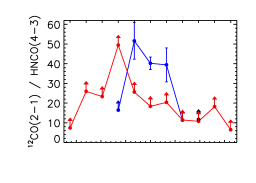
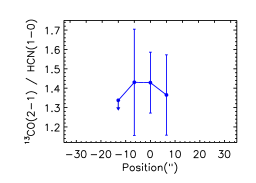
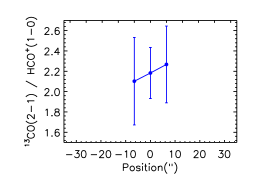
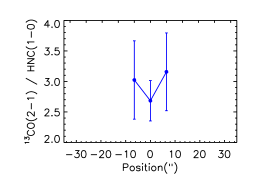
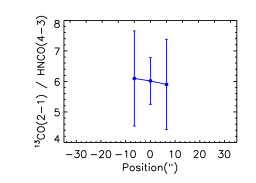
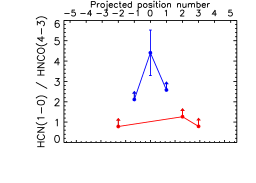
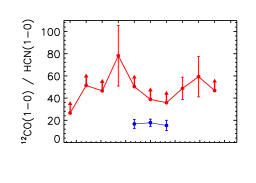
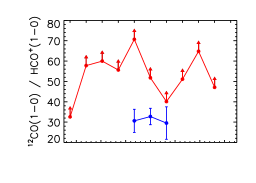
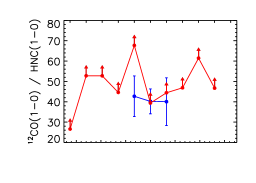
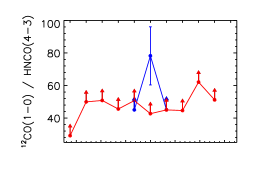
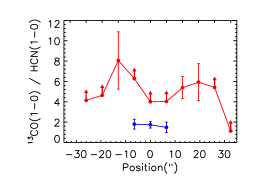
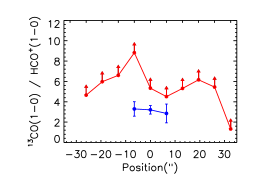
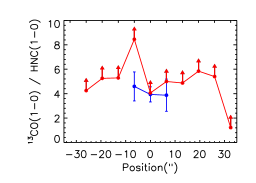
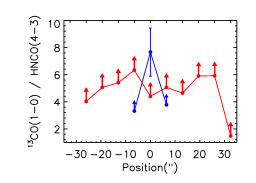
Using the PVDs created from the identical data cubes, for our second approach we attempted to disentangle the spectra of the two kinematic components seen in the PVDs (nuclear disc and inner ring; see § 3.2), this as a function of projected position along the disc. First, we extracted “integrated” spectra at a number of positions along the discs, each separated by one beam width, by taking averages of subsequent -pixel (i.e. one beam width) slices, as illustrated in Figure 10. Second, we calculated the integrated line intensity (i.e. in K km s-1) of each kinematic component at each position by fitting a single or double Gaussian to the extracted spectrum at each position, depending on whether a single or both kinematic components were present along the line of sight (see Fig. 11). The package MPFIT was used to optimize the fits (Markwardt, 2009). When both components are detected, a single Gaussian was normally sufficient in the outer parts (inner ring), while a double Gaussian was normally required in the inner parts (nuclear disc and inner ring). When a single component is detected in the inner parts (nuclear disc), a single Gaussian is of course always sufficient. The ratios of the integrated line intensities were then calculated as a function of projected radius along the discs. The corresponding line ratio profiles are shown in Figures 12 – 14 and are tabulated in Tables 3 – 5. Note that while the PVD ratios shown in Figures 7 – 9 are ratios of fluxes (i.e. K), the ratios shown in Figures 12 – 14 are ratios of integrated line intensities (i.e. K km s-1).
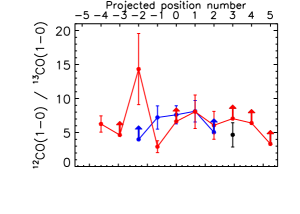
At the projected positions where there is at least one undetected line (, where is the uncertainty in the integrated line intensity), we assigned an upper limit to the integrated line intensity of FWHM, where is the noise in the spectrum of the undetected line and FWHM is the FWHM of the (other) detected line used to define the line ratio at that position. The error on this integrated line intensity upper limit was estimated using the noise in the spectrum and the error on the FWHM. Integrated line intensity ratios of particular interest are CO(1-0)/12CO(2-1), CO(1-0)/13CO(1-0) and CO(2-1)/13CO(2-1) for the low- CO lines only, and HCN(1-0)/HCO+(1-0), HCN(1-0)/HNC(1-0) and HCN(1-0)/HNCO(4-3) for the dense gas tracer lines only.
4.3 LVG Modelling
For our third approach, we probe the physical conditions of the molecular gas quantitatively by modeling the observed line ratios using the non-LTE radiative transfer code RADEX (van der Tak et al., 2007). The physics and assumptions adopted by the code are described at length in Appendix B.1. The three free parameters solved for are the molecular gas kinetic temperature , H2 volume number density (H2) and species column number densities (mol). As the critical densities of the high density tracers are orders of magnitude larger than those of the low- CO lines, we model the two sets of lines separately and hereafter refer to the associated molecular gas as dense and tenuous, respectively. Given the line ratios available (see Tables 3 – 5), four sets of models are possible: tenuous and dense gas in the nuclear disc of NGC 4710, tenuous gas in the inner ring of NGC 4710, and dense gas in the nuclear disc of NGC 5866.
The models are characterised in two ways described in details in Appendix B.2: first, the best-fit model in a sense (see Figs. 16 – 18 and Tables 6 and 7), and second, the most likely model as determined from the probability distribution function (PDF) of each model parameter marginalised over the others (see Figs. 19 – 21 and Tables 6 and 7). The best-fit models are generally consistent with the most likely models, but the uncertainties on the latter are usually large due to the flatness of the PDFs, and as expected results within a single kinematic component are indistinguishable.
Looking at the results for NGC 4710 in more details, the H2 volume density (H2) is generally well constrained (with frequent single-peaked PDFs) for both the tenuous and dense molecular gas components, at least in the nuclear disc. Unsurprisingly, the model results indicate that (H2) is larger and (CO) smaller in the dense gas component than in the tenuous gas component. The kinetic temperature of the tenuous gas component in the nuclear disc always has a peak at K (at the low-temperature edge of the model grid) in the PDFs, with a monotonic decrease at higher temperatures, causing the large uncertainties seen in the most likely model results. However, the most likely model results in the inner ring are just upper limits (i.e. all models are equally likely). for the dense gas component (nuclear discs only) shows single-peaked PDFs with much higher temperatures, but again the uncertainties are large. Overall, while there seems to be a clear trend for the dense gas component to have a higher , higher (H2) and smaller (CO), the trend is not significant given the uncertainties (see Table 6).
For NGC 5866, only the dense gas in the nuclear disc was modeled. At the central projected position (i.e. position ), the model results indicate a similar dense gas volume density, column density and temperature as those in the nuclear disc of NGC 4710. And again, the uncertainties for are proportionally higher than those for (H2) and (CO). However, as two positions in the nuclear disc of NGC 5866 have at least one line ratio that is a lower limit, the model results at those positions are just upper limits (and thus unconstrained; see Table 7).
5 Results and Discussion
In the previous sections, we quantified the physical conditions of a two-component molecular ISM, i.e. tenuous and dense gas components, along the discs of the edge-on early-type galaxies NGC 4710 and NGC 5866. We achieved this by probing the variations of molecular line ratios as a function of projected radius along the galaxy discs, and by performing radiative transfer modeling of these multiple molecular gas tracers.
In § 1, we also briefly discussed the properties of NGC 4710 and NGC 5866, highlighting the fact that they are relatively isolated, their barred nature, and their molecular gas richness compared to other ETGs. Before putting our results in context, however, we must also discuss their star formation.
5.1 Star formation
Davis et al. (2014) used fluxes from the Wide-field Infrared Survey Explorer (WISE) catalogue to estimate the star formation rates (SFRs) of molecule-rich ETGs in the ATLAS3D survey. While the total SFRs of NGC 4710 and NGC 5866 are average, that of NGC 4710 is half that of NGC 5866 ( vs. yr-1; see Table 1). However, as the star formation is concentrated into rings rather than being spread across the entire discs, NGC 4710 and NGC 5866 have reasonably high SFR surface densities, in the top of the ATLAS3D ETGs. Davis et al. (2014) also found that, like other ETGs, NGC 4710 and NGC 5866 have lower star formation efficiencies (SFEs) than those of spiral and starburst galaxies, with molecular gas depletion times of and Gyr, respectively (indicating SFEs respectively and times lower than that of normal spirals with Gyr; see, e.g., Kennicutt 1998). Nevertheless, the molecular line ratios we measured along the discs of both galaxies (particularly in the nuclear discs) show similarities to those found in the centres of some spirals and starbursts (see § 5.5). This suggests that the molecular line ratios are not sensitive to whatever is suppressing star formation in these systems.
5.2 Moment maps
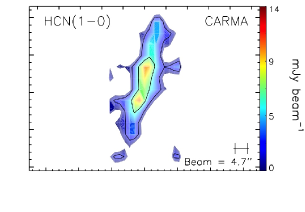
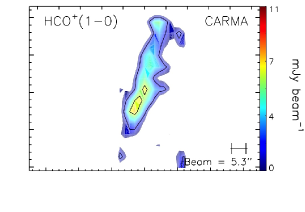
As our interferometric maps show (see Figs. 1 and 2), the tenuous molecular gas extends to on either side of the centre in both galaxies. The tenuous gas is brighter in the nuclear disc than in the inner ring of NGC 4710, but while this is also the case in NGC 5866, its inner ring is clearly more prominent (relative to the nuclear disc). As expected, the tenuous gas is more extended than the dense gas along the galaxy discs (at least given the roughly comparable noise levels in most cubes), the latter being generally centrally concentrated and restricted to the nuclear disc only (HCN(1-0) emission in the outskirts of NGC 5866 again suggests a more prominent inner ring). Already, the integrated molecular gas maps therefore suggest that different physical conditions are likely to prevail in the nuclear discs and inner rings.
In addition, the mean velocity maps reveal surprisingly complex behaviour beyond the nuclear disc in both galaxies, already hinting at multiple velocity components along the line of sight in these edge-on discs, a characteristic confirmed by the galaxies’ PVDs (see § 5.3 below).
5.3 PVDs
As discussed in § 3.2, the PVDs of NGC 4710 and NGC 5866 show a characteristic X shape (see Figs 3 and 4). This is easily understood in the context of barred galaxy dynamics, whereby the central rapidly-rising PVD component is associated with a nuclear disc within the ILR, while the outer slowly-rising PVD component can be associated with an inner ring near corotation.
In both NGC 4710 and NGC 5866, it is obvious that both 12CO and 13CO (i.e. all the tenuous gas) have similar distributions and kinematics, although as hinted from the moment 0 maps the inner ring in NGC 5866 is more prominent. In fact, separating the nuclear disc from the inner ring in the PVD, the integrated 12CO(1-0) (and 13CO(1-0)) flux of the inner ring in NGC 5866 is larger than that of the nuclear disc (opposite in NGC 4710). There does not seem to be any molecular gas beyond the inner ring (i.e. beyond corotation) in either galaxy, where the rotation curve (i.e. the high-velocity envelope of the PVD) would be expected to be flat. The particularly strong emission at the edges of the inner rings (especially in NGC 4710) is simply due to edge brightening (as the rings are seen edge-on). However, other local emission maxima are observed along the nuclear discs and inner rings in the PVDs (see Figs 3 and 4), indicating that the molecular gas in both of these components is clumpy. The molecular gas peaks likely trace individual giant molecular cloud complexes, and they should be associated with regions of increased star formation.
The gap between the nuclear disc and inner ring in the PVDs is easily understood by a lack of gas on orbits, as they are swept free of gas by the shocks on the leading edge of the bar. However, the feature seen at the intermediate region in 12CO(1-0) PVD (see § 3.2 and Fig. 10) is not fully understood, but Athanassoula & Bureau (1999) speculated based on hydrodynamical simulations that this emission originates in secondary enhancements of gas in front of the leading edges of particularly strong (and sharp) bars.
Overall, it is clear that the molecular gas in the barred edge-on galaxies NGC 4710 and NGC 5866 is primarily concentrated in two distinct but clumpy kinematic components, a nuclear disc and an inner ring. As the dense gas tracers (HCN(1-0), HCO+(1-0), HNC(1-0) and HNCO(4-3)) are not detected outside the nuclear discs (except HCN(1-0) in NGC 5866), their PVDs do not show the characteristic X shape. It is thus natural to expect the ISM physical conditions to be similar within each kinematic component (with possibly small variations between clumps, especially if they are star-forming), but for the conditions to be different across the two components. The clumpy nature of the two kinematic components is confirmed by the observed line ratios, as local emission maxima in the PVDs (i.e. clumps) seem to correlate with local variations in the line ratios (particularly the ratios of CO to dense gas tracer lines; see Figs. 12 – 14).
Lastly, we note that unlike the behaviour of the other lines in both galaxies, there is almost no dense gas detected at the very centre of the PVDs in NGC 5866. The same effect, if present at all, is much weaker in NGC 4710 (see Figs. 3 and 4). This suggests that a different excitation mechanism (or possibly gas distribution) dominates in the very centre of NGC 5866 (e.g. active galactic nucleus or nuclear starburst activity), unless the local emission minimum is in fact due to absorption against a nuclear continuum source. The latter possibility however seems unlikely, since while there is a continuum source in NGC 5866 (see Section 3.4), no absorption is seen in the spectra.
5.4 Integrated spectra
Except for HNC(1-0) and HNCO(4-3) (shown here for the first time), all the molecular lines discussed were previously observed with the IRAM 30m telescope (see Young et al. 2011 and Crocker et al. 2012). As illustrated in the moment maps (Figs. 1 and 2), where we overlaid the corresponding IRAM 30m beam sizes, the CO extent (at all transitions) is covered entirely only by the interferometric observations (with larger primary beams). The single-dish beams systematically cover the nuclear discs only, thus missing out much of the tenuous molecular gas (this is not a problem for the dense gas tracers, that are not detected in the inner rings).
In Figures 5 and 6, the integrated CARMA and PdBI spectra, simulated (i.e. integrated with a spatial Gaussian weighting) IRAM 30m spectra, and observed IRAM 30m spectra are overlaid with each other (see § 3.3). As expected given the comments above, the integrated interferometric CO (i.e. tenuous molecular gas) fluxes are systematically larger than the single-dish fluxes (simulated and observed). However, again as expected given their spatially compact emission (nuclear discs only), the integrated and single-dish dense gas tracer spectra are consistent with each other. Differences in the shapes of the spectra from line to line can further indicate different gas physical conditions along the discs of the galaxies (and thus a slightly different spatial distribution for each tracer). Interestingly, only the dense gas tracers of NGC 5866 show clearly double-peaked integrated line profiles (and to a lesser extent 12CO(1-0); see Figs. 5 and 6).
The only discordant note in relation to the integrated spectra is the fact that the simulated IRAM 30m spectra of the tenuous molecular gas in NGC 4710 are significantly brighter than the true IRAM 30m spectra (see the top three panels of Fig. 5). The relatively large offset between the simulated and observed spectra is thus most likely due to a combination of single-dish pointing errors (supported by the slight asymmetry of the true IRAM 30m spectra, not present in the CARMA data) and flux calibration uncertainties ( is standard for milimetric observations flux-calibrated using planetary models; see e.g. Alatalo et al. 2013).
5.5 Molecular line ratios
The ratios of the PVDs from different lines are shown in Figures 7 – 9, while Figures 12 – 14 show the ratios of the integrated line intensities as a function of projected radius for each kinematic component separately (nuclear disc and inner ring; the values are listed in Tables 3 – 5). Similarly, the LVG modeling results for the tenuous and dense molecular gas components, in the nuclear discs and inner rings, are listed in Tables 6 and 7.
We recall here that for rings, the different projected positions simply correspond to different azimuthal positions (i.e. angles) within the rings, so we do not expect significant gradients with projected position. The nuclear disc, as its name suggests, may well however be filled in.
5.5.1 12CO(1-0) / 12CO(2-1) ratio and tenuous gas temperature
In NGC 4710, the ratio of the PVDs of the 12CO(1-0) and 12CO(2-1) lines shows that the ratio is greater than unity everywhere, but is slightly smaller in the nuclear disc than the inner ring (see Fig. 7), suggesting a higher temperature in the tenuous molecular gas of the nuclear disc. This is confirmed by the ratio of the integrated line intensities along the two kinematic components (see Fig. 12), clearly showing that CO(1-0)/12CO(2-1) at the central three projected positions along the nuclear disc (i.e. projected positions , and ) is smaller than that at the same positions in the inner ring. This trend appears marginal at the edges of the nuclear disc (projected positions and ), but this is simply due to the very weak emission (and associated large uncertainties) there.
Ideally, the temperature difference between the tenuous gas in the nuclear disc and inner ring of NGC 4710 would be confirmed by our LVG modeling, but the results are inconclusive. This is however not totally surprising, as we have only two CO transitions (, ) to constrain the temperature. Within each ring, the best-fit temperatures cover nearly the entire range allowed by the models. This is probably because the contours at each position are often shallow and extended (see Figs. 16 and 18), so that the best-fit model results should be taken with a grain of salt. The likelihood results are better suited to such situations, and suggest a low to intermediate temperature in the nuclear disc ( – K, but perhaps much higher), but no useful constraint can be derived for the inner ring (due to some line ratio lower limits).
Although 12CO(2-1) and its isotopologue were not observed interferometrically in NGC 5866, single-dish observations of these lines in the central regions of NGC 5866 show that is larger there than in the central regions of NGC 4710 (Crocker et al., 2012). This suggests that the CO gas at the centre of NGC 5866 is colder than that in NGC 4710. However, since the single-dish observations cannot disentangle the emission from the nuclear disc and inner ring, this should be verified with interferometric data.
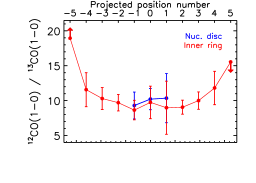
5.5.2 12CO / 13CO ratio and tenuous gas opacity
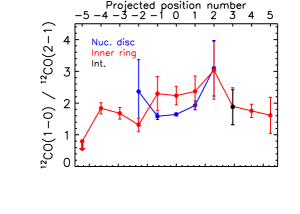
As shown in Figure 7, the ratio of 12CO to its isotopologue 13CO is larger by a factor of in the central regions of the nuclear disc of NGC 4710 (positions , and ) than in all other regions (external parts of the nuclear disc and the few positions in the inner ring where a measurement is possible). This is true of both the and transitions.
Looking at the ratios of the integrated line intensities of CO an its isotopologue (CO(1-0)/13CO(1-0) and CO(2-1)/13CO(2-1)) as a function of projected radius (Fig. 12), the above behaviour is confirmed. Indeed, the ratios at positions , and of the nuclear disc of NGC 4710 (the central three projected positions) are twice those at the same projected positions in the inner ring (so is at position ). We must note however that the ratios in the inner ring of NGC 4710 are all lower limits (the same applies to some positions for and to positions and of the nuclear disc).
If confirmed (e.g. by the detection of 13CO(1-0) and 13CO(2-1) at all the positions along the inner ring), the behaviour described above would indicate optically thinner tenuous molecular gas in the central regions of the nuclear disc (assuming that all of the 13CO is optically thin but only some of the 12CO). However, the emission in the central regions includes contributions from the inner ring as well (in projection).
Interestingly, the ratio of the inner ring of NGC 4710 shows a significant maximum at projected position , that clearly corresponds to a clump (see Figure 12 and 10), while the weaker minimum at position has no obvious clump associated with it.
While a (and thus likelihood) analysis of the opacity is not possible, since it is not a model parameter, each model computed does return the optical depths of the associated lines. The optical depths of the 12CO(1-0) and 12CO(2-1) lines for the best-fit models are thus known. In addition, one would expect the CO column number density to correlate with its optical depth. Looking at the model results (Table 6), the 12CO(1-0) optical depth, 12CO(2-1) optical depth, and CO column number density in the nuclear disc are generally slightly larger than those in the inner ring, contrary to our expectations based on the empirical 12CO/13CO ratios. However, as the best-fit models are not representative of the geometry and most lie at the edge of the model grid, the associated opacities and column number densities are questionable.
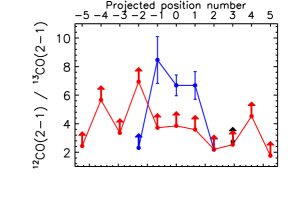
Unlike NGC 4710, the ratio in NGC 5866 appears smaller in the central regions by (compared with all other regions in the ratio PVD; see Fig. 9). However, the effect is weak and seems to be associated with a generally slightly smaller ratio in the inner ring compared to the nuclear disc (if more marked in the central regions). Looking at the ratio of the integrated line intensities ( only), the ratios of the nuclear disc and inner ring are consistent in the central regions, although the ratios do increase at larger projected radii in the inner ring (see Figure 14). The effect is marginal at best however, as nearly all ratios measured are consistent within the uncertainties.
Crocker et al. (2012) also measured the and ratios in the central regions of both galaxies (without disentangling the two kinematic components). While our average values along the nuclear disc and the inner ring of NGC 4710 agree with the ratios reported by Crocker et al. (2012) (within the uncertainties), our average ratio for both the nuclear disc and the inner ring of NGC 5866 is larger than that found by Crocker et al. (2012).
As hinted above, as 13CO is less abundant than its parent molecule 12CO and is generally considered optically thin, 12CO/13CO variations largely reflect variations in the 12CO optical depth. The larger the ratio, the thinner the 12CO gas (and vice-versa). The general behaviour in NGC 4710 and NGC 5866 (but more prominent in NGC 4710) is thus that the CO gas is optically thinner in the nuclear disc than in the inner ring, although the trend is weak and may be restricted to the inner parts of the nuclear disc in NGC 5866. Variations within each kinematic component (e.g. local maximum in the inner ring of NGC 4710 and projected radius trend in NGC 5866) likely indicate azumithal variations of the physical conditions (i.e. clumpiness) within them.
High and ratios tracing diffuse gas are probably the result of stellar feedback, and therefore indicate more active current and/or recent star formation. Radial gradients are indeed seen in spirals (Paglione et al., 2001), and the ratio can have local maxima in star-forming regions along spiral arms (Tan et al., 2011). This thus suggests that star formation is more intense in the nuclear discs of our galaxies than their inner rings (at least in NGC 4710), a behaviour entirely consistent with the general behaviour of barred disc galaxies, particularly early-type spirals (e.g. Kormendy & Kennicutt, 2004). This also agrees with the higher temperatures inferred for the molecular gas in the nuclear discs (compared to that in the inner rings) in the previous sub-section (§ 5.5.1). Higher 13CO observations would however help to strengthen this result.
5.5.3 HCN / HCO+, HCN / HNC and HCN / HNCO ratios and dense gas excitation
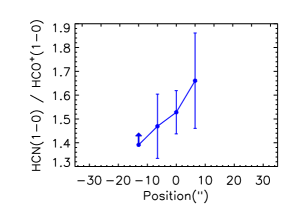
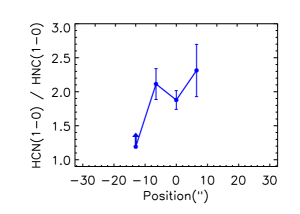
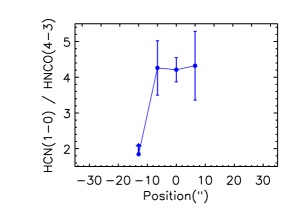
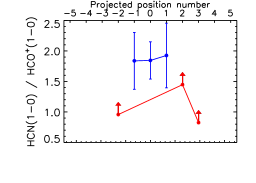
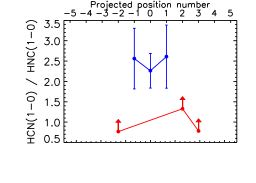
The ratios of the PVDs of the dense gas tracers only are shown in Figures 7 and 9 for NGC 4710 and NGC 5866, respectively (where greyscales represent lower limits, where HCN was detected but not the other lines). The ratios of the integrated line intensities, namely HCN(1-0)/HCO+(1-0), HCN(1-0)/HNC(1-0) and HCN(1-0)/HNCO(4-3) are shown as a function of projected radius in Figures 12 and 14. Generally, the dense gas tracers are detected only in the nuclear discs (typically projected positions , and ). The only exception to this is the detection of HCN(1-0) in the inner ring of NGC 5866 (with significant detections at projected positions , and ).
The , and ratios are larger than at all projected positions, and they do not show any evidence of a gradient with projected position (and thus azimuthal angle). , indicating that HCN(1-0) is the brightest line among the dense gas tracers, followed by respectively HCO+(1-0), HNC(1-0) and HNCO(4-3). Crocker et al. (2012) also detected HCN(1-0) and HCO+(1-0) in the central regions of both galaxies, finding , consistent with the values found here for the nuclear discs.
UV radiation from young massive (O and B) stars, X-rays from active galactic nuclei (AGN) and CRs from supernova explosions all have distinct characteristic effects on the molecular gas physical conditions, and each plays an important role in the dissociation and ionisation of molecules, thus changing the chemistry of the ISM and affecting the molecular line ratios observed. UV radiation primarily affects the outermost layers of clouds (photon dissociation regions or PDRs; e.g. Tielens & Hollenbach 1985a, b; Blake et al. 1987), while X-rays penetrate deeper and form X-ray dissociation regions (XDRs; Lepp & Dalgarno 1996, e.g.; Maloney et al. 1996, e.g.). Both UV and X-ray radiation can enhance HCN, but since X-rays can affect the gas chemistry much deeper into clouds, they can do so more efficiently (if present; e.g. Krips et al. 2008).
The theoretical results of Meijerink et al. (2007) suggest that if the volume density exceeds a value cm-3, then in PDRs, while in XDRs. Our LVG modelling results for a two-component molecular ISM indicate that for the dense gas component (H2) cm-3 for both galaxies (see Tables 6 and 7). Combined with the fact that everywhere in both galaxies, this therefore indicates that PDRs are most likely dictating the physical conditions (and thus the observed line ratios) of the molecular ISM in the nuclear discs of both galaxies. Reassuringly, those densities are also much larger than those obtained for the tenuous molecular gas component (typically by orders of magnitude).
Our results are also consistent with the absence of any substantial AGN activity (and thus X-rays) in NGC 4710 and NGC 5866. However, since , supernova explosions are also unlikely to be significant, and young massive OB stars are likely responsible for the HCN enhancement. If supernova explosions were a dominant force in the ISM, HCO+ would have been enhanced by CRs (with respect to HCN), leading to as seen in starbursts (although not all starbursts and spiral galaxies have ; see § 5.6). Overall, the high ratio observed thus suggests a low-CR PDR-dominant environment in the nuclear disc of both galaxies, but there could be some impact from supernova explosions as seen in starbursts/spirals that have similar ratios.
We note briefly that, assuming the , and upper limits in the inner ring of NGC 5866 are not too far off the mark, these ratios are then larger in the nuclear disc than in the inner ring, indicating different dissociation and ionisation mechanisms in the two kinematic components. The HCN would need to be suppressed or HCO+, HNC and HNCO enhanced in the inner ring. More sensitive observations of HCN, HCO+, HNC and HNCO in the inner ring of both galaxies are however necessary to clearly constrast the physical conditions of their dense molecular ISM.
5.5.4 Ratios of CO to HCN, HCO+, HNC and HNCO and dense gas fraction
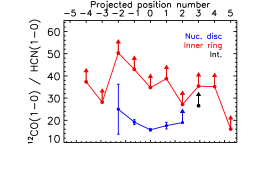
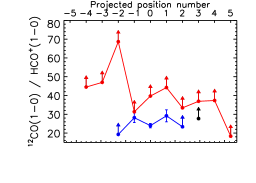
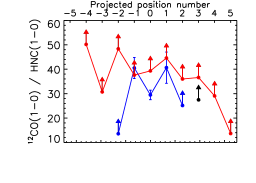
The ratios of CO PVDs to high density tracer PVDs (hereafter ) are shown in Figures 8 and 9 (where greyscales represent lower limits, where CO was detected but not the high density lines), while the ratios of the integrated line intensities as a function of projected radius are shown in Figures 13 and 14 (see also Tables 4 and 5).
As seen from all those figures, there is a clear difference of the CO to high density tracer ratios between the nuclear disc and inner ring, for both NGC 4710 and NGC 5866. Indeed, the ratios are significantly larger in the inner rings (clearest for the ratios involving HCN and HCO+), and the true differences are likely to be even greater than that hinted by Figures 8 – 9 and 13 – 14 as the ratios in the inner rings are all lower limits (except for a few positions in HCN in NGC 5866). This contrast is incontrovertible for the HCN, HCO+ and HNC lines, but may well also hold true for HNCO (where some inner ring lower limits are smaller than the corresponding nuclear disc ratios). For example, the ratios of 12CO(1-0)/HCN(1-0) and 12CO(1-0)/HCO+(1-0) in the inner ring of NGC 4710 are at least higher than those in its nuclear disc (and often more than twice). Similarly, the ratios of 12CO(1-0)/HCN(1-0) in the inner ring of NGC 5866 are at least twice those in its nuclear disc, whereas the ratios of 12CO(1-0)/HCO+(1-0) are at least higher, typically more.
As the ratios essentially trace the fraction of dense molecular gas (see below), these empirical results strongly suggest that the fraction of dense gas is larger in the nuclear discs of the galaxies than in their inner rings. This is consistent with dense gas being generally centrally-concentrated in galaxies, and with the more intense star formation activity (with hotter and optically thinner CO gas) inferred in the previous sub-sections (§ 5.5.1 – 5.5.3) for NGC 4710 and NGC 5866 specifically.
We note that the average 12CO(1-0)/HCN(1-0), 12CO(1-0)/HCO+(1-0), 13CO(1-0)/HCN(1-0) and 13CO(1-0)/HCO+(1-0) ratios along the nuclear disc of NGC 4710 are consistent with those found by Crocker et al. (2012) for the central regions of the galaxy, while the average 12CO(2-1)/HCN(1-0), 12CO(2-1)/HCO+(1-0), 13CO(2-1)/HCO+(1-0) and 13CO(2-1)/HCO+(1-0) ratios in the nuclear disc are slightly smaller (by –). Similarly, the average 12CO(1-0)/HCN(1-0), 12CO(1-0)/HCO+(1-0) and 13CO(1-0)/HCO+(1-0) ratios along the nuclear disc of NGC 5866 are consistent with those found by Crocker et al. (2012), but the average 13CO(1-0)/HCN(1-0) ratio in the nuclear disc is slightly smaller (). See Table 4 and Table 4 in Crocker et al. (2012).
It is generally agreed that CO(1-0) traces the total molecular gas content of galaxies, due to its low critical density ( cm-3). Some of the gas traced by CO(1-0) may therefore not be involved in star formation. However, transitions of more complex molecules such as HCN(1-0), HCO+(1-0), HNC(1-0) and HNCO(4-3) have higher critical densities (up to cm-3) because of their larger dipole moments. These molecules are therefore generally taken as tracers of high-density molecular gas, more closely related to star-forming regions than CO itself (e.g. Gao & Solomon, 2004b; Scoville, 2013). As hinted above, the ratios of CO to these dense gas tracers therefore trace the dense gas fraction of the ISM (larger for smaller ratios), underlying our statement that the nuclear discs have a larger fraction of dense gas than the inner rings.
Nevertheless, another possible reason specifically for the low CO/HCO+ ratios observed in the nuclear discs is an enhancement of HCO+ via supernova explosions (as the CRs generated can ionize H2, producing H that reacts with CO to form HCO+). However, as discussed in the previous sub-section (§ 5.5.3), the CRs ionisation rates are not likely to be as high as what is normally inferred in starbursts (enhancing HCO+ with respect to HCN and other molecules), so the role of CRs in the ISM ionisation and gas chemistry is probably limited.
In parallel to the discussion in the previous sub-section (§ 5.5.3), the low 12CO(1-0)/HCN(1-0) ratios observed in the nuclear discs can further be driven by the chemical enhancement of HCN via UV radiation from young stars. Meijerink et al. (2007) claims that at high densities ( cm-3), PDRs produce lower CO(1-0)/HCN(1-0) ratios than XDRs, similar to the low ratios found in the nuclear disc of both galaxies. Our empirical results thus suggest that a high dense gas fraction ISM harbouring PDRs with relatively few CRs but strong UV radiation is the most likely set of physical conditions explaining the low ratios (and , and ratios greater than unity) observed in the nuclear disc of both galaxies.
In the Milky Way, M31 and some other spirals, the 12CO/HCN ratio increases with radius (Helfer & Blitz, 1997; Gao & Solomon, 2004b; Brouillet et al., 2005), in turn indicating a decrease of the dense gas fraction with radius. Our results in NGC 4710 and NGC 5866 are similar, as the ratios in their inner rings (with radii of and kpc, respectively) are larger than those in the nuclear discs (with radii of and kpc). Given the geometries we have argued for, however, we are only sampling possible dense gas fraction gradients at two discrete locations in the galaxies (nuclear disc and inner ring radii).
Helfer & Blitz (1997) also argued that the CO/HCN ratio is directly related to the hydrostatic pressure, the ratio decreasing as the pressure increases. Our results thus suggest that the ambient pressure is higher in the nuclear discs than in the inner rings. This is as expected for the central regions of galaxies, as the nuclear discs of NGC 4710 and NGC 5866 are located well within their bulges, and is consistent with the idea that higher pressures lead to larger dense gas fractions. In fact, the 12CO(1-0)/HCN and 12CO(1-0)/HCO+ ratios in the nuclear discs of both galaxies are similar (likewise for 13CO(1-0)), indicating that the dense gas fraction and/or the ionisation mechanisms of the gas in the nuclear discs of both galaxies are similar.
Finally, we note that if the low ratios observed in the nuclear discs of both galaxies were the result of chemical enhancement of HCN via X-rays from an AGN, then that could also explain the smaller CO/HCN ratios observed in the nuclear discs compared with the inner rings. However, while the mm continuum sources in NGC 4710 and NGC 5866 (see § 3.4) do suggest the presence of some AGN activity, the dense gas tracer line ratios discussed above (see § 5.5.3) indicate that this activity is weak and is not a dominant driver of the physical conditions and chemistry of the ISM. It is therefore more likely that the other mechanisms highlighted above are dominant.
Unfortunately, as we have considered the tenuous (CO) and dense (HCN, HCO+, HNC and HNCO) gas tracers separately for our LVG modeling, this modeling does not inform on the dense gas fraction.
5.5.5 All ratios and gas physical conditions
Overall, considering all line ratios and associated diagnoses, our results seem to suggest that while the nuclear discs and inner rings of NGC 4710 and NGC 5866 have similar molecular gas physical conditions, the nuclear discs have a slightly larger dense gas fraction with hotter and optically thinner molecular gas than their inner rings. Physically, this in turn suggests that compared to the inner rings, the nuclear discs have a more inhomogeneous ISM, with more dense clumps bathed in a hotter and more diffuse molecular medium. Conversely, the inner rings have a more homogeneous ISM, with fewer clumps immersed in colder and denser molecular gas. This is consistent with a dominant PDR-like environment with few CRs but intense UV radiation in the nuclear discs.
5.6 Line ratios and galaxy type/morphology
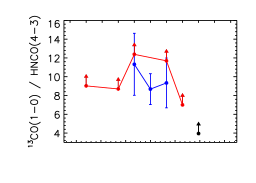
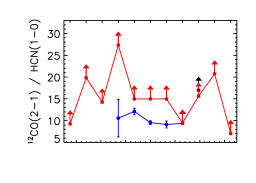
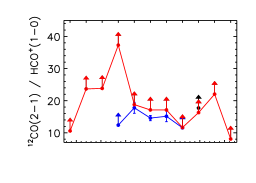
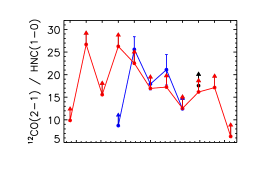
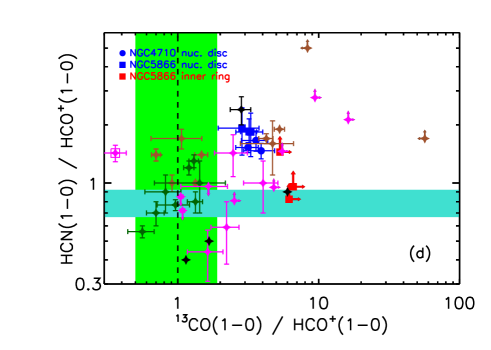
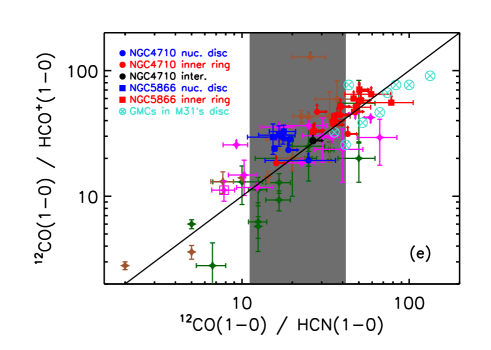
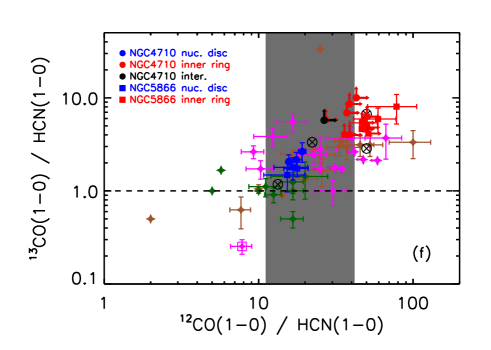
In Figure 15, we compare the ratios of the integrated line intensities obtained along the equatorial plane of NGC 4710 and NGC 5866 with those obtained in the central regions of a variety of galaxies (lenticulars, spirals, starbursts, Seyferts) as well as spatially-resolved spiral galaxy GMCs. The figure caption describes all the symbols and overlaid lines in detail.
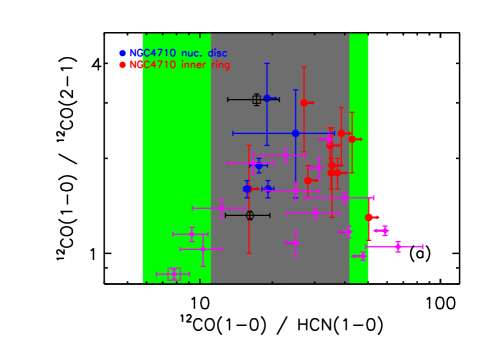
In Figure 15a, the ratio is shown as a function of 12CO(1-0)/HCN(1-0) for the nuclear disc and inner ring of NGC 4710 only, as 12CO(2-1) was not observed in NGC 5866. However, the single-dish data for the centre of NGC 5866 and NGC 4710 are also shown for comparison. While the range of 12CO(1-0)/HCN(1-0) ratios in lenticulars and particularly starbursts (green shaded region in Figure 15a) is larger than that in NGC 4710, the striking feature of this figure is that the ratio in NGC 4710 appears much larger than that in most lenticulars, suggesting that the molecular gas temperature in most lenticulars is higher than that in NGC 4710.
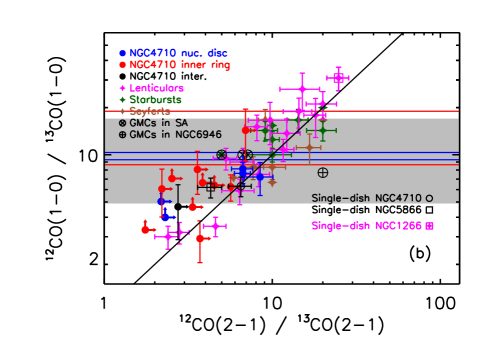
As seen in Figure 15b, the ratio is larger than in a majority of sources of all kinds, including NGC 4710 and NGC 5866. However, the range of ratios in NGC 5866 ( for the nuclear disc and for the inner ring, as shown by respectively the blue and red horizontal lines) is smaller than that in lenticulars (; Krips et al. 2010; Crocker et al. 2012) and spirals (; pale grey shaded region; Paglione et al. 2001), and it is located toward the upper end of the distribution, similarly to starbursts. The ratios in NGC 4710 are smaller (mostly ) and occupy the lower end of the spiral range. This indicates that the CO gas is optically thinner in NGC 5866 and starbursts than in NGC 4710, supporting the idea that strong star formation feedback in starbursts (both radiative via UV light from OB stars and mechanical via supernova explosions) leads to diffuse gas. The difference between NGC 4710 and NGC 5866 is however consistent with the wide range of and ratios observed in lenticular galaxies, analogous to the significant variations observed in their CO to dense gas tracer ratios (Figs. 15a, d – f).
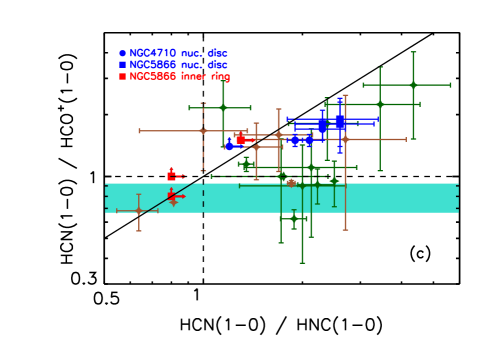
As seen from Figure 15c, the HCN(1-0)/HNC(1-0) ratios in the nuclear discs of NGC 4710 and NGC 5866 are greater than and similar to those in starbursts, while some Seyferts have much smaller ratios. The behaviour is similar for the HCN(1-0)/HCO+(1-0) ratio, although many starbursts also then have smaller ratios. As hinted by the line, the HCO+/HNC ratio is essentially always larger than in the nuclear discs of NGC 4710 and NGC 5866, as for all starbursts (except one), while many Seyferts cluster around the relation. The ratios may be different in the inner rings of NGC 4710 and NGC 5866, but this is unclear as all ratios are lower limits.
As shown in Figure 15d, there is a clear difference between the 13CO(1-0)/HCO+ and HCN(1-0)/HCO+(1-0) ratios of NGC 4710 and NGC 5866 and those of starbursts (including M82 shown as a green shaded region) in particular, while both Seyferts and other lenticulars have broad ranges of ratios encompassing those of NGC 4710 and NGC 5866. As discussed in § 5.5.4, the 13CO(1-0)/HCO+ ratio is smaller in the nuclear discs than the inner rings of NGC 4710 and NGC 5866, but now it also appears that this ratio is smaller in all starbursts than in either component, suggesting that starbursts have a larger fraction of dense molecular gas than either the nuclear discs or inner rings of NGC 4710 and NGC 5866 (in that order). As usual, NGC 1266 stands out, here with an exceptionally high dense gas fraction. The HCN(1-0)/HCO+(1-0) ratios in the nuclear discs of NGC 4710 and NGC 5866 are also larger than those in starbursts or the GMCs of M31, indicating less HCO+ and thus fewer CRs from supernova explosions in NGC 4710 and NGC 5866. Observations of both 13CO and high density tracers in the outskirts of our galaxies and normal star-forming (i.e. not star-bursting) spirals would help to establish a better comparison sample for all galaxy types.
As can be seen from Figure 15e, while the 12CO(1-0)/HCN(1-0) ratios in the inner rings of NGC 4710 and NGC 5866 are at the upper end of the range for spirals (dark grey shaded region), and are entirely consistent with the ratios in M31’s GMCs, the 12CO(1-0)/HCN(1-0) ratios in their nuclear discs are smaller and in the middle of the spiral range. While overlapping slightly with the nuclear discs, the ratios for starbursts are generally even smaller, suggesting again a sequence of dense gas fraction (increasing from the GMCs of M31, to the inner rings and nuclear discs of NGC 4710 and NGC 5866, to starbursts). And indeed, the 12CO(1-0)/HCO+(1-0) ratios in NGC 4710 and NGC 5866 are larger than those in starbursts, this both for the nuclear discs and inner rings (although more so for the latter and M31’s GMCs). While M31’s GMCs and most starbursts lie below the lines, indicating an HCO+ enhancement, the opposite is true in both the nuclear discs and inner rings of NGC 4710 and NGC 5866 (see also Figs. 15c and d). This indicates that while the aforementioned dense gas fraction sequence may dominate both ratios, the enhancement of HCO+ via CRs is strongest in starbursts, less so in M31’s GMCs, and is weakest in NGC 5866 and NGC 4710.
The behaviour shown in Figure 15f largely mimics that in Figure 15e, although being unaffected by optical depth effects the 13CO(1-0) line is arguably a better tracer of the total molecular gas content, thus introducing additional scatter. NGC 1266 remains the only lenticular galaxy with 13CO(1-0)/HCN(1-0) significantly smaller than .
6 Conclusions
Interferometric observations of tenuous (12CO(1-0), 12CO(2-1), 13CO(1-0) and 13CO2-1)) and dense (HCN(1-0), HCO+(1-0), HNC(1-0) and HNCO(4-3)) molecular gas tracers were presented for the edge-on lenticular galaxies NGC 4710 and NGC 5866. Our main conclusions are:
-
1.
The PVDs of the CO lines are X-shaped and reveal that the gas is constrained to two bar-driven kinematic components in both galaxies, a nuclear disc (contained within the inner Lindblad resonance) and an inner ring (around corotation). Although brighter in the nuclear discs, the tenuous molecular gas is clearly detected in both kinematic components and is radially more extended than the dense gas, the latter being generally detected in the nuclear discs only. However, as suggested by the HCN(1-0) detection in the inner ring of NGC 5866, it is likely that the inner rings also contain dense gas below our detection thresholds. Both components appear clumpy, and no molecular gas is detected beyond the inner rings.
-
2.
A comparison of our interferometric data with published single-dish data (with much smaller primary beams) reveals that the latter were missing significant flux associated with the CO lines in the radially-extended inner rings.
-
3.
Molecular line ratios were probed empirically by studying the ratios of the PVDs of CO lines only, dense gas tracer lines only, and CO to dense gas tracer lines, as well as by extracting the integrated line intensity ratios of these same lines as a function of projected position along the galaxy discs, this for each kinematic component separately. The CO(1-0)/CO(2-1) ratios are smaller in the nuclear discs than the inner rings, suggesting that the nuclear discs have higher tenuous molecular gas temperatures. The 12CO/13CO ratios are slightly larger in the nuclear discs, suggesting that the tenuous gas there has slightly smaller optical depths and column densities (at the very least in NGC 4710). The line ratios of the dense gas tracers only (detected only in the nuclear discs) are all larger than and HCN(1-0)/HCO+(1-0) HCN(1-0)/HNC(1-0) HCN(1-0)/HNCO(4-3), suggesting that the environment is similar to PDRs, with a chemical enhancement of HCN via UV radiation from young massive OB stars and relatively few (supernova explosion-related) CRs. The ratios of CO to dense gas tracers (e.g. 12CO/HCN(1-0) or 13CO/HCN(1-0)) are significantly lower in the nuclear discs than in the inner rings, suggesting a higher fraction of dense gas there, possibly linked to a higher ambient pressure. Overall, the picture that emerges from these empirical line ratio diagnostics is that of nuclear discs that have a more inhomogeneous ISM, with more dense clumps immersed in a hotter and optically thinner molecular gas medium, consistent with a more intense star formation activity (conversely for the inner rings).
-
4.
LVG (RADEX) modeling was also carried out, considering a two-component molecular ISM traced by the CO lines only (tenuous component) and dense gas tracer lines only (dense component). The results are however inconclusive. The best-fit models within a single kinematic component often cover the entire range of parameters allowed by the models and are often driven to the edge of the model grid, presumably as a result of the shallowness and extent of the contours. The most likely model parameters have very large uncertainties (particularly for ), due to the shape of the marginalised probability distribution functions. As such, they do not reveal clear differences between the inner rings and nuclear discs. This is exacerbated by the facts that most model results are upper limits in the inner ring of NGC 4710, and that we are unable to model the tenuous gas component in the disc of NGC 5866.
-
5.
We further compared the line ratios measured in NGC 4710 and NGC 5866 with those obtained in other galaxy types, revealing interesting contrasts. The CO(1-0)/CO(2-1) ratio is larger and thus the tenuous molecular gas temperature lower in NGC 4710 than in most other lenticular galaxies. The 12CO/13CO ratios in NGC 5866 are larger than those in NGC 4710 and similar to those in starbursts, suggesting an optically thinner tenuous component similar to that in starbursts. The range of ratios in other lenticulars and Seyferts is however much larger than that in either NGC 4710 or NGC 5866. While the 12CO(1-0)/HCN(1-0) ratios in the nuclear discs of NGC 4710 and NGC 5866 are similar to those of starbursts near the lower end of the range for spirals, the ratios in the inner rings are larger and rather similar to those observed in some Seyferts and lenticulars near the upper end of the spiral range (where M31’s GMCs are found). The 13CO(1-0)/HCN(1-0) ratios of both the inner rings and nuclear discs are however larger than those of starbursts (in that order), indicating smaller dense gas fractions. The HCN(1-0)/HCO+(1-0) ratio is greater than unity everywhere in NGC 4710 and NGC 5866, as in most starbursts, while it is smaller than unity in spatially-resolved GMCs. High 13CO(1-0)/HCO+(1-0) ratios in NGC 4710 and NGC 5866 further indicate relatively low HCO+ enhancement (few CRs from supernova explosions) compared to that seen in starbursts and GMCs. Overall, the molecular line ratios in the nuclear discs of NGC 4710 and NGC 5866 thus suggest that the physical conditions of the molecular gas are intermediate between those of spiral galaxies and starbursts, with intense but not extreme star-formation activity, while the inner rings host even milder star formation. Interestingly, the star formation efficiency of both galaxies is much lower than that of normal spirals, suggesting that the line ratios are not sensitive to whatever is suppressing star formation.
In summary, based on empirical line ratios, star formation feedback is likely to be stronger in the nuclear discs of NGC 4710 and NGC 5866 than in their inner rings, leading to hotter and optically thinner CO gas with a higher fraction of dense gas clumps. However, due to their large uncertainties, the most likely model results are unable to confirm this apparent dichotomy. As the resolution of our observations ( pc for the CO lines) is not enough to resolve individual GMCs ( pc), the physical conditions estimated either empirically or via LVG modeling are only averages over GMC associations. Higher angular resolution observations of high- CO lines and dense gas tracers with ALMA will ultimately resolve the GMCs, and therefore allow us to verify and expand these statements with much greater accuracy.
Acknowledgements
ST was supported by the Republic of Turkey, Ministry of National Education, and The Philip Wetton Graduate Scholarship at Christ Church. MB was supported by the rolling grants “Astrophysics at Oxford” ST/H002456/1 and ST/K00106X/1 from the UK Research Councils. TAD acknowledges the support provided by an STFC Ernest Rutherford Fellowship. This research also made use of the NASA/IPAC Extragalactic Database (NED), which is operated by the Jet Propulsion Laboratory, California Institute of Technology, under contract with the National Aeronautics and Space Administration. The research leading to these results has received funding from the European Community’s Seventh Framework Programme (/FP7/2007-2013/) under grant agreement No 229517.
References
- Alatalo et al. (2011) Alatalo K. et al., 2011, ApJ, 735, 88
- Alatalo et al. (2015) Alatalo K. et al., 2015, MNRAS, 450, 3874
- Alatalo et al. (2013) Alatalo K. et al., 2013, MNRAS, 432, 1796
- Anders & Grevesse (1989) Anders E., Grevesse N., 1989, GeCoA, 53, 197
- Athanassoula & Bureau (1999) Athanassoula E., Bureau M., 1999, ApJ, 522, 699
- Baan et al. (2008) Baan W. A., Henkel C., Loenen A. F., Baudry A., Wiklind T., 2008, A&A, 477, 747
- Blake et al. (1987) Blake G. A., Sutton E. C., Masson C. R., Phillips T. G., 1987, ApJ, 315, 621
- Brouillet et al. (2005) Brouillet N., Muller S., Herpin F., Braine J., Jacq T., 2005, A&A, 429, 153
- Bureau & Athanassoula (1999) Bureau M., Athanassoula E., 1999, ApJ, 522, 686
- Bureau & Freeman (1999) Bureau M., Freeman K. C., 1999, AJ, 118, 126
- Caldwell (1984) Caldwell N., 1984, PASP, 96, 287
- Cappellari et al. (2011) Cappellari M. et al., 2011, MNRAS, 413, 813
- Castor (1970) Castor J. I., 1970, MNRAS, 149, 111
- Crocker et al. (2012) Crocker A. et al., 2012, MNRAS, 421, 1298
- Davis et al. (2013a) Davis T. A. et al., 2013a, MNRAS, 429, 534
- Davis et al. (2011a) Davis T. A. et al., 2011a, MNRAS, 417, 882
- Davis et al. (2013b) Davis T. A., Bayet E., Crocker A., Topal S., Bureau M., 2013b, MNRAS, 433, 1659
- Davis et al. (2011b) Davis T. A. et al., 2011b, MNRAS, 414, 968
- Davis et al. (2014) Davis T. A. et al., 2014, MNRAS, 444, 3427
- de Jong et al. (1975) de Jong T., Dalgarno A., Chu S.-I., 1975, ApJ, 199, 69
- Dickinson et al. (1980) Dickinson D. F., Rodriguez Kuiper E. N., Dinger A. S. C., Kuiper T. B. H., 1980, ApJ, 237, L43
- Elitzur (1983) Elitzur M., 1983, ApJ, 267, 174
- Forman et al. (1985) Forman W., Jones C., Tucker W., 1985, ApJ, 293, 102
- Gao & Solomon (2004a) Gao Y., Solomon P. M., 2004a, ApJS, 152, 63
- Gao & Solomon (2004b) Gao Y., Solomon P. M., 2004b, ApJ, 606, 271
- Goldreich & Kwan (1974) Goldreich P., Kwan J., 1974, ApJ, 189, 441
- Goldsmith et al. (1986) Goldsmith P. F., Irvine W. M., Hjalmarson A., Ellder J., 1986, ApJ, 310, 383
- Goldsmith et al. (1981) Goldsmith P. F., Langer W. D., Ellder J., Kollberg E., Irvine W., 1981, ApJ, 249, 524
- Helfer & Blitz (1997) Helfer T. T., Blitz L., 1997, ApJ, 478, 233
- Henkel & Mauersberger (1993) Henkel C., Mauersberger R., 1993, A&A, 274, 730
- Henkel et al. (1993) Henkel C., Mauersberger R., Wiklind T., Huettemeister S., Lemme C., Millar T. J., 1993, A&A, 268, L17
- Huettemeister et al. (1995) Huettemeister S., Henkel C., Mauersberger R., Brouillet N., Wiklind T., Millar T. J., 1995, A&A, 295, 571
- Kamenetzky et al. (2012) Kamenetzky J. et al., 2012, ApJ, 753, 70
- Kennicutt (1998) Kennicutt, Jr. R. C., 1998, ApJ, 498, 541
- Knapp et al. (1985) Knapp G. R., Turner E. L., Cunniffe P. E., 1985, AJ, 90, 454
- Kormendy & Kennicutt (2004) Kormendy J., Kennicutt, Jr. R. C., 2004, ARA&A, 42, 603
- Kraan-Korteweg (1982) Kraan-Korteweg R. C., 1982, A&AS, 47, 505
- Krips et al. (2010) Krips M., Crocker A. F., Bureau M., Combes F., Young L. M., 2010, MNRAS, 407, 2261
- Krips et al. (2008) Krips M., Neri R., García-Burillo S., Martín S., Combes F., Graciá-Carpio J., Eckart A., 2008, ApJ, 677, 262
- Lepp & Dalgarno (1996) Lepp S., Dalgarno A., 1996, A&A, 306, L21
- Maloney et al. (1996) Maloney P. R., Hollenbach D. J., Tielens A. G. G. M., 1996, ApJ, 466, 561
- Markwardt (2009) Markwardt C. B., 2009, in Astronomical Society of the Pacific Conference Series, Vol. 411, Astronomical Data Analysis Software and Systems XVIII, Bohlender D. A., Durand D., Dowler P., eds., p. 251
- Martín et al. (2010) Martín S., Aladro R., Martín-Pintado J., Mauersberger R., 2010, A&A, 522, A62
- Meier & Turner (2005) Meier D. S., Turner J. L., 2005, ApJ, 618, 259
- Meier & Turner (2012) Meier D. S., Turner J. L., 2012, ApJ, 755, 104
- Meijerink et al. (2007) Meijerink R., Spaans M., Israel F. P., 2007, A&A, 461, 793
- Ott et al. (2014) Ott J., Burton M., Jones P., Meier D. S., 2014, in IAU Symposium, Vol. 303, IAU Symposium, Sjouwerman L. O., Lang C. C., Ott J., eds., pp. 104–105
- Paglione et al. (2001) Paglione T. A. D. et al., 2001, ApJS, 135, 183
- Rangwala et al. (2011) Rangwala N. et al., 2011, ApJ, 743, 94
- Rickard et al. (1975) Rickard L. J., Palmer P., Morris M., Zuckerman B., Turner B. E., 1975, ApJ, 199, L75
- Roberts et al. (2011) Roberts H., van der Tak F. F. S., Fuller G. A., Plume R., Bayet E., 2011, A&A, 525, A107
- Rodríguez-Fernández et al. (2010) Rodríguez-Fernández N. J., Tafalla M., Gueth F., Bachiller R., 2010, A&A, 516, A98
- Sage et al. (2007) Sage L. J., Welch G. A., Young L. M., 2007, ApJ, 657, 232
- Sandage & Bedke (1994) Sandage A., Bedke J., 1994, The Carnegie Atlas of Galaxies. Volumes I, II. Carnegie Institution of Washington Publ.
- Sault et al. (1995) Sault R. J., Teuben P. J., Wright M. C. H., 1995, in Astronomical Society of the Pacific Conference Series, Vol. 77, Astronomical Data Analysis Software and Systems IV, Shaw R. A., Payne H. E., Hayes J. J. E., eds., p. 433
- Schilke et al. (1992) Schilke P., Walmsley C. M., Pineau Des Forets G., Roueff E., Flower D. R., Guilloteau S., 1992, A&A, 256, 595
- Scoville (2013) Scoville N. Z., 2013, in Falcón-Barroso, J. and Knapen, J. H. eds, Secular Evolution of Galaxies., Cambridge University Press, p. 491
- Sellwood & Wilkinson (1993) Sellwood J. A., Wilkinson A., 1993, Reports on Progress in Physics, 56, 173
- Sobolev (1960) Sobolev V. V., 1960, Moving envelopes of stars. Cambridge
- Solomon & de Zafra (1975) Solomon P. M., de Zafra R., 1975, ApJ, 199, L79
- Sorai et al. (2002) Sorai K., Nakai N., Kuno N., Nishiyama K., 2002, PASJ, 54, 179
- Tan et al. (2011) Tan Q.-H., Gao Y., Zhang Z.-Y., Xia X.-Y., 2011, Research in Astronomy and Astrophysics, 11, 787
- Tielens & Hollenbach (1985a) Tielens A. G. G. M., Hollenbach D., 1985a, ApJ, 291, 747
- Tielens & Hollenbach (1985b) Tielens A. G. G. M., Hollenbach D., 1985b, ApJ, 291, 722
- Topal et al. (2014) Topal S., Bayet E., Bureau M., Davis T. A., Walsh W., 2014, MNRAS, 437, 1434
- Tully (1988) Tully R. B., 1988, Science, 242, 310
- Tully & Fisher (1977) Tully R. B., Fisher J. R., 1977, A&A, 54, 661
- van der Tak et al. (2007) van der Tak F. F. S., Black J. H., Schöier F. L., Jansen D. J., van Dishoeck E. F., 2007, A&A, 468, 627
- Welch & Sage (2003) Welch G. A., Sage L. J., 2003, ApJ, 584, 260
- Wiklind & Rydbeck (1986) Wiklind T., Rydbeck G., 1986, A&A, 164, L22
- Wilson & Rood (1994) Wilson T. L., Rood R., 1994, ARA&A, 32, 191
- Wootten (1981) Wootten A., 1981, ApJ, 245, 105
- Wootten et al. (1978) Wootten A., Evans, II N. J., Snell R., vanden Bout P., 1978, ApJ, 225, L143
- Wrobel & Kenney (1992) Wrobel J. M., Kenney J. D. P., 1992, ApJ, 399, 94
- Xilouris et al. (2004) Xilouris E. M., Madden S. C., Galliano F., Vigroux L., Sauvage M., 2004, A&A, 416, 41
- Young et al. (2011) Young L. M. et al., 2011, MNRAS, 414, 940
- Zinchenko et al. (2000) Zinchenko I., Henkel C., Mao R. Q., 2000, A&A, 361, 1079
Appendix A Molecular line ratios
Tables of molecular line ratios along the discs of NGC 4710 and NGC 5866, for CO lines only and dense gas tracer lines only (Table 3) as well as CO to dense gas tracer lines (Tables 4 and 5), as described in § 4.2.
| Galaxy | Position | Ratio | Nuclear disc | Inner ring | Galaxy | Position | Ratio | Nuclear disc | Inner ring |
|---|---|---|---|---|---|---|---|---|---|
| (1) | (2) | (3) | (4) | (5) | (6) | (7) | (8) | (9) | (10) |
| NGC 4710 | - | NGC 5866 | - | ||||||
| - | |||||||||
| - | - | ||||||||
| - | |||||||||
| - | |||||||||
| - | - | ||||||||
| - | |||||||||
| - | |||||||||
| - | |||||||||
| - | |||||||||
| - | |||||||||
| - | - | ||||||||
| - | |||||||||
| - | |||||||||
| - | |||||||||
| - | |||||||||
| - | - | ||||||||
| - | |||||||||
| - | |||||||||
| - | |||||||||
| - | |||||||||
| - | - | ||||||||
| - | |||||||||
| - | |||||||||
| - | |||||||||
| - | |||||||||
| - | - | ||||||||
| - | |||||||||
| - | |||||||||
| - | |||||||||
| - | |||||||||
| - | |||||||||
| - | |||||||||
| - | - | ||||||||
| - | - | ||||||||
| - | - | ||||||||
| - | |||||||||
| - | - | ||||||||
| - | |||||||||
| - | |||||||||
| - | - | ||||||||
| - | |||||||||
| - |
Notes: ∗ The ratios of CO lines only were also measured for the intermediate region at position in NGC 4710 (see Fig. 10). These ratios are , and . The offset along the major axis (with respect to the galaxy centre) of each projected position is listed under the projected position number in column 2. The uncertainties on the line ratios are calculated from the uncertainties on the integrated line intensities using the standard error propagation formula.
| Galaxy | Position | Ratio | Nuclear disc | Inner ring | Galaxy | Position | Ratio | Nuclear disc | Inner ring |
|---|---|---|---|---|---|---|---|---|---|
| (1) | (2) | (3) | (4) | (5) | (6) | (7) | (8) | (9) | (10) |
| NGC 4710 | 12CO(2-1) / HCN(1-0) | - | NGC 5866 | 12CO(1-0) / HCN(1-0) | - | ||||
| 12CO(2-1) / HCO+(1-0) | - | 12CO(1-0) / HCO+(1-0) | - | ||||||
| 12CO(2-1) / HNC(1-0) | - | 12CO(1-0) / HNC(1-0) | - | ||||||
| 12CO(2-1) / HNCO(4-3) | - | 12CO(1-0) / HNCO(4-3) | - | ||||||
| 12CO(1-0) / HCN(1-0) | - | 12CO(1-0) / HCN(1-0) | - | ||||||
| 12CO(1-0) / HCO+(1-0) | - | 12CO(1-0) / HCO+(1-0) | - | ||||||
| 12CO(1-0) / HNC(1-0) | - | 12CO(1-0) / HNC(1-0) | - | ||||||
| 12CO(1-0) / HNCO(4-3) | - | 12CO(1-0) / HNCO(4-3) | - | ||||||
| 13CO(1-0) / HCN(1-0) | - | 13CO(1-0) / HCN(1-0) | - | ||||||
| 13CO(1-0) / HCO+(1-0) | - | 13CO(1-0) / HCO+(1-0) | - | ||||||
| 13CO(1-0) / HNC(1-0) | - | 13CO(1-0) / HNC(1-0) | - | ||||||
| 13CO(1-0) / HNCO(4-3) | - | 13CO(1-0) / HNCO(4-3) | - | ||||||
| 12CO(2-1) / HCN(1-0) | - | ||||||||
| 12CO(2-1) / HCO+(1-0) | - | ||||||||
| 12CO(2-1) / HNC(1-0) | - | ||||||||
| 12CO(2-1) / HNCO(4-3) | - | ||||||||
| 12CO(1-0) / HCN(1-0) | - | 12CO(1-0) / HCN(1-0) | - | ||||||
| 12CO(1-0) / HCO+(1-0) | - | 12CO(1-0) / HCO+(1-0) | - | ||||||
| 12CO(1-0) / HNC(1-0) | - | 12CO(1-0) / HNC(1-0) | - | ||||||
| 12CO(1-0) / HNCO(4-3) | - | 12CO(1-0) / HNCO(4-3) | - | ||||||
| 12CO(2-1) / HCN(1-0) | - | 13CO(1-0) / HCN(1-0) | - | ||||||
| 12CO(2-1) / HCO+(1-0) | - | 13CO(1-0) / HCO+(1-0) | - | ||||||
| 12CO(2-1) / HNC(1-0) | - | 13CO(1-0) / HNC(1-0) | - | ||||||
| 12CO(2-1) / HNCO(4-3) | - | 13CO(1-0) / HNCO(4-3) | - | ||||||
| 12CO(1-0) / HCN(1-0) | 12CO(1-0) / HCN(1-0) | - | |||||||
| 12CO(1-0) / HCO+(1-0) | 12CO(1-0) / HCO+(1-0) | - | |||||||
| 12CO(1-0) / HNC(1-0) | 12CO(1-0) / HNC(1-0) | - | |||||||
| 12CO(1-0) / HNCO(4-3) | 12CO(1-0) / HNCO(4-3) | - | |||||||
| 13CO(1-0) / HCN(1-0) | - | 13CO(1-0) / HCN(1-0) | - | ||||||
| 13CO(1-0) / HCO+(1-0) | - | 13CO(1-0) / HCO+(1-0) | - | ||||||
| 13CO(1-0) / HNC(1-0) | - | 13CO(1-0) / HNC(1-0) | - | ||||||
| 13CO(1-0) / HNCO(4-3) | - | 13CO(1-0) / HNCO(4-3) | - | ||||||
| 12CO(2-1) / HCN(1-0) | |||||||||
| 12CO(2-1) / HCO+(1-0) | |||||||||
| 12CO(2-1) / HNC(1-0) | |||||||||
| 12CO(2-1) / HNCO(4-3) | |||||||||
| 13CO(2-1) / HCN(1-0) | - | ||||||||
| 12CO(1-0) / HCN(1-0) | 12CO(1-0) / HCN(1-0) | ||||||||
| 12CO(1-0) / HCO+(1-0) | 12CO(1-0) / HCO+(1-0) | ||||||||
| 12CO(1-0) / HNC(1-0) | 12CO(1-0) / HNC(1-0) | ||||||||
| 12CO(1-0) / HNCO(4-3) | 12CO(1-0) / HNCO(4-3) | ||||||||
| 13CO(1-0) / HCN(1-0) | 13CO(1-0) / HCN(1-0) | ||||||||
| 13CO(1-0) / HCO+(1-0) | 13CO(1-0) / HCO+(1-0) | ||||||||
| 13CO(1-0) / HNC(1-0) | 13CO(1-0) / HNC(1-0) | ||||||||
| 13CO(1-0) / HNCO(4-3) | 13CO(1-0) / HNCO(4-3) | ||||||||
| 12CO(2-1) / HCN(1-0) | |||||||||
| 12CO(2-1) / HCO+(1-0) | |||||||||
| 12CO(2-1) / HNC(1-0) | |||||||||
| 12CO(2-1) / HNCO(4-3) | |||||||||
| 13CO(2-1) / HCN(1-0) | - | ||||||||
| 13CO(2-1) / HCO+(1-0) | - | ||||||||
| 13CO(2-1) / HNC(1-0) | - | ||||||||
| 13CO(2-1) / HNCO(4-3) | - |
Notes: The offset along the major axis (with respect to the galaxy centre) of each projected position is listed under the projected position number in column 2. The uncertainties on the line ratios are calculated from the uncertainties on the integrated line intensities using the standard error propagation formula.
| Galaxy | Position | Ratio | Nuclear disc | Inner ring | Galaxy | Position | Ratio | Nuclear disc | Inner ring |
|---|---|---|---|---|---|---|---|---|---|
| (1) | (2) | (3) | (4) | (5) | (6) | (7) | (8) | (9) | (10) |
| NGC 4710 | 12CO(1-0) / HCN(1-0) | NGC 5866 | 12CO(1-0) / HCN(1-0) | ||||||
| 12CO(1-0) / HCO+(1-0) | 12CO(1-0) / HCO+(1-0) | ||||||||
| 12CO(1-0) / HNC(1-0) | 12CO(1-0) / HNC(1-0) | ||||||||
| 12CO(1-0) / HNCO(4-3) | 12CO(1-0) / HNCO(4-3) | ||||||||
| 13CO(1-0) / HCN(1-0) | - | 13CO(1-0) / HCN(1-0) | |||||||
| 13CO(1-0) / HCO+(1-0) | - | 13CO(1-0) / HCO+(1-0) | |||||||
| 13CO(1-0) / HNC(1-0) | - | 13CO(1-0) / HNC(1-0) | |||||||
| 13CO(1-0) / HNCO(4-3) | - | 13CO(1-0) / HNCO(4-3) | |||||||
| 12CO(2-1) / HCN(1-0) | |||||||||
| 12CO(2-1) / HCO+(1-0) | |||||||||
| 12CO(2-1) / HNC(1-0) | |||||||||
| 12CO(2-1) / HNCO(4-3) | |||||||||
| 13CO(2-1) / HCN(1-0) | - | ||||||||
| 13CO(2-1) / HCO+(1-0) | - | ||||||||
| 13CO(2-1) / HNC(1-0) | - | ||||||||
| 13CO(2-1) / HNCO(4-3) | - | ||||||||
| 12CO(1-0) / HCN(1-0) | 12CO(1-0) / HCN(1-0) | ||||||||
| 12CO(1-0) / HCO+(1-0) | 12CO(1-0) / HCO+(1-0) | ||||||||
| 12CO(1-0) / HNC(1-0) | 12CO(1-0) / HNC(1-0) | ||||||||
| 12CO(1-0) / HNCO(4-3) | 12CO(1-0) / HNCO(4-3) | ||||||||
| 13CO(1-0) / HCN(1-0) | 13CO(1-0) / HCN(1-0) | ||||||||
| 13CO(1-0) / HCO+(1-0) | 13CO(1-0) / HCO+(1-0) | ||||||||
| 13CO(1-0) / HNC(1-0) | 13CO(1-0) / HNC(1-0) | ||||||||
| 13CO(1-0) / HNCO(4-3) | 13CO(1-0) / HNCO(4-3) | ||||||||
| 12CO(2-1) / HCN(1-0) | |||||||||
| 12CO(2-1) / HCO+(1-0) | |||||||||
| 12CO(2-1) / HNC(1-0) | |||||||||
| 12CO(2-1) / HNCO(4-3) | |||||||||
| 13CO(2-1) / HCN(1-0) | - | ||||||||
| 13CO(2-1) / HCO+(1-0) | - | ||||||||
| 13CO(2-1) / HNC(1-0) | - | ||||||||
| 13CO(2-1) / HNCO(4-3) | - | ||||||||
| 12CO(1-0) / HCN(1-0) | 12CO(1-0) / HCN(1-0) | - | |||||||
| 12CO(1-0) / HCO+(1-0) | 12CO(1-0) / HCO+(1-0) | - | |||||||
| 12CO(1-0) / HNC(1-0) | 12CO(1-0) / HNC(1-0) | - | |||||||
| 12CO(1-0) / HNCO(4-3) | 12CO(1-0) / HNCO(4-3) | - | |||||||
| 13CO(1-0) / HCN(1-0) | - | 13CO(1-0) / HCN(1-0) | - | ||||||
| 13CO(1-0) / HCO+(1-0) | - | 13CO(1-0) / HCO+(1-0) | - | ||||||
| 13CO(1-0) / HNC(1-0) | - | 13CO(1-0) / HNC(1-0) | - | ||||||
| 13CO(1-0) / HNCO(4-3) | - | 13CO(1-0) / HNCO(4-3) | - | ||||||
| 12CO(2-1) / HCN(1-0) | |||||||||
| 12CO(2-1) / HCO+(1-0) | |||||||||
| 12CO(2-1) / HNC(1-0) | |||||||||
| 12CO(2-1) / HNCO(4-3) | |||||||||
| 12CO(1-0) / HCN(1-0) | - | 12CO(1-0) / HCN(1-0) | - | ||||||
| 12CO(1-0) / HCO+(1-0) | - | 12CO(1-0) / HCO+(1-0) | - | ||||||
| 12CO(1-0) / HNC(1-0) | - | 12CO(1-0) / HNC(1-0) | - | ||||||
| 12CO(1-0) / HNCO(4-3) | - | 12CO(1-0) / HNCO(4-3) | - | ||||||
| 12CO(2-1) / HCN(1-0) | - | 13CO(1-0) / HCN(1-0) | - | ||||||
| 12CO(2-1) / HCO+(1-0) | - | 13CO(1-0) / HCO+(1-0) | - | ||||||
| 12CO(2-1) / HNC(1-0) | - | 13CO(1-0) / HNC(1-0) | - | ||||||
| 12CO(2-1) / HNCO(4-3) | - | 13CO(1-0) / HNCO(4-3) | - |
| Galaxy | Position | Ratio | Nuclear disc | Nuclear ring | Galaxy | Position | Ratio | Nuclear disc | Inner ring |
|---|---|---|---|---|---|---|---|---|---|
| (1) | (2) | (3) | (4) | (5) | (6) | (7) | (8) | (9) | (10) |
| NGC 4710 | 12CO(1-0) / HCN(1-0) | - | NGC 5866 | 12CO(1-0) / HCN(1-0) | - | ||||
| 12CO(1-0) / HCO+(1-0) | - | 12CO(1-0) / HCO+(1-0) | - | ||||||
| 12CO(1-0) / HNC(1-0) | - | 12CO(1-0) / HNC(1-0) | - | ||||||
| 12CO(1-0) / HNCO(4-3) | - | 12CO(1-0) / HNCO(4-3) | - | ||||||
| 12CO(2-1) / HCN(1-0) | - | 13CO(1-0) / HCN(1-0) | - | ||||||
| 12CO(2-1) / HCO+(1-0) | - | 13CO(1-0) / HCO+(1-0) | - | ||||||
| 12CO(2-1) / HNC(1-0) | - | 13CO(1-0) / HNC(1-0) | - | ||||||
| 12CO(2-1) / HNCO(4-3) | - | 13CO(1-0) / HNCO(4-3) | - | ||||||
| 12CO(1-0) / HCN(1-0) | - | 13CO(1-0) / HCN(1-0) | - | ||||||
| 12CO(1-0) / HCO+(1-0) | - | 13CO(1-0) / HCO+(1-0) | - | ||||||
| 12CO(1-0) / HNC(1-0) | - | 13CO(1-0) / HNC(1-0) | - | ||||||
| 12CO(1-0) / HNCO(4-3) | - | 13CO(1-0) / HNCO(4-3) | - | ||||||
| 12CO(2-1) / HCN(1-0) | - | ||||||||
| 12CO(2-1) / HCO+(1-0) | - | ||||||||
| 12CO(2-1) / HNC(1-0) | - | ||||||||
| 12CO(2-1) / HNCO(4-3) | - |
| Galaxy | Position | Ratio | Value |
|---|---|---|---|
| NGC 4710 | 12CO(1-0) / HCN(1-0) | ||
| 12CO(1-0) / HCO+(1-0) | |||
| 12CO(1-0) / HNC(1-0) | |||
| 12CO(1-0) / HNCO(4-3) | |||
| 13CO(1-0) / HCN(1-0) | |||
| 13CO(1-0) / HCO+(1-0) | |||
| 13CO(1-0) / HNC(1-0) | |||
| 13CO(1-0) / HNCO(4-3) | |||
| 12CO(2-1) / HCN(1-0) | |||
| 12CO(2-1) / HCO+(1-0) | |||
| 12CO(2-1) / HNC(1-0) | |||
| 12CO(2-1) / HNCO(4-3) |
Notes: The offset along the major axis (with respect to the galaxy centre) of each projected position is listed under the projected position number in column 2. The uncertainties on the line ratios are calculated from the uncertainties on the integrated line intensities using the standard error propagation formula.
Appendix B LVG Models
B.1 Model Parameters
The line ratio models discussed in § 4.3 exploit the non-LTE radiative transfer code RADEX (van der Tak et al., 2007), that uses the large velocity gradient (LVG) approximation (Sobolev, 1960; Castor, 1970; Goldreich & Kwan, 1974; de Jong et al., 1975) and calculates the intensities of molecular lines based on a statistical equilibrium involving collisional processes (excitation and de-excitation through collisions with H2), radiative processes, and the cosmic microwave background radiation ( K). The escape probability depends on the optical depths (see Sobolev, 1960) and is related to the intensity within the medium. RADEX offers three different medium geometries (sphere, uniformly expanding shell and parallel slab), although the differences between these are generally small (van der Tak et al., 2007). We adopt here the expanding shell geometry.
The main input parameters to RADEX are the molecular gas kinetic temperature , H2 volume number density (H2), species column number densities (mol), species line widths (i.e. the FWHMs of the Gaussians fitted to the spectra), and species intrinsic abundance ratios (e.g. [12C] / [13C], [HCN] / [HCO+], [HCN] / [HNC] and [HCN] / [HNCO]). By modeling the dense gas tracer lines and low- CO lines separately, we effectively adopt a two-component molecular ISM (at each projected position and for each kinematic component).
We created model grids as follows. , (H2), and (mol) are kept as free parameters to be fit for. Our grid ranges from to K in steps of K, (H2) ranges from to cm-3 in steps of dex, and (mol) ranges from to cm-2 in steps of dex. As the widths of all the lines are similar, we adopt a single (average) line width for each kinematic component and each group of lines (rather than, e.g., using the exact width of each line in each kinematic component at each position). The line widths used for the modeling were thus respectively and km s-1 for the CO and dense gas lines in the nuclear disc of NGC 4710, km s-1 for the CO gas lines in the inner ring of NGC 4710, and km s-1 for the dense gas lines in the nuclear disc of NGC 5866. Other object–line–kinematic component combinations could not be modeled (see below).
The intrinsic abundance ratios of different molecules are also important inputs to the model calculations and must therefore be chosen carefully. Roberts et al. (2011) state that the ratios of velocity-integrated line intensities are not good proxies for intrinsic abundance ratios, while the ratios of column densities are better. We therefore take here the ratios of the column densities as the ratios of the intrinsic abundances. This indicates that changes in the abundance ratios affect the column densities linearly, i.e. a change in an intrinsic abundance ratio will change the associated column densities by . The [12C] / [13C] ratio is at the centre of the Milky Way, in the kpc molecular ring, in the local ISM and in the Solar System (Anders & Grevesse, 1989; Wilson & Rood, 1994). In the active nuclear regions of nearby starburst galaxies, the [12C] / [13C] ratio is (Henkel et al., 1993; Henkel & Mauersberger, 1993; Martín et al., 2010). There is thus much variation in the intrinsic [12C] / [13C] ratio. The situation is even less satisfactory for the abundance ratios of high density tracers, since they have been much less studied in external galaxies. The [HCN] / [HCO+] and [HCN] / [HNC] ratios vary widely from source to source (Wootten et al., 1978; Goldsmith et al., 1981, 1986; Roberts et al., 2011) and there is a lack of information in the literature about the [HCN] / [HNCO] ratio. These ratios also vary from region to region within galaxies, as molecular clouds located in different regions of galactic discs may well have different physical conditions and processes at play. For example, HCO+ is enhanced by shocks, and the [HCN] / [HNC] ratio is known to vary with temperature (it increases with increasing temperature, although the abundance of each species decreases with increasing temperature and density; Goldsmith et al. 1981, 1986; Schilke et al. 1992). Roberts et al. (2011) suggest that [HCN] / [HNC] and [HCN] / [HCO+] range from to and to , respectively (at (H2) = cm-3 and – K). However, both abundance ratios are about at K. In this work, we therefore assume an intrinsic ratio of for [12C] / [13C] and for the dense gas tracers (i.e. [HCN] / [HCO+], [HCN] / [HNC] and [HCN] / [HNCO]).
Overall, this thus yields possible sets of models for each position in each galaxy: models for the tenuous molecular gas only (i.e. 12CO(1-0), 12CO(2-1), 13CO(1-0) and 13CO(2-1)) and for the dense molecular gas only (i.e. HCN, HCO+, HNC and HNCO), this for both the nuclear disc and the inner ring separately (adopting an average for each group of lines separately).
The positions along the disc of the galaxies where we apply the radiative transfer modelling are the same as those discussed in § 4.2 and illustrated in Figure 10. However, since only low- CO lines were observed in NGC 5866, these sets of models for the tenuous molecular gas would be unconstrained and are thus not computed. Similarly, the dense gas tracer lines are generally not detected in the inner ring, so these sets of models are not computed either. Overall, we thus need models for the tenuous and dense molecular gas in the nuclear disc of NGC 4710, for the tenuous gas in the inner ring of NGC 4710, and for the dense gas in the nuclear disc of NGC 5866.
B.2 Best-fitting and most likely models
Following Topal et al. (2014), we use two methods to characterise the models (i.e. the physical parameters , (H2) and (mol) of a two-component molecular ISM) best representing the data at each of the positions illustrated in Figure 10. First we use a method identifying the best-fitting model, and second a likelihood method identifying the most likely model.
For each set of model parameters, the is defined as
| (1) |
where is the modeled line ratio, is the observed line ratio with uncertainty , and the summation is over all independent line ratios at the given position (one fewer than the number of lines available at that position).
For positions where lines are detected, so line ratios are available, the is well-defined and the models are well constrained. However, for positions where at least one observed line ratio is a lower limit, we calculate the following one of two procedures. (1) For models with a line ratio larger than or equal to the observed lower limit, the is taken as , thus ensuring that all models meeting this criterion are equally likely. (2) For models with a line ratio smaller than the observed lower limit, the is calculated in the usual way, but the resultant reduced value then indicates a lower limit only, leading to an upper limit on the likelihood (see below).
Contours and grey scales of reduced (formally , where is the minimum reduced ) in , (H2) and (CO) space are shown in Figures 16 – 18. These illustrate the uncertainties of the best-fit model parameters and exhibit the usual degeneracies between physical parameters. The best-fit models () are listed in Tables 6 and 7. For positions with a line ratio lower limit where a model meets the criterion for case (2) above, the contours and greyscales are instead shown in colour, indicating a lower limit. If lies in such a region of parameter space, the best-fit model is then ill defined.
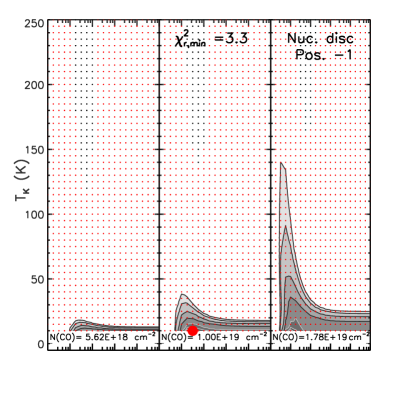
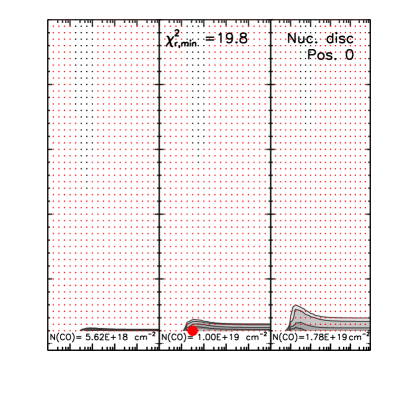
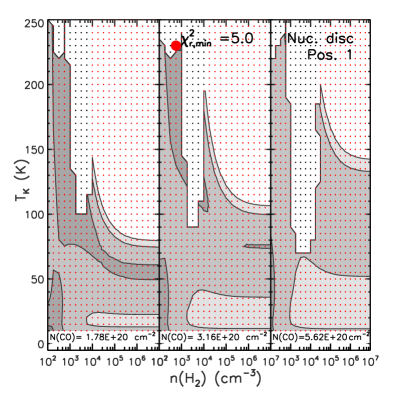
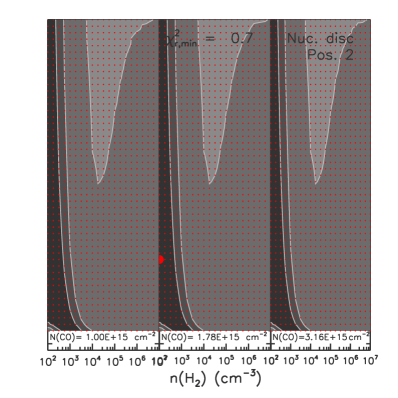
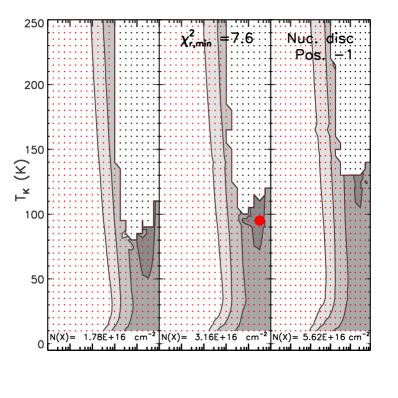
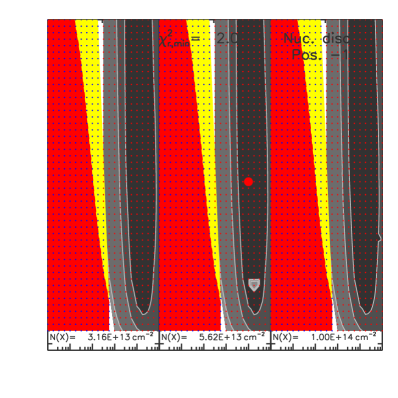
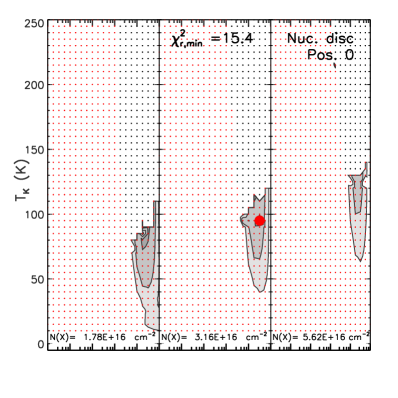
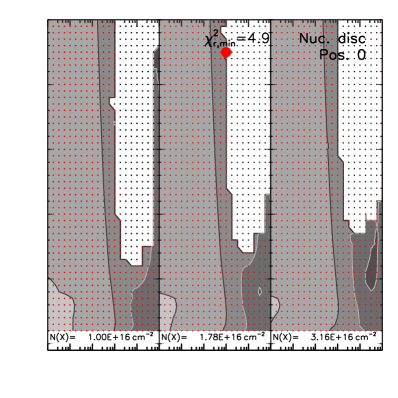
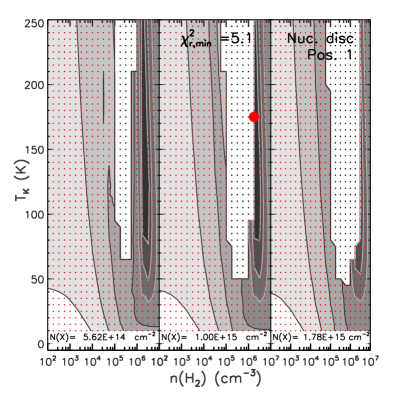
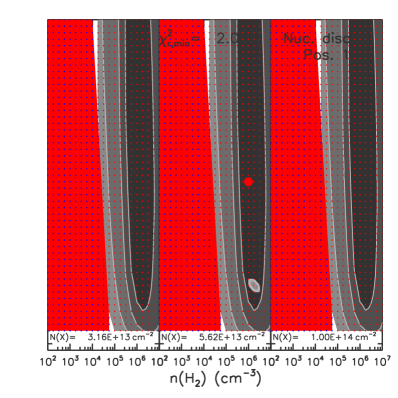
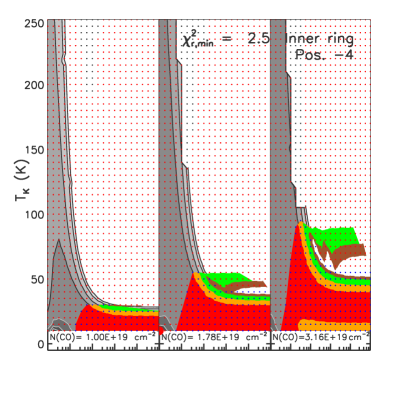
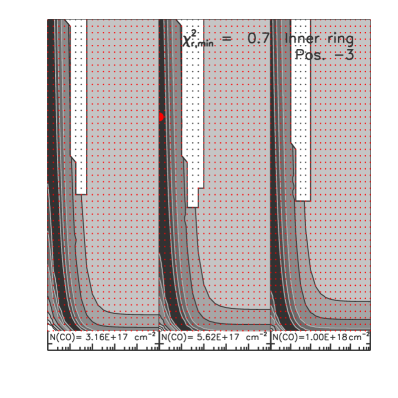
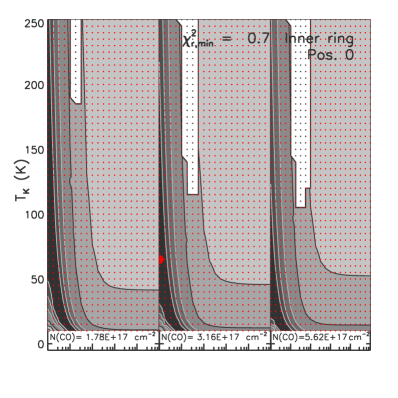
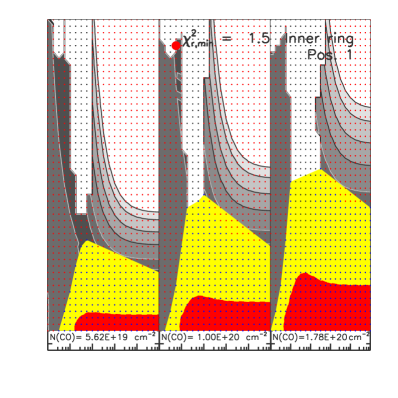
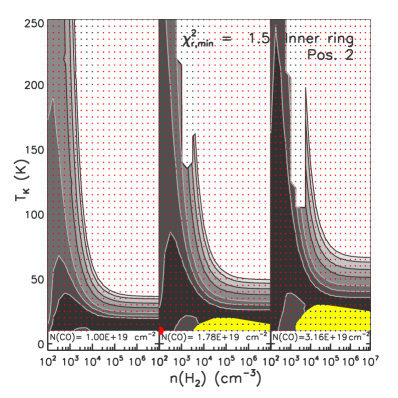
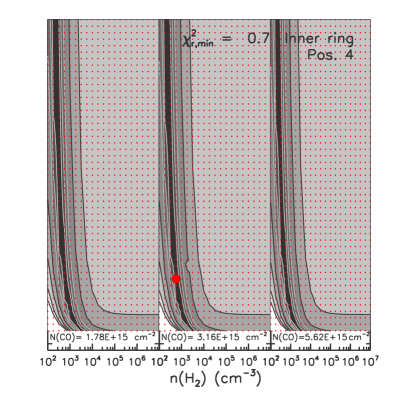
| Tenuous gas | Dense gas | |||||||
| Component | Position | Offset (′′) | Parameter | Likelihood | Parameter | Likelihood | ||
| (1) | (2) | (3) | (4) | (5) | (6) | (7) | (8) | (9) |
| nuclear disc | K | K | K | K | ||||
| ((H2)) | cm-3 | cm-3 | ((H2)) | cm-3 | cm-3 | |||
| ((CO)) | cm-2 | cm-2 | ((X)) | cm-2 | cm-2 | |||
| K | K | K | K | |||||
| ((H2)) | cm-3 | cm-3 | ((H2)) | cm-3 | cm-3 | |||
| ((CO)) | cm-2 | cm-2 | ((X)) | cm-2 | cm-2 | |||
| K | K | K | K | |||||
| ((H2)) | cm-3 | cm-3 | ((H2)) | cm-3 | cm-3 | |||
| ((CO)) | cm-2 | cm-2 | ((X)) | cm-2 | cm-2 | |||
| K | K | |||||||
| ((H2)) | cm-3 | cm-3 | ||||||
| ((CO)) | cm-2 | cm-2 | ||||||
| inner ring | K | K | ||||||
| ((H2)) | cm-3 | cm-3 | ||||||
| ((CO)) | cm-2 | cm-2 | ||||||
| K | K | |||||||
| ((H2)) | cm-3 | cm-3 | ||||||
| ((CO)) | cm-2 | cm-2 | ||||||
| K | K | |||||||
| ((H2)) | cm-3 | cm-3 | ||||||
| ((CO)) | cm-2 | cm-2 | ||||||
| K | K | |||||||
| ((H2)) | cm-3 | cm-3 | ||||||
| ((CO)) | cm-2 | cm-2 | ||||||
| K | K | |||||||
| ((H2)) | cm-3 | cm-3 | ||||||
| ((CO)) | cm-2 | cm-2 | ||||||
| K | K | |||||||
| ((H2)) | cm-3 | cm-3 | ||||||
| ((CO)) | cm-2 | cm-2 |
Notes: Likelihood results list the median values and () confidence levels. A star (∗) indicates a physical parameter lying at the edge of the model grid.
| Position | Offset (′′) | Parameter | Likelihood | |
|---|---|---|---|---|
| (1) | (2) | (3) | (4) | (5) |
| K | K | |||
| ((H2)) | cm-3 | cm-3 | ||
| ((X)) | cm-2 | cm-2 | ||
| K | K | |||
| ((H2)) | cm-3 | cm-3 | ||
| ((X)) | cm-2 | cm-2 | ||
| K | K | |||
| ((H2)) | cm-3 | cm-3 | ||
| ((X)) | cm-2 | cm-2 |
Notes: Likelihood results list the median values and () confidence levels.
We also estimate the likelihood of our models, calculating at each position the probability distribution function (PDF) of each model parameter marginalised over the other two. That is, for each possible value of a model parameter within our grid, we calculated the sum of the terms for all possible values of the other two parameters. These PDFs are shown in Figures 19 – 21, along with their peaks (most likely values), medians and () confidence levels around the median (the latter also listed in Tables 6 and 7). Again, for positions with a line ratio lower limit where a model meets the criterion for case (2) above, the likelihoods represent upper limits. If the peak of the PDFs is an upper limit, the most likely model is then ill defined.
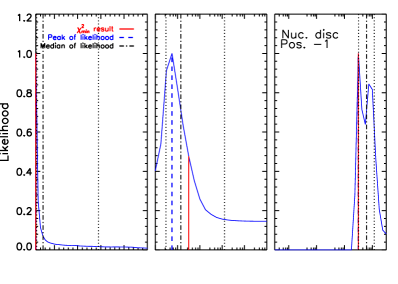
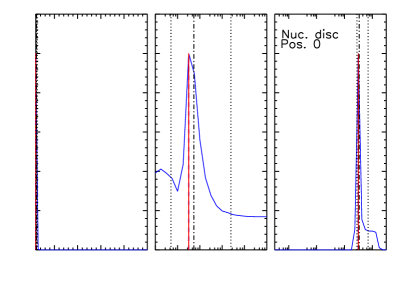
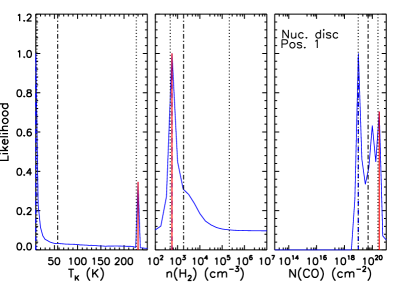
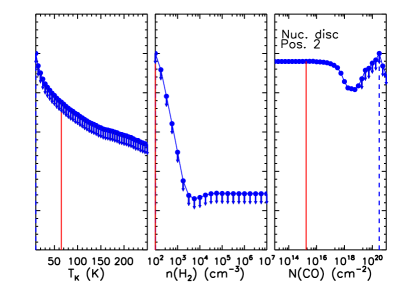
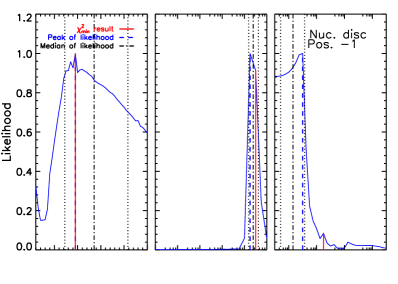
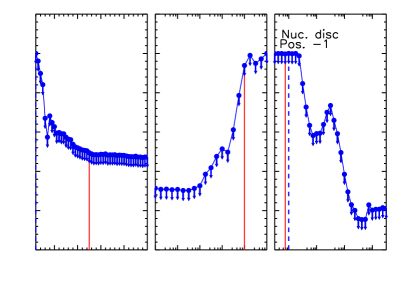
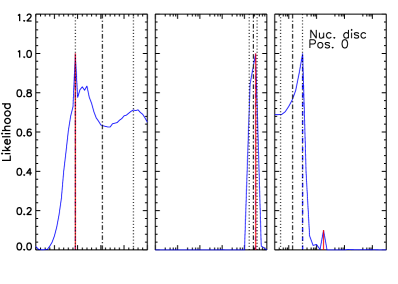
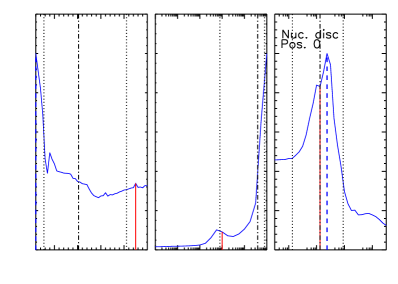
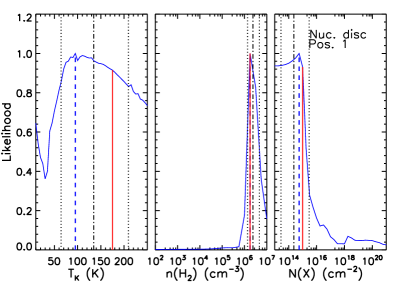
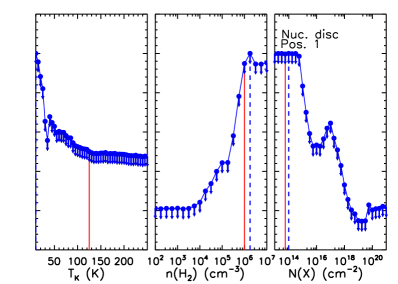
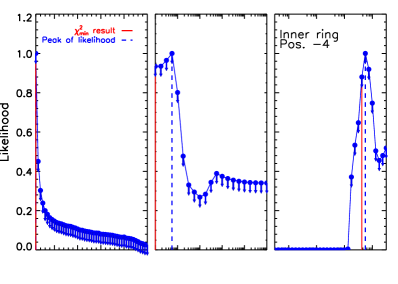
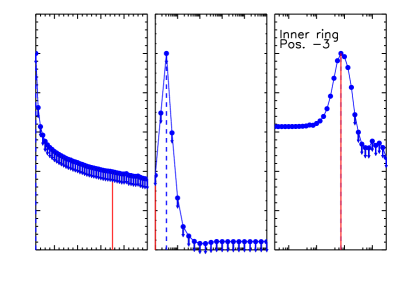
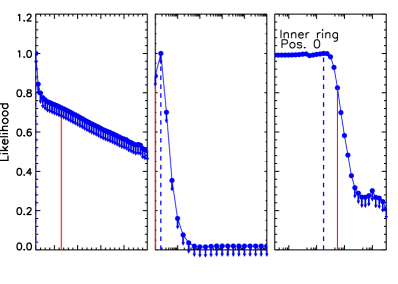
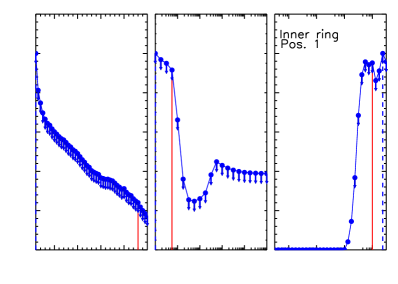
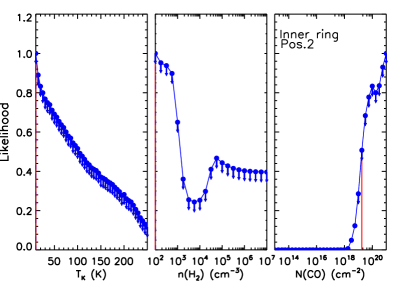
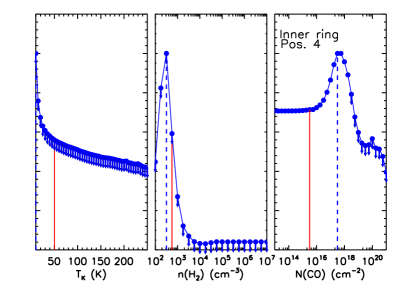
The best-fit model results generally agree well with those obtained from the likelihood analysis, in the sense that the three best-fit model parameters (, (H2) and (CO)) are generally contained within the () confidence level around the median of the PDF (or are just outside of it; see Figs. 19 – 21 and Tables 6 – 7). However, because of the flatness of the PDFs, the uncertainties in the most likely model results are rather large (particularly for ). Significant differences are found between the tenuous and dense gas components for certain parameters ((H2) and (CO)), but unsurprisingly the different positions within a single kinematic component are generally statistically indistinguishable.
The line widths used for the modeling are similar to the values used for RADEX modeling of other external galaxies in the literature (e.g. Rangwala et al., 2011; Kamenetzky et al., 2012). However, the observed line widths in the nuclear discs are combinations of the intrinsic widths of the lines and the range of rotational velocities contained within the synthesized beams. The latter effect could be dominant in the nuclear discs (while it is negligible in the inner rings), as the molecular gas rotation is increasing rapidly in these components (unrelated to the physical conditions in the molecular clouds). The true intrinsic widths of the lines in the nuclear discs should thus lie between the observed line widths in the inner rings (i.e. km s-1) and those observed in the nuclear discs. To test whether our modeling results are sensitive to the line widths adopted, we ran the nuclear disc models again using both the line widths measured in the inner rings and the average line widths of the nuclear discs and inner rings. The best-fit model results are formally different in a few positions only (and generally only the CO column densities), and the results from the three different line widths tested always agree within the uncertainties. As expected (van der Tak et al., 2007), the RADEX results are therefore only minimally affected by the line widths assumed, and possible beam smearing effects on the line widths adopted in the nuclear discs does not have a significant impact on our modeling results.