The Dynamical Response of Dark Matter to Galaxy Evolution Affects Direct-Detection Experiments
Abstract
Over a handful of rotation periods, dynamical processes in barred galaxies induce non-axisymmetric structure in dark matter halos. Using n-body simulations of a Milky Way-like barred galaxy, we identify both a trapped dark-matter component, a shadow bar, and a strong response wake in the dark-matter distribution that affects the predicted dark-matter detection rates for current experiments. The presence of a baryonic disk together with well-known dynamical processes (e.g. spiral structure and bar instabilities) increase the dark matter density in the disk plane. We find that the magnitude of the combined stellar and shadow bar evolution, when isolated from the effect of the axisymmetric gravitational potential of the disk, accounts for 30% of this overall increase in disk-plane density. This is significantly larger that of previously claimed deviations from the standard halo model. The dark-matter density and kinematic wakes driven by the Milky Way bar increase the detectability of dark matter overall, especially for the experiments with higher . These astrophysical features increase the detection rate by more than a factor of two when compared to the standard halo model and by a factor of ten for experiments with high minimum recoil energy thresholds. These same features increase (decrease) the annual modulation for low (high) minimum recoil energy experiments. We present physical arguments for why these dynamics are generic for barred galaxies such as the Milky Way rather than contingent on a specific galaxy model.
pacs:
95.35.+d, 98.62.Hr, 98.35.-a, 98.10.+zI Introduction
In the currently favored form of weakly interacting massive particle (WIMP) theory (see e.g. jungman96 ; bertone05 ), dark matter is composed of a single particle with a mass in the range of 10 , which a number of experiments are working to directly detect aprile12 ; aalseth13 ; bernabei14 ; agnese15 ; angloher16 ; akerib16 ; agnes16 ; amole16 ; tan16 ; agnese16 ; undagoitia16 . Direct-detection (DD) experiments seek to measure the weak nuclear recoils during elastic scattering between dark-matter (DM) particles and the nuclei of a target detector. The unambiguous detection of particle dark matter would address fundamental questions about the nature of the Universe, but despite considerable effort being focused on the direct detection of dark matter, a verifiable signal remains elusive. Limits on WIMP properties derived from these nondetections depend on poorly constrained parameters from astrophysics mccabe10 ; mccabe11 . The astrophysical uncertainties in the structure of the DM halo have been recently implicated as a possible resolution for the disagreement between experiments with tentative detections (DAMA/LIBRA and CDMS-Si) and the null results from experiments such as LUX and superCDMS mao13 ; pillepich14 ; bozorgnia16 ; kelso16 ; sloane16 .
[b] Model Name Designationa Radial Profile Dynamic? Core? Rotation? Standard Halo Model SHM isothermal N N N Pristine NFW pNFW NFW N N N Adiabatically Contracted NFW acNFW NFW Yb N N Fiducial Dynamical NFW fdNFW NFW Y N N Cored Dynamical NFW cdNFW NFW Y Y N Rotating Dynamical NFW rdNFW NFW Y N Y Cored Rotating Dynamical NFW rcdNFW NFW Y Y Y
-
a
Designations are used in Figures, Model Names are used in text.
-
b
Idealized evolution; see text.
Several simulation-based studies of Milky Way-like galaxies (e.g. a multicomponent model featuring at a minimum a stellar disk and responsive DM halo) have determined velocity distributions for the DM halo that differ from the so-called standard halo model (SHM), finding that the spherical density and isotropic velocity distribution assumptions underlying the interpretation of most DD experiments are unlikely to be accurate owing to the presence of substructure in the halo kuhlen10 ; purcell12 ; lisanti12 . Another class of studies primarily focus on the difference between DM-only simulations and simulations that include a stellar component pillepich14 ; bozorgnia16 ; kelso16 ; sloane16 , finding largely the same results. However, little disagreement exists between these studies regarding the expected response for DD experiments, and the underlying dynamical causes have not been thoroughly investigated.
For example, these studies have been unable to reach a consensus on the applicability of a Maxwell-Boltzmann (MB) distribution to describe the DM velocity distribution in the Milky Way (MW) near the Sun, and are roughly divided into groups that claim a MB distribution does describe the tail of the DM velocity distribution kelso16 ; bozorgnia16 , and those that find that the tail is suppressed relative to a MB distribution pillepich14 ; sloane16 .
In addition, the ‘dark disk’, an axisymmetric, flattened DM feature roughly on the size scale of the stellar disk observed in some simulations, comprises an additional component for detection read08 ; read09 ; bruch09 ; purcell09 ; ling10 ; pillepich14 , but its existence continues to be debated. However, as we show in a previous work petersen15 , a dark disk that mimics the appearance of the stellar disk is a natural consequence of the presence of a stellar disk in a DM halo, something that is obviously present in our own galaxy. The dark disk effect may be enhanced further by the disruption of satellites pillepich14 , which other studies contend may not be a generic result of cosmological simulations kelso16 . This scenario is qualitatively different from the dark disk described in petersen15 . Other studies have claimed that the DM density at the Sun’s location should differ by less than 15% from the average over a constant density ellipsoidal shell using high resolution cosmological simulations vogelsberger09 and that the density distribution is only slightly positively skewed kamionkowski08 . Yet other studies point out that many open questions remain regarding the presence of substructure near the Sun owing to either intact or destroyed subhalos read08 ; read09 ; kuhlen12 ; lisanti12 ; ohare14 . In the face of these conflicting claims, seeking fundamental effects from known Milky Way (MW) causes is a prudent approach to illuminating the information that DM halo models can provide for DD experiments.
Galaxies evolve structurally through the interaction of the baryonic matter in their disks with the DM in their halos mediated by resonant gravitational torques. The strongest evolution of this type is likely to occur in barred galaxies (i.e. galaxies with prolate stellar distributions in their central regions with lengths on the order of the disk scale length). The barred nature of the MW was first suggested in the 1960s as an interpretation of observed gas kinematics devaucouleurs64 , and subsequently confirmed through diverse observations in the ensuing half century (see gerhard02 for a review). Recent observations have indicated that the bar hosted by our MW galaxy may be significantly longer than previously thought wegg15 . Although the MW bar is known to have many consequences for observed astrophysical quantities, the bar’s effect on the DM distribution has not been considered when characterizing the DM density and velocity distribution function that determines detection rates for DD experiments.
In this paper, we present the implications of non-axisymmetric DM density and velocity distribution functions caused by the bar of the MW for DD experiments. We offer a qualitative analysis of recently published studies in an attempt to unify the seemingly disparate results. In a previous work petersen15 , we demonstrated that particles in the DM halo will be trapped into a shadow bar that resembles the stellar bar—in addition to forming a DM wake visible in both the density and velocity structure of the dark matter halo at radii on the scale of the stellar disk—the first such study that attempts to isolate the DM structure that results from interactions with the stellar bar. The effect of the shadow bar is cumulative with the expected response of an equilibrium galaxy DM halo to the presence of a stellar disk, resulting in a model for the DM halo that does not resemble the SHM. We will see that bar-driven galaxy evolution affects both the DM density and the kinematics at the Earth’s location.
Using simulations designed to study the mutual dynamical evolution of the baryonic disk and DM halo for a Milky-Way-like galaxy, we characterize the secular evolution of an initially exponential stellar disk and spherically symmetric dark matter halo. We do not consider any satellite debris or stellar streams at the solar circle freese04 ; savage06 , although these may be present. Rather, we detail significant differences from the SHM due to the stellar bar of the MW. Similar to previous studies mao13 , we find that realistic DM distributions in galactic halos can dramatically increase the predicted detection rates for high experiments. Moreover, the effects of long-term evolution in a barred galaxy further increases the tension between heavy and light nuclei experiments frandsen13 . We demonstrate key regimes in which experiments can use the DM halo structure resulting from the MW bar to their advantage. Conversely, pillepich14 report an improvement in the tension between the heavy and light nuclei experiments if the detection signal were dominated by a DM debris disk from merger events, which has a sharply decreasing velocity tail. It is possible, of course, that the MW also has a DM debris disk from a merger event. This underscores the importance of the actual MW evolutionary history to DM detection predictions and motivates further detailed study.
This paper is organized as follows. In section II, we provide the relevant details about the simulations used for this analysis, including a comparison of the simulations to the MW in section II.2. We then describe the results in section III, beginning with the density and kinematic features of the simulated galaxy in section III.1 before detailing the calculation of detection rates in section III.2. We compare to previous findings in section IV.1 (including both the SHM and empirical models), then explore the effect of our results for detection rates in DD experiments (sections IV.2 and IV.3). Section V provides a broad overview of our results and prospects for future work.
II Methods
II.1 Simulations
| Method | Scale Length (kpc) |
|---|---|
| Asymptotic Giant Branch Stars nikolaev97 | |
| COBE/DIRBE bissantz02 | 2.1 |
| G-dwarfs (-old) bovy12 | 2.01 0.05 |
| G-dwarfs (-young) bovy12 | 3.6 0.22 |
| G-dwarfs (mass-weighted) bovy13 | 2.15 0.14 |
The n-body simulations analyzed here are presented in petersen15 . We summarize the initial conditions for their relevance to the results and refer the interested reader to petersen15 for details of the simulation methodology and dynamical interpretations. We list the simulations used in this paper in Table 1.
We represent the axisymmetric disk density profile by an exponential radial distribution with an initially isothermal vertical distribution, consistent with observations of the MW bovy13 . The DM halo is a fully self-consistent, cosmologically-motivated DM halo (navarro97, , NFW) with where is the scale radius, and is the virial radius. The functional form of the NFW profile is given by
| (1) |
Observations of the central density profile in the MW are consistent with either a pure NFW profile or a cored NFW profile bovy13 . The latter choice is motivated both by observational data and dynamical theory: a cored halo is more likely to be unstable to bar formation. We therefore test exampless of both models by selecting or . We call the model with the fiducial dynamical NFW model, and use it as the primary model throughout our work. The model is called the cored NFW model. In practice, the cored halo model increases the relative disk density to halo density near the center of the simulation, while causing a variation of 20% at the approximate solar radius. We construct these initial halos without rotation, but acknowledge that true DM halos are expected to have some net rotation bullock01 ; we present two additional models with modest rotation to probe any possible effects. The and rotating models are called the rotating NFW and cored rotating NFW model, respectively.
Our simulations employ and , disk and halo particles, respectively. These values ensure there is enough phase-space coverage to model resonant torques and to resolve collective features such as stellar bars and spiral arms. The disk particles have equal mass and the halo-particle masses are assigned to satisfy both the NFW density requirement with a steeper number density distribution, . Relative to an equal-mass assignment, this improves the resolution of the mass and length scales in the gravitational potential of the DM halo by a factor of approximately 100 in the vicinity of the stellar disk, i.e. it is equivalent to the resolution of a model.
A DM halo in dynamical equilibrium will respond to the growth of a baryonic disk through dissipation. This slow-growth process is often modeled in the adiabatic limit and is called ‘adiabatic contraction’. It causes the halo density profile to become mildly oblate in response to the disk potential. To test the importance of this process, we additionally draw on the results of a simulation presented in petersen15 that artificially freezes the stellar disk profile while the DM halo self-consistently evolves. While not strictly an adiabatic process, we refer to this as the adiabatically contracted NFW model.
We also compare the dynamically evolved models listed above to the static pristine NFW model given by eq 1 with , as well as the standard halo model (SHM).
II.2 Calibrating to the Milky Way
II.2.1 Dynamical Units
[b] Method Bar Length (kpc) Bar Angle Asymptotic Giant Branch Stars nikolaev97 3.3 0.1 242∘ OH/IR Stars sevenster99 a – near-infrared photometry hammersley00 4.0 Local stellar velocities dehnen00 5.3a COBE/DIRBE bissantz02 3.5 near-infrared photometry babusiaux05 2.5 22 Red Clump Giants (UKIDSS) cabrera08 4.5 2.14∘ Methanol Masers green11 a 45∘ Red Clump Giants (compilation) wegg15
-
a
Denotes a measurement of corotation, considered to be an upper limit for the bar length.
[b] Quantity MW Value Simulation Value Scale Length, 2.01-4.00 kpc (see Table 2) 3 kpc Scale Height 0.37 0.06 kpc bovy13 0.3 kpc Disk Mass (Stellar) bovy13 Halo Mass boylan13 Virial Radius kpc garrisonkimmel14 300 kpc a 2.08-4.13 (see Table 2) 2.08-4.13 (see Section II.2.1) a 1.57-3.32 reid14 ; chatzopoulos15 (see Table 3) 1.57-3.32 (see Section II.2.1) Circular Velocity bovy12 218 km s-1
-
a
Using =8.3 kpc reid14 ; chatzopoulos15
We scale the dynamical units of the simulations to the mass of the MW halo without attempting to tune the initial conditions to produce a model that more closely matches the details of the MW (e.g. its rotation curve, bar length, and bar amplitude). We plan to more closely mimic the MW in future simulations. We select a snapshot of the simulation after initial bar formation ( Gyr) and a subsequent ‘secular evolution time’ Gyr, defined as the time after the bar has formed, during which the bar strengthens and grows in length as a result of continued angular momentum transfer by secular processes (see petersen15 ). In general, the results are qualitatively similar for all outputs after bar formation. We discuss possible variations owing to the time selection where relevant.
To better compare the MW with the simulation, we may choose to scale the Galactic radius of the solar position to the disk scale length, to the bar length, or to something in between. The first scaling is fraught with astrophysical uncertainties, such as the variation of disk scale length with metallicity. This induces a dependence on the age of the stellar population used to estimate the disk scale length. In Table 2, we list some literature measurements of the disk scale length. Comparing to our simulation, we find that the Sun could be located anywhere between two and four disk scale lengths. The uncertain location of the Sun in the phase-space of the halo has been previously described as a large source of uncertainty mao13 . We, therefore, report a range of results that correspond to the uncertainty for the location of the Sun in this model. As noted in petersen15 , further study of the MW bar history will reduce uncertainties related to scaling simulations to the MW.
Scaling to the length of the bar better represents our goal of studying the influence of the bar on the DM distribution at the solar position. Nevertheless, calibration to the bar is also uncertain owing to the diversity of parameter measurements for the MW bar in the literature. In Table 3, we list bar parameters measured for the MW. Using this scaling, the Sun is located between 1.57 and 3.32 bar radii. We choose a nominal scaling of 2 bar radii for the Sun as a compromise between measurements of the disk scale length and bar radii. Additionally, wegg15 presents a bar mass in the range of , or (using the scaling from bovy13 ). This broadly agrees with the bar mass in the simulation at , which we find to be .
Since the Sun is measured to be only 25 pc above the disk midplane juric08 , and this is smaller than the resolution scale of our simulation, we will consider the Sun to be in-plane for the purposes of our calculations here. In practice, this introduces errors below the 1% level. Throughout the paper, in-plane refers to . As in previous simulation-based studies kuhlen10 ; purcell12 ; pillepich14 , we define a region of interest around the solar neighborhood from which to draw velocity samples. To achieve an accurate velocity distribution with the desired spatial sampling, we create wedges 1 kpc in radius, 2 kpc in height, and in azimuth. In addition, we sum 20 phase space outputs (total ) near in a frame of reference rotating with the stellar bar, to decrease the noise further. Each bin has particles.
We caution that the scalings presented in this paper are tied to the virial mass of the Milky Way DM halo, with a linear scaling in density, but a much more complex and poorly understood effect on the velocity structure. We choose a virial halo mass of , as determined from the motion of the MW satellite Leo I boylan13 . Local stellar kinematics imply a halo mass of bovy12 and suggests a factor of two uncertainty in this calibration. In addition, the rotation curve in our model deviates from the estimates of the MW rotation curve in bovy13 ; the rotation curve in our simulation is slowly rising inside of three disk scale lengths rather than flat. We cannot comment quantitatively on the importance of the relative disk-to-halo potential contribution in the inner galaxy, a quantity that is poorly constrained in the MW as well bovy13 .
II.2.2 Velocity Definitions
The velocity of the Earth in the MW relative to the galaxy’s inertial frame is the sum of three terms
| (2) |
where is the local standard of rest (LSR), is the peculiar motion of the Sun, and is the relative motion of the Earth. It is traditional to define the LSR as the mean motion of stars in the neighborhood of the Sun on a hypothetical orbit about the center of the Galaxy. This hypothetical orbit need may not circular, although circularity is often assumed. We define the three velocity directions in the LSR frame as follows: points toward the Sun from the Galactic Center, points in the direction of Galactic rotation, and points perpendicular to the Galactic disk. The first velocity in equation (2) is the velocity of the LSR relative to the Galactic Center. We adopt km s-1bovy12 . The second term is the motion of the Sun relative to the LSR, the peculiar velocity, defined as schonrich10 , though somewhat larger values of km s-1schonrich12 and km s-1bovy12 have been reported. The third term is the motion of the Earth in orbit around the Sun, for which we follow lewin96 . For the purposes of this study, we will consider only the velocity maxima and minima for the alignment and anti-alignment, respectively, of the Earth’s velocity with the LSR motion. These epochs provide the largest kinetic energy difference and occur on approximately June 1, km s-1, and on December 1, km s-1, using the standard speed for the Earth of 27.79 km s-1. This simple parameterization of the Earth’s velocity relative to the Sun avoids the discrepancy in lewin96 pointed out by lee13 ; mccabe14 .
We scale the simulations to select as the azimuthal velocity at the solar radius, as chosen in section II.2.1. The scaling to the (as well as the corresponding peculiar motions of the Sun relative to LSR) comprises the largest uncertainty in our comparison, but we emphasize that the relative importance of the shadow bar for the direct detection of DM remains unchanged.
II.2.3 Summary of Key Differences
The fiducial dynamical NFW model results in a barred galaxy that has many properties similar to the MW. However, we identify two potentially important differences:
-
1.
The fiducial model does not have a flat rotation curve at the solar circle in contrast to observations bovy13 , and thus the tuning of velocity in the simulation to that of the MW may have some systematic errors. The choice of affects the width of the calculated speed distribution through the dispersion.
-
2.
The ratio of the length of the bar to the disk scale length may suggest a different (i.e. triggered) origin for the MW bar, possibly from an orbiting satellite such as the Sagittarius dwarf purcell11 or the Large Magellanic Cloud whereas our simulation forms a bar in isolation.
We comment on the possible effects of these differences at relevant points throughout the paper, and again stress that the model has not been specifically tuned to the MW, but should rather be considered MW-like. Table 4 provides a concise comparison of measured MW parameters to the simulation parameters, valid for all NFW-derivative halo models.
III Results
We begin this section by reporting the salient differences between static and dynamically evolving galaxy models that affect the DD rate. We describe the DM density and velocity variations in response to the bar in section III.1. We compute the detection rates in section III.2. In this section we restrict our analysis to the fiducial dynamical NFW model, comparing to other models in sections III.2.2, III.2.3, and IV.1.1.
III.1 Dark Matter Distribution Features
We begin with a discussion of the self-consistent response of the DM halo to a bar-unstable disk. There are two clear deviations from a spherical distribution: flattening (Section III.1.1), and non-axisymmetric contributions due to the bar (Section III.1.2). We then analyze the velocities and speed distribution in Section III.1.3.
III.1.1 The Dark Disk
As a first characterization of the halo structure, we compute the ellipsoidal axes by diagonalizing the moment of inertia tensor as in allgood06 . Similar to the findings of kuhlen07 , we find that the halo becomes flattened owing to the presence of the disk with at the chosen solar radius, where and are the minor and major ellipsoidal axes, respectively. We find that at the chosen solar radius for the adiabatically contracted NFW model. Fitting a disc and NFW halo model potential to the vertical structure of halo giant stars in the MW suggests at the solar circle bienayme14 ; piffl14 , a smaller deviation from spherical than our findings. However, this ratio is poorly constrained by presently available data. The apparent disagreement may reflect the complexity of modeling the DM distribution from stellar data more than a problem with our models. For example, the halo stars at large distances from the disk are likely the result of hierarchical formation and satellite accretion and are unlikely to be affected by the environmental processes that affect DM near the disk in our simulation.
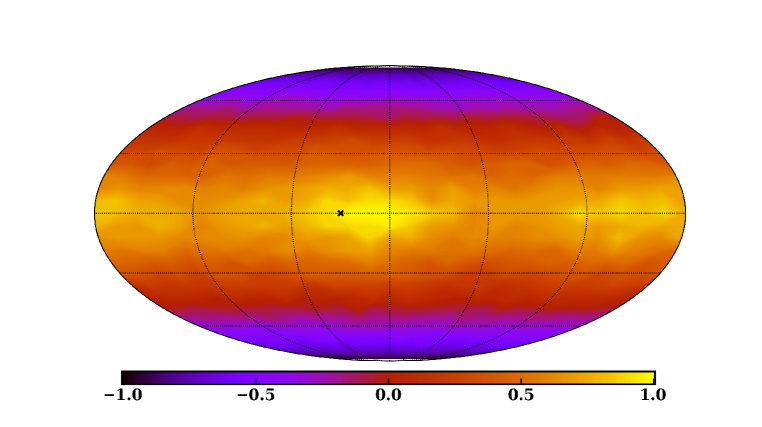
Figure 1 illustrates the deviation from a spherical distribution by showing a Mollweide projection of the relative density on a sphere at the solar radius: . The approximate position of the Sun is marked, showing that the Sun resides in a strongly over-dense region in our simulation relative to the spherical average. Two effects are clearly at play in causing the density of the DM halo to deviate from spherical. The first is the compression towards the disk plane, which is clearly seen as a gradient from low latitude to high latitude. The second, variations in longitude (non-axisymmetric structure), will be discussed in the following section.
The compression of the halo to an oblate figure is caused by two independent dynamical effects. The first, adiabatic contraction, is a response of the spherical halo to the potential of the embedded stellar disk. However, as noted above, , i.e., the fiducial dynamical NFW model is more oblate than the adiabatically contracted NFW model. This extra contraction is caused by the bar, which torques the halo through secular resonant interactions (see petersen15 for further dynamical details). decreases as increases, suggesting that the in-plane density may not have been as large in the past.
We refer to the enhanced (in-plane) contraction as the dark disk owing to its phase space resemblence to the stellar disk, while noting that previous works have used this term to refer to shredded satellites that contribute DM in a kinematic disk-like structure read08 ; bruch09 ; read09 ; purcell09 ; pillepich14 . The similarity of the DM distribution to the stellar distribution at corresponding radii is discussed in section III.1.3 and extensively in petersen15 . As discussed in petersen15 , the primary driver of large-scale aspherical structure in the DM halo is the combination of the stellar disk and bar. We do not find any evidence for the claim that the presence of baryons in a simulation will make the halo more spherical kelso16 .
III.1.2 The Shadow Bar and Density Wake
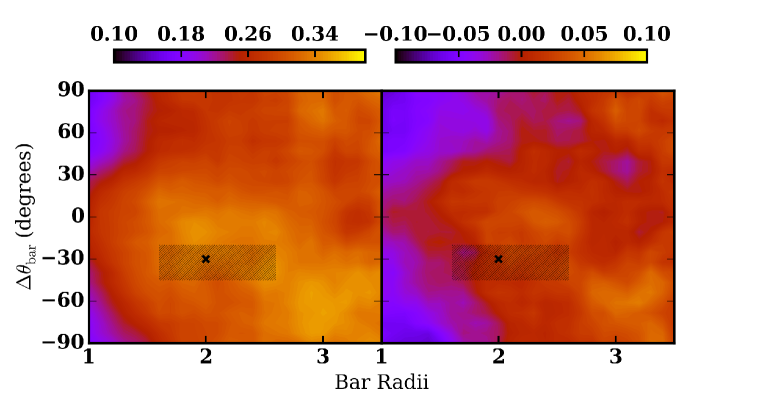
In addition to the dark disk creating an axisymmetric overdensity, the stellar and dark-matter shadow bar create non-axisymmetric density variations that correspond to a global quadrupole. This response of the DM halo to the stellar bar results in a collisionless wake; this wake appears as a diffuse spiral (see Figure 6 of petersen15 for details). The effect of this DM feature is readily seen in Figure 2, which plots the in-plane relative DM density as a function of bar radius and bar angle. When comparing the fiducial NFW model to the pristine NFW distribution (left panel), we see a clear density enhancement at a 15% level everywhere, peaking at 40% lagging just behind the bar at two bar radii. At the approximate solar location, we find a 35% enhancement relative to a spherical distribution.
When we compare to the adiabatically contracted NFW model to isolate the effects of the stellar and shadow bar (right panel), we find that the fiducial NFW model exhibits an over density along the bar major axis relative to the minor axis of approximately 15% at at the solar circle, corresponding to % of the total effect when compared to the difference between the fiducial NFW and pristine NFW models. The fiducial dynamical NFW model has an average of 10% (30%) greater density everywhere when compared to the adiabatically contracted NFW model (pristine NFW model). The fiducial model has a lower azimuthally-averaged density within two bar radii, caused by the transport of angular momentum from the stellar disk, making the DM orbits gain in net angular momentum and thus experience some radial expansion.
III.1.3 Dark Matter Kinematic Wake
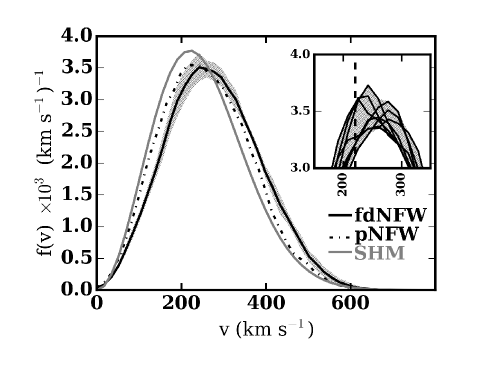
In Figure 3, we plot the speed distribution at the solar circle. We choose the solar circle as nine regions of interest centered at each combination of bar radii and . We plot the speed distribution for the SHM, which is a MB distribution centered at 220 km s-1, as a dashed line for comparison. The peak of the speed distribution shifts upward, and is now between 230 and 280 km s-1 with more populated tails than in the standard MB distribution. The shift in the peak relative to the SHM is caused by a non-isotropic velocity structure in the DM halo, which is evident in Figure 4.
The shape of the distribution depends on both the initial phase-space distribution and the galaxy’s evolutionary history, so we can not provide a generic parametrization at this time. The magnitude of the wake increases with , meaning that an older bar with more time to transfer angular momentum to the halo will enhance the azimuthal velocity of orbits in the halo.
Similar to pillepich14 , we opt not to fit a MB distribution to the peak of the speed distribution. As noted by mao13 , the MB distribution does not provide a good fit to the speed distribution. We demonstrate in section III.2 that the underlying reason a MB distribution is a poor descriptor for our DM velocity distribution owes to a combination of adiabatic contraction and the stellar+shadow bar. The underlying distribution may not be well described by a single fitting-function parametrization dependent upon escape velocity (e.g. mao13 ).
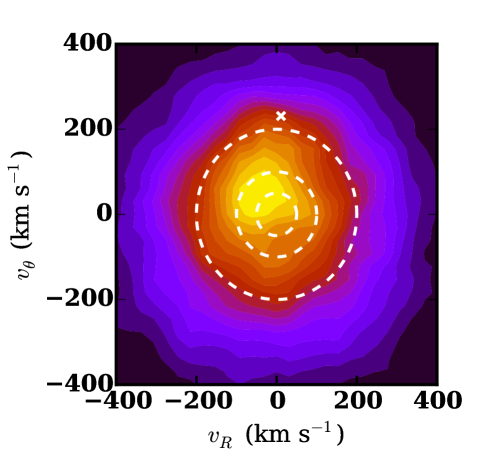
In Figure 4, we plot the distribution of the radial () versus azimuthal () velocity components in galactocentric coordinates. The shift in the peak of the azimuthal velocity distribution, shows that the dark disk has gained net rotation. In addition, the peak in radial velocity has been decreased owing to the DM wake induced by the bar (). A similar analysis performed on the adiabatically contracted NFW model yields a nearly isotropic distribution. Thus, the bias of the velocity distribution to higher tangential velocities and lower radial velocities solely owes to the non-axisymmetric evolution of the disk, i.e. the bar, without a net gain in angular momentum.
Despite concerns that the dark disk could inhibit direct detection of DM billard13 by causing 10-50% of the DM at the solar radius to co-rotate (consistent with our findings), we find that the formation mechanism of the dark disk increases the tails of the velocity distribution and, thus, increases the fraction of particles with velocities greater than prospective values of . The speed distribution is shifted to significantly higher velocities, with the tail falling more steeply than that of the SHM, similar to the findings of several studies mao13 ; pillepich14 ; sloane16 . The implications of the tails for DD experiments are discussed in section III.2.
In summary, we find that the stellar+shadow bar causes the halo in our simulation to deviate from the standard halo model in three important ways: (1) the presence of the stellar disk potential causes the halo to contract toward the plane, producing an oblate spheroid; (2) the stellar+shadow bar causes a density enhancement along the bar axis; and (3) the stellar+shadow bar causes a further contraction toward the plane and a non-isotropic velocity distribution by transferring angular momentum to the dark disk. Future simulations matched in detail to the MW will be able to provide a more nuanced understanding of the shape and structure of the speed distribution.
III.2 Dark Matter Detection Rates
In this subsection, we present computations for the DD rates, as well as a physical justification for the observed phenomena. We first discuss the detection of DM in general, then move to the fiducial dynamical NFW model, the adiabatically contracted NFW model, and the pristine NFW model (sections III.2.1 and III.2.2, respectively). We also qualitatively discuss the results of other halo models presented in petersen15 (section III.2.3). Taken together, these sections implicate the self-consistent dynamical evolution in the fiducial model as the driver of the observed variation in expected detection rates, the principal finding of this work.
Following other studies that compute the magnitude of these effects for DD experiments (e.g. kuhlen10 ; purcell12 ), we calculate differential event rates, in counts per day per unit nucleus mass per unit exposure time per unit velocity (cpd/kg/( km s-1)), as a function of the minimum velocity () using the new density and speed distributions obtained from the simulations:
| (3) |
where is the spin-independent WIMP cross-section for scattering on a proton, is the WIMP density in the solar neighborhood, is the WIMP mass, is the WIMP-nucleus reduced mass, and the quantity is the integral in velocity space of the speed distribution divided by the WIMP speed,
| (4) |
The threshold speed, , can be translated to the nuclear recoil energy via the relation for calculating specific experimental detection rates. In the interest of exploring the astrophysical variations, we ignore the nuclear form factor and dependence on recoil energy , as well as detector atomic mass number , which would both typically influence the detection rates. Instead, we restrict our analysis on the detectability of DM to the astrophysical quantities, and . We also restrict our analysis to the range of and throughout the rest of this section. These benchmark rates can simply be scaled for different values of , , , and as dictated by detections and individual experiments.
In the following subsections, we examine and describe the results from the individual models in detail, pointing out the physical mechanisms responsible for the observed rates.
III.2.1 Fiducial Dynamical NFW Model
Calculating the detection rates hinges on accurately determining the product of and . We have presented the magnitude of the density variations from spherical in sections III.1.1 and III.1.2. We find that the in-plane value can be increased by 50% relative to the spherical average, while the azimuthal variations can add up to an additional 40%. The deviation from an isotropic velocity distribution was discussed in Section III.1.3; both the shift of the peak and the modification of the high-speed tail changes the DM detectability. At low , the increase in non-spherical density dominates the signal, while at high , the deviation from an isotropic velocity distribution significantly enhances the signal.
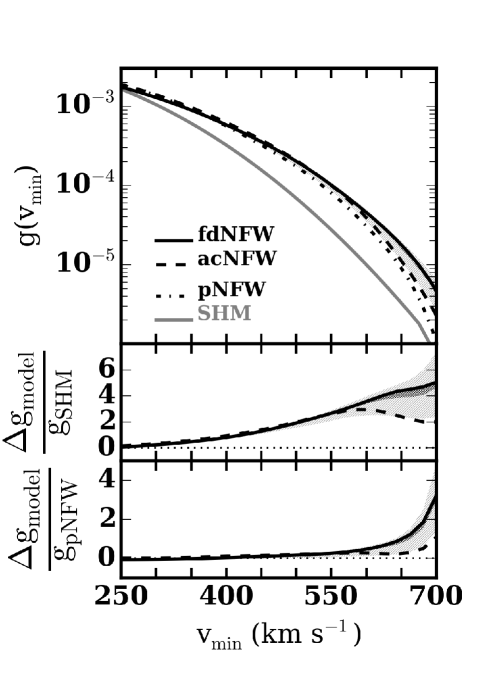
In the upper panel of Figure 5, we plot as a function of . The distribution at the solar position as calculated from the simulation is shown as a solid black line. Uncertainties in the azimuthal position of the Sun are represented by the dark gray shaded region, while uncertainties as a result of the combination of both the radial and azimuthal uncertainty are represented as the light gray shaded region. The radial uncertainty of the solar position relative to the length of the bar causes significant deviations, with a trend to lower as the radius increases. The azimuthal uncertainty is also significant, even for a single choice of the solar radius. The value of increases as the angle to the bar decreases, peaking when just slightly lagging the bar (at a position angle of ). The uncertainty increases greatly at , the result of a strong velocity distribution component, as illustrated by the uncertainty in the speed distribution based on choice of location (see Figure 3).
In Figure 5, the dot-dashed and dashed black lines depict for the pristine NFW profile and the adiabatically contracted NFW model, respectively. These will facilitate comparisons with all DM-detection experiments and can help to isolate the effect of the dark disk and the shadow bar. We analyze this further in section III.2.2. The SHM model is shown as the solid gray line, which will be discussed further in section IV.1.1.
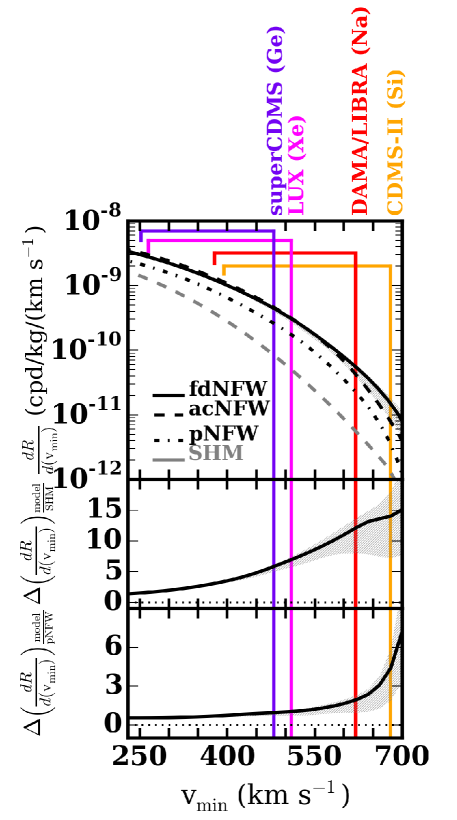
In Figure 6, we present the detectability of DM for the simulations presented in petersen15 . We use equation 3 to calculate as a function of . The absolute detection rates are scalable for different nuclear and DM parameters, but the dominant shape of the curve is given by and . The curves are plotted using the same scheme as in Figure 5. For ease of interpretation, Figure 6 also has vertical lines indicating experimental detection limits at GeV (as well as a horizontal line to indicate the values as increases to 10 GeV, at the left edge of the line), discussed further in section IV.2.
While both and increase with , the corresponding scaling change required to hold the bar radius fixed (as discussed in Section II.2.1) leads to a decrease in with increasing . Thus, the overall results for are not strongly dependent on , despite the dependence of the individual factors on . An accurate age and formation history for the MW bar will lead to a more precise prediction.
In general, an enhancement relative to the SHM qualitatively means that exclusion in space becomes more stringent. However, the subtleties of the shape of (see Figure 5) make placing experiments on the plane difficult. From equation 3, we see that the variation of with implies that for a fixed number of detections , will have an inverse dependence on for low .
III.2.2 Idealized NFW models
We compare the fiducial dynamical NFW model to idealized NFW models. First, we discuss the results as compared to the pristine NFW profile, then discuss the adiabatically contracted NFW model.
The pristine NFW profile (eq. 1) is already demonstrably different from the SHM, in both and or (this is discussed further in section IV.1.1). To understand the effect that the dark disk and shadow bar have on the detectability of DM, we compare to the pristine NFW profile rather than to the SHM. The relative enhancement factors for the fiducial dynamical and adiabatic contraction NFW models are depicted in the lower panels of Figures 5 and 6. We find that the pristine NFW profile largely describes below and to within 50% up to , above which the fiducial model turns up sharply and the adiabatically contracted model turns up slightly. The sharp upturn of the fiducial model owes to the response of the DM particles to the bar. However, the bottom panel of Figure 6 shows that the density increase enhances the detectability relative to the pristine NFW profile. When the fiducial model is compared to the adiabatically contracted model (the solid gray line in Figure 5), we see that the effect is roughly the same below , implying that the variation owes primarily to the dark disk, an effect present in both simulations. In Figure 6, the fiducial and adiabatically contracted models are largely the same below . Above , the fiducial and adiabatically contracted models deviate, indicating that the effect results from the wake. The value above which the adiabatically contracted model and the fiducial model diverge varies weakly with the secular evolution time, . As increases, the point of deviation moves to lower . As the in-plane DM density is approximately 10% larger in the fiducial model, an offset exists between the two models, but the value where the two models begin to deviate is the same as in Figure 6.
In addition, the range in owing to solar position uncertainties increases with , indicating that predicting detection rates at high may be particularly difficult until the MW bar parameters are more precisely constrained. As discussed in Section III.2.1, the range in these ratios owe solely to the fact that the uncertainty in the angle and radius of the solar position relative to the bar are large. Constraining the radial and angular position of the Sun relative to the MW bar, as well as the fundamental parameters of the MW bar, is crucial to accurately predicting the DD rates.
III.2.3 Cored and rotating NFW models
In section II.1, we discussed the selection of the fiducial NFW model in a cosmological context, noting that other halo models could also meet the cosmological criteria. In this section, we describe variations that result from changing this choice. Details of the supporting simulations are presented in petersen15 .
For the cored NFW profile, the speed distribution peaks at even higher speeds than the fiducial NFW model presented in Figure 3, up to . The broadness of this distribution leads to an even larger detectability compared to the SHM, up to a factor of 25 at . Interestingly, the radial velocity peak is not significantly shifted (in contrast to for the fiducial NFW model). This suggests that the shift in the speed distribution owes to an increase in the azimuthal velocity as a result of rapid angular momentum transfer during bar formation in this simulation (see petersen15 ).
The rotating halos demonstrate similar radial velocity shifts to their nonrotating counterparts. Specifically, the fiducial and rotating NFW halos both peak at smaller radial velocity than their cored counterparts. However, the azimuthal velocity peaks for both rotating models are shifted to significantly higher values, 100 km s-1 for some possible solar positions. This shift owes to additional angular momentum transfer that creates an even larger density in the galactic plane, which can begin to rotate like the stellar disk. The speed distributions for the rotating models demonstrate a clear shoulder where the dark disk contribution provides an excess signal near , similar to the findings in purcell12 for a particularly strong dark disk. Thus, the rotating models are the easiest to detect, adding an additional 50% enhancement in over their non-rotating counterparts (see Figure 5).
While each model is cosmologically consistent, rotating and non-rotating models may represent qualitatively different initial conditions in a cosmological setting. For instance, if the presently observed stellar bar is not the first bar to have formed in the MW, the DM halo may be imprinted with a relic response to a bar or other strong bisymmetric structure (e.g. spiral arms) from the past that have decayed or dissipated since those early times. Further study of the history of the MW bar and the stellar populations in the disk may help determine the formation time of the MW bar and the likelihood that either a previous bar existed or that the current bar had significantly different parameters in the past. A triggered bar may begin as a longer structure and subsequently shrink–in such a scenario, the non-isoptropies generated by such an ancient bar may remain in the halo, adding further substructure that is not present in our isotropic initial conditions.
IV Discussion
We begin this section with a discussion of our results in the context of the literature (section IV.1), then discuss the implications of our fiducial model for DD experiments, first as absolute sensitivities in section IV.2, then for experiments that are sensitive to annual modulations in section IV.3.
IV.1 Literature halo models
The DD literature is largely dominated by use of the SHM. To connect with those results, we analyze our models and the results presented in III.2 and compare to the SHM. In the absence of measurable density and velocity profiles for the MW DM halo, the SHM has been used as a benchmark. However, extensive reports exist in the literature (e.g. kuhlen10 ; purcell12 ; pillepich14 ) regarding the inaccuracy of this model compared with cosmological simulations, though recently, studies have claimed that the SHM may be a viable model bozorgnia16 ; kelso16 . In these studies, empirical halo models have been used to constrain the parameter space for dark matter properties in the plane. We qualitatively discuss the results of those works in section IV.1.2 and attempt to reconcile the results using the physical explanations presented in section III.2.
IV.1.1 The Standard Halo Model
The SHM has a density profile of to satisfy the requirement of a flat rotation curve at the solar circle, normalized such that is the density at the solar circle, with an isotropic velocity distribution given by a MB distribution
| (5) |
with and . Because the MB distribution has infinite tails, the SHM typically includes a truncation for the galactic escape speed, either by using an error function or by subtracting a MB distribution with a velocity . Several studies have investigated the galactic escape speed using stellar kinematics, with findings ranging from piffl14 to smith07 to piffl14a .
We will compare the SHM to the fiducial dynamical NFW model by choosing to be the highest velocity particle in the simulation, and note the effect of a lower galactic escape speed where relevant (see lavalle15 for an investigation of the explicit effects of escape speed choice). Conversely, some simulation particles will have speeds higher than the nominal escape velocity. Although these may be transient particles that are not bound to the DM halo, these particles will still contribute to the signal. This is likely for the real MW as well and thus motivates our choice to depart from literature choices of for the purpose of this comparison, and instead apply our own empirical to perform the analysis. This may be a large source of the disagreement between these findings and other works.
The middle panels of Figures 5 and 6 demonstrate the strong detection enhancement for the fiducial NFW profile relative to the SHM. Figure 5 presents the effect of the velocity structure alone. Figure 6 compares the computations of Equation 3 and describes the effects of both the velocity and the density; i.e., the total effects of the more realistic NFW halo model. Owing to the broadening in the model speed distribution when compared to the SHM, is enhanced for all and increases with increasing . Figure 5 shows that the velocity distribution function alone yields a factor of four increase at high , steadily increasing for all . Figure 6 shows that the estimates for DM detection rates may be 20 times larger than the SHM estimates for some experiments as a result of the strong enhancements of and .
Best-fit MB distributions will indeed overpredict the tail of the velocity distribution, consistent with findings in the literature sloane16 . However, the SHM is not measured as a best-fit MB distribution, but rather a specific evolution-dependent distribution as described in section III.2.1. While using a parameterization for the velocity distribution that includes may be tempting to ease the tensions between lighter and heavier nuclei experiments, our results indicate that there is little dynamical reason to expect a strong dependence of the shape of the velocity distribution on . Additionally, the tensions between ligher and heavier nuclei experiments cannot be resolved with our models.
IV.1.2 Simulation-based models
We first discuss the reported simulated DM density and velocity distributions in the literature before making a direct comparison to our work. We then discuss potential dynamical reasons for the differences.
In the absence of strong constraints on the DM density at the solar circle, simulations which attempt to match various other parameters to define a ‘MW-like’ galaxy have a variety of DM densities at the solar circle. In particular, while some studies explicitly discuss the presence of a dark disk purcell12 ; pillepich14 , others find no evidence for a dark disk kelso16 , and others still find a dark disk in some simulations but not others bozorgnia16 ; sloane16 . No previously reported simulations attempt to characterize the dependence of DM density on azimuth.
In addition to the variations in DM density, the reported velocity distributions of the simulations vary considerably. Generally, studies seek to explain the speed distribution through a parameterization at least reminiscent of the MB distribution. Upon inspection of various velocity components in this work (see section III.1.3), it is not clear why a MB-derived one-dimensional speed distribution should be expected. In examining literature examples, each dimension of the velocity distribution appears to depart from Gaussians.
An attempt to find an empirical form to describe a halo velocity distribution function led to the result of mao13 , which parametrizes the speed distribution as a function of the escape velocity and a parameter that controls the steepness of the tail of the distribution, such that the tail approaches an exponential distribution at low velocities instead of a Gaussian. pillepich14 find that the speed distribution parameterization of mao13 fits their empirical velocity distributions better than the SHM.
In addition to the fully self-consistent simulations in mao13 and pillepich14 , fornasa14 constructed a model that allowed for an anisotropic velocity distribution in the DM of the MW, and used an extended Eddington inversion formalism to calculate the distribution function including the separate mass components of the MW (stellar disk, bar, bulge, interstellar medium, DM halo). Relaxing the assumption of isotropy by including different mass components increased the parameter space of , including a factor of 2 change in the high-velocity tail. These results are consistent with the phenomenological -body simulation parametrization of mao13 .
In light of our findings presented in this paper (section III.1), we discuss the compatibilities of our results with the simulations discussed above. The largest difference between previous empirical halos and our work is the inclusion of the bar dynamics and its resulting DM response. In particular, several papers with which we compare results analyze galaxies with no apparent bar vogelsberger09 ; kuhlen12 ; pillepich14 ; bozorgnia16 ; kelso16 ; sloane16 . Previous studies have also focused on contributions from a dark disk read08 ; read09 , tidal streams vogelsberger09 ; kuhlen12 ; ohare14 , and debris flows kuhlen12 ; lisanti12 .
Regardless of the included prescriptions for various astrophysical processes or included components, simulations must adequately describe gravity and address the findings presented here (the dark disk and kinematic structure resulting from both the disk and stellar bar). Thus, it is difficult to reconcile simulations that do not observe an in-plane overdensity bozorgnia16 ; kelso16 , or those with little in-plane overdensity pillepich14 with this work (section III.1.1 and III.1.2) and the associated dynamical results in petersen15 .
The dearth of dark disk material may be due to merger history (as has been claimed), though the simulations of sloane16 appear to show that models of the MW that have undergone recent quiescent periods still support our findings regarding the influence of bar-driven dynamics. We conjecture that kelso16 and other simulations are inhibiting the formation of a dark disk as a natural response to the stellar disk regardless of the merger history (both simulations discussed in kelso16 have a relatively quiescent history). Possible causes include the initial temperature of the halo (as measured in velocity dispersion), over-heating of the stellar (and therefore dark) disk, and insufficient potential and phase space resolution. bozorgnia16 does not provide enough information on merger history for us to make even a qualitative assessment of their dark disks (or lack thereof).
We have demonstrated in petersen15 that in sufficiently accurate simulations secular processes change both the ratio of the radial to azimuthal action, which manifests as a change in orbital eccentricity, and induces a net rotation. Thus, DM particles secularly evolve into dark disk orbits. As described in section III.1.3, these effects are both at play in the velocity structure presented here. Both bozorgnia16 and kelso16 report bulk rotation () in their DM halo models, albeit at a smaller than reported in our simulations. As shown in Figure 4, the relationship is altered by the presence of the quadrupole wake, which results from the stellar+shadow bar. The deviations may be below the sensitivity threshold of other simulations, in particular those that cannot probe the plane a function . If the numerical sensitivity does not allow for a characterization of these deviations, then we would expect them to recover a MB distribution, consistent with the findings of bozorgnia16 ; kelso16 ; sloane16 .
In previous works, the limits and detection regions imposed by DD experiments are primarily affected by the density distribution at the high-mass end ( GeV), while both the velocity distribution and density of the self-consistent models affect the low-mass end ( GeV). As increases, the parameter space covered is particularly sensitive to DM halo model choice. Above GeV, the velocity differences are less pronounced, but the determination is still crucial for placing accurate limits. The parametrization presented in mao13 allows for a steeper fall-off in the speed distribution, which may alleviate some of the tension between DD experiments (see Section IV.2), though this has not been functionally demonstrated pillepich14 ; bozorgnia16 ; sloane16 . The next section discusses the effect of our models on the interpretation of DD experiments.
The results from pillepich14 and fornasa14 are generically consistent with results for the adiabatically contracted NFW model, but fail to match the secular evolution caused by the bar, an effect we have shown is significant to the prediction of the DD rates. In both our work and purcell12 , the inclusion of the stellar disk potential increases by broadening the speed distribution in the plane. The overall DM detection rates presented here are qualitatively similar to those in purcell12 , but for different physical reasons. In our model, the uncertainty in the solar position, which may contribute a factor of two to the detection rates, is significantly larger than the variation between the models in purcell12 (approximately 40% at the largest). As purcell12 seeks to model the effect of the Sagittarius dwarf (a satellite of the Milky Way presently having strong interactions with the disk), their 40% result, when compared to our 100% result, suggests that the stellar+shadow bar is a significantly larger effect than the Sagittarius dwarf for all realistic assumptions about the stellar bar and the Sagittarius dwarf.
We note that these cosmologically-based studies (kuhlen10 ; purcell12 ; pillepich14 ; bozorgnia16 ; kelso16 ; sloane16 ) do have advantages when compared to the models presented here, namely added realism from the growth of the stellar disk over time, as well as the presence of substructure in a DM halo that evolves self-consistently. We intend to address the generic dynamical effects of these phenomena in future work. Regardless, the dynamical findings that manifest as detectable signals in this work are bolstered by theoretical predictions (e.g. weinberg85 ). Further, it is difficult to see how other dissipational-component specific processes (e.g. star formation, feedback) would preferentially affect the halo; we therefore expect the results presented in this paper to be generic.
IV.2 Implications for Direct Detection Experiments
Clearly, no simulations can yet make robust predictions for absolute DD rates in the MW. Qualitatively, the increased detection rates observed in simulations relative to the SHM is a boon to DD experiments. Perhaps more importantly, to accurately interpret DD experiment results, and when comparing different DD experiments, the speed distribution is the largest uncertainty (see the discussion in Section III.2). Because the speed distribution is composed of the three components of the velocity, changes to the Gaussian nature of any of these distributions will result in a non-MB velocity distribution.
In Figure 6, the approximate sensitivities to DM are plotted as vertical lines to illustrate the potential cumulative effect the dark disk, density wake, and kinematic wake can have for various experiments (see aalseth13 ; bernabei10 ; agnese13a ; angloher16 ; aprile10 for sensitivity determinations, where has been translated to as in Section III.2). Each experiment has been able to place limits on and , with the earlier generation CDMS-Si experiment agnese13a finding three possible events that make the most likely model for a DM particle and , consistent with the CoGeNT results aalseth13 , as well as the DAMA (Na) results bernabei14 . We also plot horizontal lines connecting the vertical line at GeV (right extent) to a limit at GeV (left extent) as a function of to demonstrate the different values of each experiment would reasonably expect to observe.
Recently, tensions between different experiments, notably the LUX, XENON100, superCDMS and CDMS-Si experiments have been reported. frandsen13 appears to find that varying astrophysical parameters cannot explain the observed CDMS-Si and XENON100 tension, which our findings support. As discussed in section IV.1.1, the dependence of on suggests that experiments with significantly different thresholds will be up to 10 times discrepant in their detection rates for realistic galaxy models when compared to the SHM at GeV. Of course, the experiments sensitive to the lowest energy thresholds still have the largest absolute values of , but the relative ability to detect DM for experiments with higher energy thresholds is significantly enhanced (middle panel of Figure 5). Specifically, the detection rates for the CDMS-Si experiment increase by a factor of 15 (4) at GeV ( GeV) while for the LUX the detection rates increase by a factor of 7 (2) at GeV ( GeV). Thus if CDMS-Si had set the same limit as LUX using the SHM as the halo model, the limit of CDMS-Si would actually be twice as sensitive if one used a more realistic halo model. However, the low energy threshold of LUX (1.1 keV, akerib16 ) still allows LUX to set the more stringent limit.
IV.3 Implications for Annual Modulation Signals
For an isotropic DM distribution velocity distribution in the LSR frame, an annual modulation of the DM signal will arise from the oscillation of the Earth’s azimuthal velocity () between its minimum and maximum values relative to the DM halo. This modulation has been fit by a sinusoid that peaks at the day of highest azimuthal velocity (e.g., pillepich14 ). In our dynamical model, two effects are at play: the modulation will be affected by asymmetries in the velocity centroid and the shape of the velocity distribution with respect to the LSR (as described in section III.1.3 and illustrated in Figures 3 and 4).
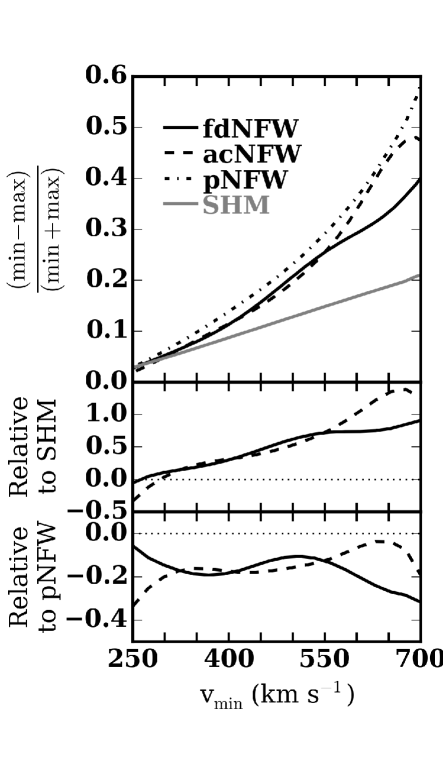
In the upper panel of Figure 7, we plot the amplitude of the annual modulation as the difference between the minimum and maximum detection rates during a year, as a function of . The annual modulation amplitude increases in all models with increasing but, owing to adiabatic contraction, the modulation in both the adiabatically contracted model and the fiducial model are highly enhanced, particularly at high . The differences between the adiabatically contracted model and the fiducial dynamical simulation are caused by the stellar and shadow bar.
In the middle panel of Figure 7, we compare the fiducial and adiabatically contracted models to the SHM. Compared to the SHM, both the adiabatically contracted model and the fiducial model are enhanced for , of interest to most detection experiments (also pointed out in purcell12 ; pillepich14 ). In the bottom panel of Figure 7, we compare the fiducial and adiabatically contracted NFW models to the pristine NFW profile. Here, we see an opposite effect to the comparisons to the SHM: the annual modulation signal is decreased.
Clearly, dynamical evolution affects the annual modulation predictions. We now focus on the comparison between the fiducial and adiabatically contracted model to isolate the effect of the stellar+shadow bar. The velocity ellipsoid of the fiducial model is isotropic and skewed to lower radial and higher tangential velocities, in contrast to the adiabatically contracted model (and the SHM), as shown in section III.1.3 and Figure 4.
A comparison of the fiducial and adiabatically contracted models illustrate the effect of the anisotropic velocity ellipsoid on the annual modulation. For , the amplitude of the fiducial model is enhanced relative to the adiabatically contracted model, while for , the adiabatically contracted model is enhanced relative to the fiducial model. In purcell12 , the Sagittarius stream DM material is out of phase with the annual modulation signal (the stream originates from galactic north). We find that the annual modulation signal in their simulations will closely match the result of our adiabatically contracted model, due to the contribution of the dark disk.
However, in the presence of the bar feature, differences arise. We find that the tail of the speed distribution is dominated by orbits tangential to the LSR motion, but owing to the difference between the expected annual modulation velocity vector from an isotropic distribution and the solar velocity vector (see Figure 4), the effect is lessened as some of the DM co-rotates. However, at low velocities, the radial velocity peak being centered at contributes some signal relative to the adiabatically contracted model.
freese13 provides an overview of the prospect for annual modulation given the status of DD experiments; we point out here that while the overall amplitude of the annual modulation detection signal in our NFW model increases relative to the SHM, the effect of the stellar+shadow bar reduces the effect at high velocities, increasing it at low velocities. As the absolute scaling of the amplitude depends on the location of the peak of the speed distribution relative to the annual modulation velocity variation, we cannot definitively say that the annual modulation signal will be increased. Nonetheless, the trends in the current experimental data are broadly consistent with the isolated effects of the shadow bar provided by the fiducial dynamical NFW and adiabatic contraction NFW models: experiments with low energy thresholds have reported possible annual modulation signals, and high energy threshold experiments have not.
V Conclusions
The major results of the paper are as follows:
-
1.
The density of the DM halo at the solar position varies depending on the Earth’s location relative to the stellar bar. Smaller angles relative to the bar as well as a smaller ratio of can increase the density relative to a spherical distribution by a factor of 2.
-
2.
The DM velocity profile is reshaped by the stellar+shadow bar. The characteristic quadrupole wake in the DM that forms as a response to the stellar bar lags the bar in velocity and, therefore, enhances the detectability of DM when compared to the SHM (adiabatically contracted NFWmodel) by a factor of 3.5 (2) at . At , detectability relative to the SHM is increased by a factor of 10, and up to a factor of 40 for a cored NFW halo model. Enhancements for initially rotating models are approximately equal to the respective non-rotating model (fiducial dynamical NFW and cored NFW).
-
3.
A number of recent astrophysical models suggest the importance of the MW evolutionary history to modeling DM detection rates. As detectability depends on (which is sensitive to the velocity distribution), and we have demonstrated effects on the velocity distribution from known features in the MW, experiments need to move beyond the SHM to compare with other experiments that have different energy thresholds.
-
4.
Similarly, annual modulation in the DM signal will have different detectabilities compared to the SHM as a function of . The stellar+shadow bar, when compared to the adiabatically contracted model, reduces the annual modulation signal for experiments sensitive to high energy thresholds by approximately 20%, and boosts the annual modulation signal for experiments sensitive to low energy thresholds by approximately 20%.
-
5.
When compared to the SHM, we expect an enhancement in detectability and annual modulation. We use an adiabatically contracted model that fixes the gravitational potential of the disk to calibrate the importance of dynamical evolution to the DM detection predictions. For example, when we compare our fiducial dynamical NFW model to the adiabatically contracted NFW model at (the nominal value for superCDMS at GeV), we expect an enhancement in detectability of 100%, but an unchanged annual modulation signal. This illustrates the influence of dynamical evolution.
The results presented in this paper can be succinctly summarized as indicative that the expected rates of observation for DD experiments is strongly sensitive to realistic DM halos. Models that incorporate known physical processes can be used at a minimum to determine astrophysics-related constraints on DM and . While the literature now has no shortage of simulations touting different halo velocity distributions, the field is still not able to accurately create a MW analogue that accounts for evolutionary history. Acknowledging this fact, in this paper we study the effects of simple dynamical models, implemented through n-body simulations, on DD experiments. We stress that the effects presented in this paper are generic results of the gravitational interaction between the stellar disk and the DM halo. The power in these inferences is a motivation for marrying DD experiments with realistic astronomy. Astronomically realistic models will provide realistic constraints with more power to discriminate between WIMP hypotheses.
The change relative to the SHM affect primarily lower values. This owes to the low values implied by GeV, allowing experiments to probe nearly the entire space. In contrast, if GeV, the discrepancy between our fiducial model and the SHM will be large: is in the tail of the distribution, where we have demonstrated changes rapidly.
The results presented here are by no means an exhaustive parameter search, nor a best-fit MW model. However, the MW is a disk galaxy with a moderate bar. The features induced in the DM distribution by dynamical evolution in our simulations realistically represent those expected in the MW and will obtain generally for any disk galaxy. The density enhancements and velocity asymmetries will have clear impacts on the sensitivities of the various direct-detection experiments and are likely to make the tensions between upper limits and tentative detections stronger and more interesting. Future iterations of direct detection experiments, such as superCDMS (at SNOLAB) agnese15 , LUX-ZEPLIN akerib15 , and XENON1T aprile14 , will build upon the constraints from previous studies. Halo models that accurately account for known dynamical effects in the MW are necessary for meaningful hypothesis testing.
Finally, directional detectors will enable a detailed study of the kinematic signature at the solar position. Early efforts may be able to detect a bias in the tangential and radial velocity peaks, as in Figure 4, which may even prove a discriminating factor for determining the halo profile. This hints at the possibility of DM astronomy in the future.
Acknowledgments
The authors thank Eric Linder for thoughtful comments on a draft version of this work.
References
- (1) G. Jungman, M. Kamionkowski, and K. Griest, PhysReports267, 195 (1996), hep-ph/9506380.
- (2) G. Bertone, D. Hooper, and J. Silk, PhysReports405, 279 (2005), hep-ph/0404175.
- (3) E. Aprile et al., Physical Review Letters 109, 181301 (2012), 1207.5988.
- (4) C. E. Aalseth et al., PhysRevD88, 012002 (2013), 1208.5737.
- (5) R. Bernabei et al., Nuclear Instruments and Methods in Physics Research A 742, 177 (2014), 1403.1404.
- (6) R. Agnese et al., PhysRevD92, 072003 (2015), 1504.05871.
- (7) G. Angloher et al., European Physical Journal C 76, 25 (2016), 1509.01515.
- (8) D. S. Akerib et al., Physical Review Letters 116, 161301 (2016), 1512.03506.
- (9) DarkSide Collaboration, P. Agnes et al., Phys. Rev. D 93, 081101 (2016).
- (10) PICO Collaboration, C. Amole et al., Phys. Rev. D 93, 061101 (2016).
- (11) PandaX-II Collaboration, A. Tan et al., Phys. Rev. D 93, 122009 (2016).
- (12) SuperCDMS Collaboration, R. Agnese et al., Phys. Rev. Lett. 116, 071301 (2016).
- (13) T. M. Undagoitia and L. Rauch, Journal of Physics G: Nuclear and Particle Physics 43, 013001 (2016).
- (14) C. McCabe, PhysRevD82, 023530 (2010), 1005.0579.
- (15) C. McCabe, PhysRevD84, 043525 (2011), 1107.0741.
- (16) Y.-Y. Mao, L. E. Strigari, R. H. Wechsler, H.-Y. Wu, and O. Hahn, ApJ764, 35 (2013), 1210.2721.
- (17) A. Pillepich, M. Kuhlen, J. Guedes, and P. Madau, ApJ784, 161 (2014), 1308.1703.
- (18) N. Bozorgnia et al., JCAP5, 024 (2016), 1601.04707.
- (19) C. Kelso et al., ArXiv e-prints (2016), 1601.04725.
- (20) J. D. Sloane, M. R. Buckley, A. M. Brooks, and F. Governato, ArXiv e-prints (2016), 1601.05402.
- (21) M. Kuhlen et al., JCAP2, 30 (2010), 0912.2358.
- (22) C. W. Purcell, A. R. Zentner, and M.-Y. Wang, JCAP8, 27 (2012), 1203.6617.
- (23) M. Lisanti and D. N. Spergel, Physics of the Dark Universe 1, 155 (2012), 1105.4166.
- (24) J. I. Read, G. Lake, O. Agertz, and V. P. Debattista, MNRAS389, 1041 (2008), 0803.2714.
- (25) J. I. Read, L. Mayer, A. M. Brooks, F. Governato, and G. Lake, MNRAS397, 44 (2009), 0902.0009.
- (26) T. Bruch, J. Read, L. Baudis, and G. Lake, ApJ696, 920 (2009), 0804.2896.
- (27) C. W. Purcell, J. S. Bullock, and M. Kaplinghat, ApJ703, 2275 (2009), 0906.5348.
- (28) F.-S. Ling, E. Nezri, E. Athanassoula, and R. Teyssier, JCAP2, 12 (2010), 0909.2028.
- (29) M. Petersen, M. Weinberg, and N. Katz, MNRAS(2016).
- (30) M. Vogelsberger et al., MNRAS395, 797 (2009), 0812.0362.
- (31) M. Kamionkowski and S. M. Koushiappas, PhysRevD77, 103509 (2008), 0801.3269.
- (32) M. Kuhlen, M. Lisanti, and D. N. Spergel, PhysRevD86, 063505 (2012), 1202.0007.
- (33) C. A. J. O’Hare and A. M. Green, PhysRevD90, 123511 (2014), 1410.2749.
- (34) G. de Vaucouleurs, Interpretation of velocity distribution of the inner regions of the Galaxy, in The Galaxy and the Magellanic Clouds, edited by F. J. Kerr, , IAU Symposium Vol. 20, p. 195, 1964.
- (35) O. Gerhard, The Galactic Bar, in The Dynamics, Structure & History of Galaxies: A Workshop in Honour of Professor Ken Freeman, edited by G. S. Da Costa, E. M. Sadler, and H. Jerjen, , Astronomical Society of the Pacific Conference Series Vol. 273, p. 73, 2002, astro-ph/0203109.
- (36) C. Wegg, O. Gerhard, and M. Portail, MNRAS450, 4050 (2015), 1504.01401.
- (37) K. Freese, P. Gondolo, H. J. Newberg, and M. Lewis, Physical Review Letters 92, 111301 (2004), astro-ph/0310334.
- (38) C. Savage, K. Freese, and P. Gondolo, PhysRevD74, 043531 (2006), astro-ph/0607121.
- (39) M. T. Frandsen, F. Kahlhoefer, C. McCabe, S. Sarkar, and K. Schmidt-Hoberg, JCAP7, 23 (2013), 1304.6066.
- (40) S. Nikolaev and M. D. Weinberg, ApJ487, 885 (1997).
- (41) N. Bissantz and O. Gerhard, MNRAS330, 591 (2002), astro-ph/0110368.
- (42) J. Bovy et al., ApJ759, 131 (2012), 1209.0759.
- (43) J. Bovy and H.-W. Rix, ApJ779, 115 (2013), 1309.0809.
- (44) J. F. Navarro, C. S. Frenk, and S. D. M. White, ApJ490, 493 (1997), astro-ph/9611107.
- (45) J. Bullock et al., ApJ 555, 240 (2001).
- (46) M. N. Sevenster, MNRAS310, 629 (1999), astro-ph/9907319.
- (47) P. L. Hammersley, F. Garzón, T. J. Mahoney, M. López-Corredoira, and M. A. P. Torres, MNRAS317, L45 (2000), astro-ph/0007232.
- (48) W. Dehnen, AJ119, 800 (2000), astro-ph/9911161.
- (49) C. Babusiaux and G. Gilmore, MNRAS358, 1309 (2005), astro-ph/0501383.
- (50) A. Cabrera-Lavers, C. González-Fernández, F. Garzón, P. L. Hammersley, and M. López-Corredoira, A&A491, 781 (2008), 0809.3174.
- (51) J. A. Green et al., ApJ733, 27 (2011), 1103.3913.
- (52) M. Boylan-Kolchin, J. S. Bullock, S. T. Sohn, G. Besla, and R. P. van der Marel, ApJ768, 140 (2013), 1210.6046.
- (53) S. Garrison-Kimmel, M. Boylan-Kolchin, J. S. Bullock, and K. Lee, MNRAS438, 2578 (2014), 1310.6746.
- (54) M. J. Reid et al., ApJ783, 130 (2014), 1401.5377.
- (55) S. Chatzopoulos et al., MNRAS447, 948 (2015), 1403.5266.
- (56) M. Jurić et al., ApJ673, 864 (2008), astro-ph/0510520.
- (57) R. Schönrich, J. Binney, and W. Dehnen, MNRAS403, 1829 (2010), 0912.3693.
- (58) R. Schönrich, MNRAS427, 274 (2012), 1207.3079.
- (59) J. D. Lewin and P. F. Smith, Astroparticle Physics 6, 87 (1996).
- (60) S. K. Lee, M. Lisanti, and B. R. Safdi, JCAP11, 33 (2013), 1307.5323.
- (61) C. McCabe, JCAP2, 27 (2014), 1312.1355.
- (62) C. W. Purcell, J. S. Bullock, E. J. Tollerud, M. Rocha, and S. Chakrabarti, Nature477, 301 (2011), 1109.2918.
- (63) B. Allgood et al., MNRAS367, 1781 (2006), astro-ph/0508497.
- (64) M. Kuhlen, J. Diemand, and P. Madau, ApJ671, 1135 (2007), 0705.2037.
- (65) O. Bienaymé et al., A&A571, A92 (2014), 1406.6896.
- (66) T. Piffl et al., A&A562, A91 (2014), 1309.4293.
- (67) J. Billard, Q. Riffard, F. Mayet, and D. Santos, Physics Letters B 718, 1171 (2013), 1207.1050.
- (68) M. C. Smith et al., MNRAS379, 755 (2007), astro-ph/0611671.
- (69) T. Piffl et al., MNRAS445, 3133 (2014), 1406.4130.
- (70) J. Lavalle and S. Magni, PhysRevD91, 023510 (2015), 1411.1325.
- (71) M. Fornasa and A. M. Green, PhysRevD89, 063531 (2014), 1311.5477.
- (72) M. D. Weinberg, MNRAS213, 451 (1985).
- (73) R. Bernabei et al., European Physical Journal C 67, 39 (2010), 1002.1028.
- (74) R. Agnese et al., Physical Review Letters 111, 251301 (2013).
- (75) E. Aprile et al., Physical Review Letters 105, 131302 (2010), 1005.0380.
- (76) K. Freese, M. Lisanti, and C. Savage, Reviews of Modern Physics 85, 1561 (2013).
- (77) The LZ Collaboration et al., ArXiv e-prints (2015), 1509.02910.
- (78) E. Aprile et al., Journal of Instrumentation 9, P11006 (2014).