The Energy Landscape Underpinning Module Dynamics in the Human Brain Connectome
Abstract
Human brain dynamics can be profitably viewed through the lens of statistical mechanics, where neurophysiological activity evolves around and between local attractors representing preferred mental states. Many physically-inspired models of these dynamics define the state of the brain based on instantaneous measurements of regional activity. Yet, recent work in the emerging field of network neuroscience has provided initial evidence that the human brain might also be well-characterized by time-varying states composed of locally coherent activity or functional modules. Here we study this network-based notion of brain state to understand how functional modules dynamically interact with one another to perform cognitive functions. Specifically, we estimate the functional relationships between regions of interest (ROIs) by fitting a pair-wise maximum entropy model to each ROI’s pattern of allegiance to functional modules. Local minima in this model represent attractor states characterized by specific patterns of modular structure. Hierarchical clustering of these local minima highlight three classes of ROIs with similar patterns of allegiance to community states. Visual, attention, sensorimotor, and subcortical ROIs tend to form a single functional community (Class-I). The remaining ROIs tend to form a putative executive control community (Class-II) or a putative default mode and salience community (Class-III). We simulate the brain’s dynamic transitions between these community states using a Markov Chain Monte Carlo random walk (MCMC). We observe that simulated transition probabilities between basins strongly resemble empirically observed transitions between community allegiance states in resting state fMRI data. The accuracy of our predictions is strongest for the transition probabilities of Class-I ROIs (primary sensorimotor, attention, subcortical), followed by Class-III ROIs (default mode), but to a lesser extent Class-II ROIs (executive). These results highlight the transient fluctuations characteristic of cognitive control systems. More broadly, these results collectively offer a view of the brain as a dynamical system that transitions between basins of attraction characterized by coherent activity in small groups of brain regions, and that the strength of these attractors depends on the cognitive computations being performed.
Department of Bioengineering, University of Pennsylvania, Philadelphia, PA, 19104 USA
U.S. Army Research Laboratory, Aberdeen Proving Ground, MD 21005 USA
Applied Mathematics and Computational Science Graduate Program, University of Pennsylvania, Philadelphia, PA, 19104 USA
Department of Psychology, University of Pennsylvania, Philadelphia, PA, 19104 USA
Department of Electrical & Systems Engineering, University of Pennsylvania, Philadelphia, PA, 19104 USA
Department of Psychological & Brain Sciences, University of California, Santa Barbara,CA, 93106 USA
To whom correspondence should be addressed: dsb@seas.upenn.edu
The Energy Landscape Underpinning Module Dynamics in the Human Brain Connectome
Danielle S. Bassett
Department of Bioengineering
University of Pennsylvania
210 S. 33rd Street
240 Skirkanich Hall
Philadelphia, PA 19104-6321
Ph. 215-746-1754
Fax 215-573-2071
A.A., J.M.V., and D.S.B developed the project. M.G.M. acquired the data. A.A. analyzed the data. S.G. contributed computational tools and expertise. A.A., J.M.V., and D.S.B. wrote the paper.
energy landscape maximum entropy model community structure modularity functional brain network graph theory
The human brain is a complex dynamical system comprised of billions of neurons that continuously communicate with one another. Although the vast number of processing units challenges exact prediction of single neuron activity, recently developed statistical models reveal a characteristic meso-scale structure whereby sets of larger-scale brain regions display coherent activity at rest. These sets form putative functional modules characterized by locally dense functional connectivity, and include the default mode, salience, attention, fronto-parietal, cingulo-opercular, motor, visual, auditory, and subcortical systems Salvador et al. (2005); Meunier et al. (2009); Yeo et al. (2011); Power et al. (2011). Interestingly, although within-module functional connectivity is in general higher than between-module functional connectivity, these patterns fluctuate dynamically over short periods of time Ma et al. (2014); Kiviniemi et al. (2011); Watanabe et al. (2013), both at rest and during task performance Cole et al. (2014); Mattar et al. (2015); Bassett et al. (2011, 2013b, 2015a); Braun et al. (2015). Yet, fundamental insights into the mechanisms or rules by which modules interact with one another over time have remained elusive Mattar et al. (2015).
One potential route towards a mechanistic theory of brain network dynamics is to consider probabilistic models that were originally developed in the field of statistical mechanics. Pair-wise maximum entropy models (MEM), for example, have proven very useful in estimating and predicting spiking activity in neurons Shlens et al. (2006), local field potentials from neuronal assemblies Tang et al. (2008), and blood oxygen level dependent signals (BOLD) from brain regions using functional magnetic resonance imaging (fMRI) Watanabe et al. (2013, 2014b, 2014c). When a pair-wise MEM accurately fits empirical data, it implies that the observed activation pattern can be described as a combination of each unit’s independent activation rate plus the units’ joint activation rates. When a pair-wise MEM does not accurately fit empirical data, it implies that higher order interactions (such as triplets) or nonlinearities contribute to the observed dynamics. Importantly, pair-wise MEMs can be used to infer an energy landscape of brain activity during task performance, including the presence of common brain states (attractors, or basins on the energy landscape), as well as the paths or trajectories along which the brain moves as it transitions from one basin to another. Importantly, these inferences have proven useful in predicting individual differences in human perception and behavior Watanabe et al. (2014c).
In traditional applications of MEMs to neurophysiological data, a brain state is defined as a pattern of activity across brain regions (or similarly, a neural state is defined as a pattern of neural activity across neurons). However, these notions of brain state are agnostic to the patterns of communication or synchronization linking brain regions, and therefore are unable to address the question of how one pattern of coherent activity could evolve into another pattern of coherent activity. To address this question, we explicitly define a network state as the pattern of module allegiance across brain regions, and we use this definition to examine transitions between network states. Specifically, we construct a time-dependent network by linking 10 regions of interest by the low frequency (0.06–0.19 Hz) wavelet coherence between their time series in a given time window. We use a community detection algorithm to identify groups of brain regions that show stronger coherence with one another than they do to other groups. We refer to these groups as network communities, and we fit the MEM to each ROI’s time series of the state of co-occurrence in the same community with other ROIs. This approach enables us to identify network states that form local energy minima, as well as features of the energy landscape surrounding these minima. More generally, this approach highlights the dynamic functional roles that different ROIs play in network states and the transitions between them.

Our results reveal the presence of local minima on the energy landscape, many of which are characterized by the activation of a single community. Interestingly, different ROIs show different patterns of membership to these single community states. Visual, attention, sensorimotor, and subcortical ROIs tend to form a single functional community (Class-I). The remaining ROIs form the putative executive control network (Class-II) and the putative default mode and salience network (Class-III). To further study these dynamics, we modeled the transitions of single community states over the landscape of the states’s energy via a random walk process. Our numerical simulation of basin transitions using an MCMC random walk predict empirical probabilities of state transitions with high fidelity for Class-I and Class-III ROIs, and with lower fidelity for executive control (Class-II) ROIs. In addition, empirically the executive control ROIs also display higher entropy energy landscapes, linking diverse state classes, and utilizing uniform transition probabilities across basins. These features support the unique role of executive control regions in diversifying the brain’s dynamic functional repertoire across many cognitive processes via their rich and flexible dynamic functional fingerprint.
Participants
Twenty participants (nine female; ages 19–53 years; mean age = 26.7 years) with normal or corrected vision and no history of neurological disease or psychiatric disorders were recruited for this experiment. All participants volunteered and provided informed consent in writing in accordance with the guidelines of the Institutional Review Board of the University of Pennsylvania (IRB #801929).
Human fMRI Data collection
Magnetic resonance images were obtained at the Hospital of the University of Pennsylvania using a 3.0 T Siemens Trio MRI scanner equipped with a 32-channel head coil. T1-weighted structural images of the whole brain were acquired on the first scan session using a three-dimensional magnetization-prepared rapid acquisition gradient echo pulse sequence (repetition time (TR) 1620 ms; echo time (TE) 3.09 ms; inversion time 950 ms; voxel size 1 mm 1 mm 1 mm; matrix size 190 263 165). A field map was also acquired at each scan session (TR 1200 ms; TE1 4.06 ms; TE2 6.52 ms; flip angle ; voxel size 3.4 mm 3.4 mm 4.0 mm; field of view 220 mm; matrix size 64 64 52) to correct geometric distortion caused by magnetic field inhomogeneity. In all experimental runs with a behavioral task, T2*-weighted images sensitive to blood oxygenation level-dependent contrasts were acquired using a slice accelerated multiband echo planar pulse sequence (TR 2,000 ms; TE 25 ms; flip angle ; voxel size 1.5 mm 1.5 mm 1.5 mm; field of view 192 mm; matrix size 128 128 80). In all resting state runs, T2*-weighted images sensitive to blood oxygenation level-dependent contrasts were acquired using a slice accelerated multiband echo planar pulse sequence (TR 500 ms; TE 30 ms; flip angle ; voxel size 3.0 mm 3.0 mm 3.0 mm; field of view 192 mm; matrix size 64 64 48).
fMRI Preprocessing
We preprocessed the resting state fMRI data using FEAT (FMRI Expert Analysis Tool) Version 6.00, part of FSL (FMRIB’s Software Library, www.fmrib.ox.ac.uk/fsl). Specifically, we applied: EPI distortion correction using FUGUE Jenkinson (2004); motion correction using MCFLIRT Jenkinson et al. (2002); slice-timing correction using Fourier-space timeseries phase-shifting; non-brain removal using BET Smith (2002); grand-mean intensity normalization of the entire 4D dataset by a single multiplicative factor; highpass temporal filtering (Gaussian-weighted least-squares straight line fitting, with sigma=50.0s).
Nuisance timeseries were voxelwise regressed from the preprocessed data. Nuisance regressors included (i) three translation (X, Y, Z) and three rotation (Pitch, Yaw, Roll) timeseries derived by retrospective head motion correction (), together with expansion terms (), for a total of 24 motion regressors Friston et al. (1996)); (ii) the five first principal components calculated from timeseries derived from regions of non-interest (white matter and cerebrospinal fluid), using the anatomical CompCor method (aCompCor) Behzadi et al. (2007) and (iii) the average signal derived from white matter voxels located within a 15mm radius from each voxel, following the ANATICOR method Jo et al. (2010). Global signal was not regressed out of voxel time series due to its controversial application to resting state fMRI data Murphy et al. (2009); Saad et al. (2012); Chai et al. (2012). Finally, the mean functional image and the 125-scale Lausanne parcellation template Cammoun et al. (2012a) were coregistered using Statistical Parametric Mapping software (SPM12; Wellcome Department of Imaging Neuroscience, www.fil.ion.ucl.ac.uk/spm) in order to extract ROIs’ mean timeseries.
ICA-Informed Identification of Regions of Interest
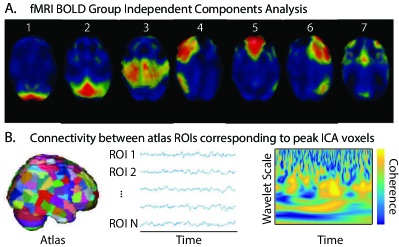
We used group-ICA (GIFT toolbox Calhoun et al. (2001)) to identify ten large-scale intrinsic connectivity networks (ICN) characteristic of the resting state. Computational considerations preclude us from studying a larger number of networks in the context of the maximum entropy model approach. Next, we identified the regions of interest (ROIs) by choosing the ROI from a commonly used anatomical atlas (the 125 scale Lausanne parcellation Cammoun et al. (2012b)) in which we observed the peak activation of an ICA component. A list of identified ICNs and their corresponding Lausanne atlas ROI are provided in Table 1. In supplementary figure SI7, we also discuss the effect of anatomical versus functional parcellation methods on our results.
For computational reasons which we will discuss in more details shortly, we only included ROIs from the left hemisphere for the majority of components. The one exception to this rule was the right executive control network (RECN). Prior work has demonstrated that the putative fronto-parietal executive control network is identified as two separate bilateral ICNs Shirer et al. (2012a); Laird et al. (2011), which separately play critical roles in executive function through their dynamical interactions with the DMN and attention systems Andrews-Hanna et al. (2014); Menon and Uddin (2010). Thus we included time series from both the right and left executive control networks in all following analysis.
| ICN | Lausanne ROI (scale 125) |
|---|---|
| \midrule1. Visual | 189 Cuneus.1 |
| 2. Dorsal Attention (Attn) | 184 Precuneus.1 |
| 3. Sensory/Motor (SM) | 147 Precentral.3 |
| 4. Basal Gangla/Thalamus (BG) | 228 Caudate |
| 5. Left Executive Control Network (LECN) | 128 Rostral middle frontal.2 |
| 6. Right Executive Control Network (RECN) | 15 Rostral middle frontal.2 |
| S 7. Rostral Middle Frontal Cortex (rmFC) | 130 Rostral middle frontal.4 |
| 8. Dorsomedial Prefrontal Cortex (dMPFC) | 135 Superior frontal.3 |
| 9. Default Mode Network (DMN) | 122 Medial orbitofrontal.1 |
| 10. Salience | 124 Pars triangularis.1 |
| \bottomrule |
Functional Network Construction
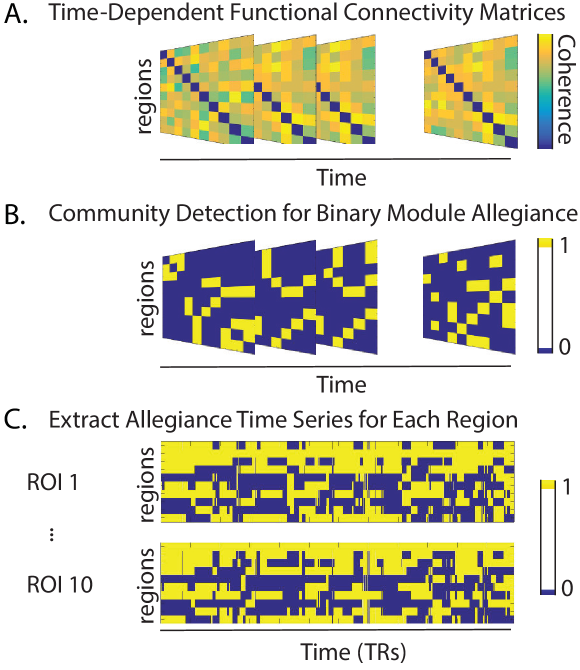
Following prior work Bassett et al. (2011), we estimated the dynamic functional connectivity between all pairs of ROIs using wavelet coherence (WTC Grinsted et al. (2004)). In supplementary figure SI4, we show that we observe two distinct bands of high WTC: and . In the main manuscript, we focus on the band due to known sensitivity to underlying neural activity, and we relegate discussion of the higher frequency band to the supplement. WTC amplitudes were averaged over all frequencies within the selected band to construct the timecourse of the band-passed WTC for each pair of ROIs resulting in a total of T (=1190 (TRs) 20 (subjects) 4 (runs) = 95200) unique functional connectivity patterns, which we represent in adjacency matrices (see Fig. 2).
Community Detection and Module Allegiance Estimation
In the maximum entropy framework, it is critical that data points are as temporally distinct from one another as possible. In the context of our study, this requires that we reduce the dependence of community structure in the neighboring time slices. To do so, we identified the community structure Fortunato (2010); Porter et al. (2009) of the each time slice adjacency matrix independently using a Louvain-like Blondel et al. (2008) locally greedy heuristic algorithm to maximize the modularity quality function Newman (2006) with a structural resolution parameter of Bassett et al. (2013a).The method partitions ROIs into communities based on the optimization of the following function:
where is a weighted adjacency matrix, ROIi and j are assigned respectively to community and , the Kronecker delta if (and zero otherwise), is the structural resolution parameter, and is the expected weight of the edge between ROIi and j under some null model. We used the Newman-Girvan null model Girvan and Newman (2002)
where is the strength of ROI i and . In a nutshell, this method partitions the ROIs into groups such that the total connection strength within communities is more than expected in the null model.
Importantly, the algorithm we use is a heuristic that implements a non-deterministic optimization Good et al. (2010). Consequently we repeated the optimization 100 times Bassett et al. (2013a), and we report results summarized over those iterations by forming a module allegiance matrix Bassett et al. (2015a); Mattar et al. (2015).
The allegiance matrix for each time slice represented the probability that ROI i and j were assigned to the same community over all iterations of the community detection algorithm (Fig. 3). For use in the maximum entropy model, we binarized the allegiance matrix by subtracting a random null model allegiance matrix from the original allegiance matrix: elements in the binarized allegiance matrix were 1 when the true allegiance was greater than the null, and 0 otherwise Bassett et al. (2013a). The null allegiance matrices were generated by shuffling the ROI community assignments for each individual time point uniformly at random.
Maximum Entropy Model Fitting
Here we hypothesize that the brain transitions between different functional community states. To obtain an unbiased estimate of these states and their probabilities, we fit a pair-wise maximum entropy model. The principle of maximum entropy states that when estimating the probability distribution, given the constraints, one should find the distribution that maximizes the uncertainty (i.e., entropy). Choosing any other distribution that lowers the entropy would assume information that we do not possess; therefore the only reasonable distribution is the maximum entropy distribution. Fitting the MEM entails tuning the first and second-order interaction parameter between regions so that the predicted activation rates and co-activation rates match that of the empirically observed values. An accurate pair-wise MEM fit suggests that the observed dynamics of the communities can be simply explained as a combination of each region’s independent activation rate plus the region’s joint activation rates. In other words, the MEM allows us to establish a mechanistic model of brain functional dynamics as a probabilistic process shaped by intrinsic relationships between brain regions.
We fit the pairwise MEM to the binarized community allegiance of ROI pairs (similar to Watanabe et al. (2013)). To reduce the size of the state space and therefore ensure less error in our estimates, we fit the MEM to each row of the allegiance matrix independently for each ROI, effectively reducing the dimensionality to N-1 (= 9) and reducing the total number of possible congruent community membership states to . For ROI i at time t the congruent community membership state is defined as , where is the binarized community allegiance of i and j at time point t (’1’ for congruent community membership and ’0’ otherwise), and N is the total number of ROIs (= 10). For ROI i the empirical congruent community membership rate of ROI j, , is given by , where T is the number of time slices, which in this case is equal to the number of TRs. Likewise the empirical pairwise congruent community membership rate of ROIs j and l, , is defined as .
Here our only constraints were that the model and matched the empirical values of and respectively. It is known that given these constraints the probability distribution that maximizes the entropy is the Boltzman distribution Jaynes (1957)
| (1) |
where is the probability distribution of kth state , and the energy of that state given by
| (2) |
where is the value of for state , represents the expected base allegiance of ROI j (with respect to ROI i) in isolation, and represents the functional interaction between ROI j and l. Fitting the MEM entails iterative adjustment of and with a gradient ascent algorithm (similar to Watanabe et al. (2014c)) until the empirical and values approximately match the model and . In depth analysis of the goodness of MEM fits (provided in SI1), allows us to conclude that the pair-wise MEM can account for a large portion of the observed functional module dynamics. Nevertheless, higher-order and/or nonlinear interactions likely contribute to smaller yet non-negligible portions of the observed brain dynamics.
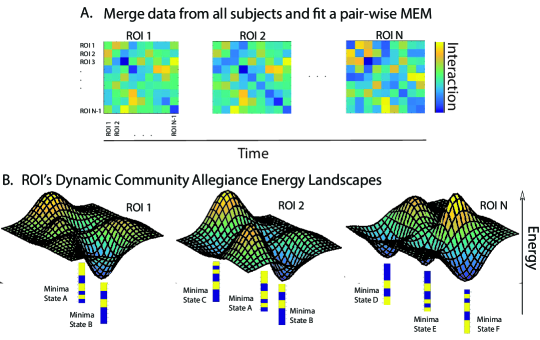
Defining an Energy Landscape
The energy landscape for each ROI is defined separately by the network of congruent community membership states and their corresponding energy values . In this landscape the adjacent states’ vectors are only one hamming distance apart, which means that all ROIs except one have the same binary values as in adjacent states’ vectors. Watanabe et al. (2014a)
An interesting question to ask of this landscape is the location and nature of energy minima. To address this question, we exhaustively searched the entire landscape using a steep search algorithm to find the states with energies lower than all their neighboring states (i.e. local minima). Next in order to identify the states that belong to the basin of each local minima we first start at a given state (one of the possible states) and iteratively move to the neighboring state in the landscape if . We continue tracing out this path until we reach a local minima state where no neighboring states exist with smaller energy values (similar to Watanabe et al. (2014c, 2013)). We consider this final state the basin state of the local minima. We also define the basin size of that local minima state as the fraction of the number of basin states to the total number of possible states.
We were next interested in understanding the predicted barriers between states. We estimated the energy barrier opposing the transition between all the local minima states in the following way: (1) We removed the state (node) with the highest energy from the energy landscape along with the edges connecting that state to its neighbors. (2) We assessed whether each pair of local minima were connected by a path in the reduced landscape. We repeated steps (1) and (2) until we found the saddle state where removing the highest energy node disconnects one or more local minima from the rest of the landscape. We continued this process until we obtained a reduced landscape where all of the local minima are isolated and we identified all saddle states. (3) We calculated the symmetric energy barrier Zhou (2011) between all pairs of minima states as the minimum of , where is the energy of the saddle point between minima states , and and are the energies at these states, respectively. If the energy barrier between to minima states was high then the model predicts that the rate of transition between them is low, at least in one direction Watanabe et al. (2013). We also calculated the asymmetric energy barrier between minima states , as and , , where the former indicated the and the latter the energy barriers. Overall, our results did not show any relationship between estimated energy barriers (symmetric and asymmetric) between local minima states and the empirical basin transition probabilities. We speculate that the energy barrier mimics the basin transition probabilities only when the basins are smooth and funnel-like. Thus unaccounted factors such as the shape (e.g., roughness) of the basins may contribute more to the observed basin transition probabilities than the energy barriers between the basins.
We speculate that other unaccounted factors such as the shape of the basins may contribute more to the observed basin transition probabilities than the energy barriers between the basins.
Simulation of State Transitions
To better understand the dynamic patterns of functional communities at rest, we simulated these dynamics as a random walk process over the estimated local energy landscapes using a Markov chain Monte Carlo with Metropolis-Hastings (MCMC) algorithm Metropolis et al. (1953); Hastings (1970); Zhou (2011). In this model, local community allegiance state is allowed an isometric transition to one of neighboring state with uniform probability. Next the actual transition from to occurs with probability . For each ROI, we repeated a step (plus initial steps) walk with randomly chosen initial states times. Next, we removed the initial steps to ensure independence of results from the initial conditions and decreased the sampling rate by 500 to reduce the correlation between the samples. Since each state in the energy landscape belongs to the basin of a single local minima, we can construct a trajectory of local minima states’ basin transitions from the down-sampled state transitions patterns. Comparing the empirical and simulated basin transition probability patterns allows us to evaluate the resemblance of the proposed random walk model’s dynamics to that of the brain.
A note on Statistics and Computational Considerations
The fit of the maximum entropy model to small datasets can be subject to a sampling bias. More exactly, the estimation of the entropy suffers severely from downward bias Treves and Panzeri (1995) such that the estimated entropy from the observations is lower than the actual entropy of the underlying model Macke et al. (2011). Ultimately the amount of data needed to accurately fit the model is exponential to the number of ROIs. Therefore even a small number of ROIs (on the order of ten) requires access to extremely large datasets. This issue of computational complexity is especially critical for fMRI data where the slow sampling rate prohibits collection of individual subject dataset with a large number of observations. Consequently, in this manuscript we focus on group concatenated multiband data (with a quarter-second TR) and do not discuss results from individual subjects. In supplementary figure SI1, we briefly discuss the model fit at the subject- and group-level where we demonstrate that the goodness of fit and accuracy of the model drops considerably when considering individual subjects as opposed to the group.
The total number of partitions of an -element set is the Bell number Grimaldi (2006). In combinatorial mathematics, the Bell numbers count the number of partitions of a set. Thus the total number of possible community states of the 10 ROIs equals 115975. To accurately model this large number of states would require a large amount of data. However, local analysis (through the lens of a single ROI) of congruent community allegiance deals with a much smaller state space of . At this level, it is computationally feasible to fit a MEM with a relatively large multiband fMRI dataset such as the one we use here.
Distillation of Drivers of Resting State Dynamics
Maximum entropy models are optimally constructed to fit patterns of interactions between relatively few brain regions. We therefore sought to distill the drivers of resting state dynamics to a few well-chosen regions of interest. Specifically, in resting state fMRI data acquired from 20 healthy adult individuals in a multiband imaging sequence, we extract 10 regions of interest in a data-driven fashion as centroids of independent components (see Methods). These regions include the cuneus, precuneus, precentral gyrus, caudate, right and left rostral middle frontal cortex, dorsomedial prefrontal cortex, medial orbitofrontal cortex, and pars triangularis (see Table 1). We use these regions as proxies of their respective cognitive systems, spanning visual, dorsal attention, sensorimotor, basal ganglia, executive control, dorsomedial prefrontal cortex, default mode, and salience systems, respectively. For explicit maps of each independent component, and the representative region chosen, see SI3.
Maximum Entropy Model of Network States
Our goal is to understand how the brain transitions between network states. We focus our attention on the transitions characterized by changes in the community structure of the network, or the organization of putative functional modules. This focus is motivated by a growing literature demonstrating (i) the presence of network communities at rest, which map on to known cognitive systems Salvador et al. (2005); Meunier et al. (2009); Power et al. (2011); Yeo et al. (2011), and (ii) changes in the integration or segregation of these communities during task performance Bassett et al. (2011, 2013b); Cole et al. (2014); Bassett et al. (2015a); Braun et al. (2015). Based on these emerging lines of research, we define network states based on regions’ congruent community allegiance. Specifically, we fit a MEM to the binarized community allegiance probability of region i where with the other ROIs. This approach assesses the community-based interactions between a single ROI and all others, thus significantly reducing the space of possible states (from 115975 possible global community states to only local single community states) and thereby increasing model accuracy Grimaldi (2006).
Local Minima in the Brain’s Functional Energy Landscape.
After fitting the MEM to regional congruence in community allegiance across all subjects, we characterized the resultant energy landscapes of all ROIs. We identified 3–5 local minima states from the landscape of a single ROI, for a total of unique local minima states across all ROIs. We note that each state represents the set of brain regions that are commonly allied together in a single community (see Fig. 5A). Because ROIs with strong functional interactions are expected to display congruent membership in local minima states, we performed hierarchical clustering on the pattern of ROI allegiance to local minima states. Interestingly, we observed that ROIs divided neatly into three separate classes. Class-I was composed of occipital, parietal, and subcortical ROIs in the visual, attention, sensorimotor, and basal ganglia systems. Class-II was composed of fronto-parietal, and frontal ROIs in the right and left executive control network and the rostral middle frontal systems. Finally, Class-III was composed of medial and opercular ROIs in the dorsal medial prefrontal, default mode, and salience systems.
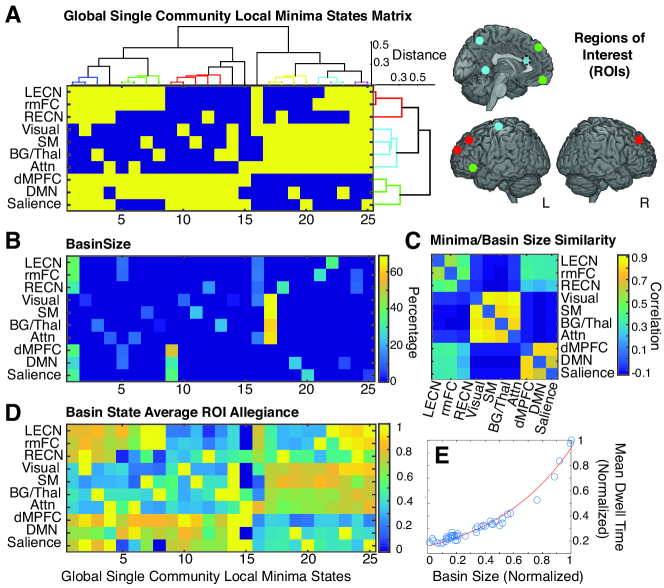
Although we identified a total of 25 unique local minima states across all ROI landscapes, the majority of these states approximated single communities consisting largely of ROIs from one or two identified classes. For example as see in Fig. 5A, local minima states 1–3 are characterized by congruent community allegiance of Class-II and Class-III ROIs. Hierarchical clustering of local minima states based on their similarity (as measured by the Hamming distance between the local minima states) underlines several groups of very similar local minima states, where each group is characterized by a few common ROIs. Interestingly, these results highlight the tendency of Class-I and Class-III ROIs to display incongruent (or dissimilar) community allegiance, whereas Class-II ROIs form communities with ROIs across both classes. This observation provides converging evidence of the distinctive role of the putative executive control regions in diversifying the brain’s dynamic functional repertoire across many cognitive process via their functional fingerprint.
Basins surrounding local energy minima
In the previous section, we identified minima of the energy landscape underpinning module dynamics, and we further described the clustering of these minima states into groups with similar regional profiles of allegiance to dynamic modules. These minima were located at the locally least-energetic position on the energy landscape. However, it is also intuitively of interest to study the group of states neighboring each local minimum since the shape of the surrounding low-energy basin effects the state transition dynamics over the basin. The brain states are expected to rapidly converge to the local minima in a smooth, steep, funnel-like basin, whereas over the larger rough basins the systems displays frustrated dynamics; i.e. it is difficult to reach local minima because of the large number of peaks and troughs. To study this larger group of states, we defined basin states of local minimum A to be any state from which one can travel down the steepest gradient of the energy landscape (using a steep search algorithm) to reach the local minimum A (see Methods for details). Using this definition, we estimated any basin’s size as the ratio of the number of basin states to the total number of possible states. We observed that the largest basin – making up to of the total state space of Class-I ROIs – surrounded minima state #17, which was characterized by congruent allegiance of visual, sensorimotor, basal ganglia, and attention systems (see Fig. 5B). The large size of this basin suggested that these systems had stronger than average intrinsic functional interactions, perhaps due to the ongoing visual fixation that is characteristic of the resting state with eyes open.
To better understand the anatomical drivers of observed module dynamics, we next studied which brain regions contributed most to basin states surrounding each minimum.To address this goal, we began by counting the number of times that each basin state appeared in a single region’s profile. Using this information, we defined for each ROI the number of basin states seen by that ROI as a fraction of the total number of possible states. In other words, associated with each ROI was a vector that represented the fraction of its states that were identified in the basin of each of the minima states. Interestingly, the identified classes of ROIs seemed to show similar profiles, as measured by a Pearson correlation coefficient between any two ROIs’ vectors (see Fig. 5C). Moreover, with the exception of a few states (e.g. states 7 and 8), the ROIs from the same class appear with the same frequency between different basin states; in Fig. 5D, this effect is evident through the comparable average allegiance values of ROIs from the same class.
To understand how local minima states with large basin sizes effect the state transition dynamics, we calculated the dwell time of each ROI in a given basin. Intuitively, a dwell time is the length of time in which an ROI remains in a given local minima’s basin. We observed that the size of the basin was positively related to dwell time within the basin (see Fig. 5E). We note that on average the dwell time of each basin is only a few seconds (), except for state #17 which displays twice the average dwell time () although the variance is large (). In addition, supplementary Figures SI1-2 also reveal the relatively rough surface of the state #17 basin, marked by the presence of several prominent peaks and troughs. Together these results suggest that close functional relationships between ROIs (especially between Class-I ROIs) promotes frustrated dynamics over large basins, marked by coherent activity in Class-I ROIs.
The probability of transitioning between basins
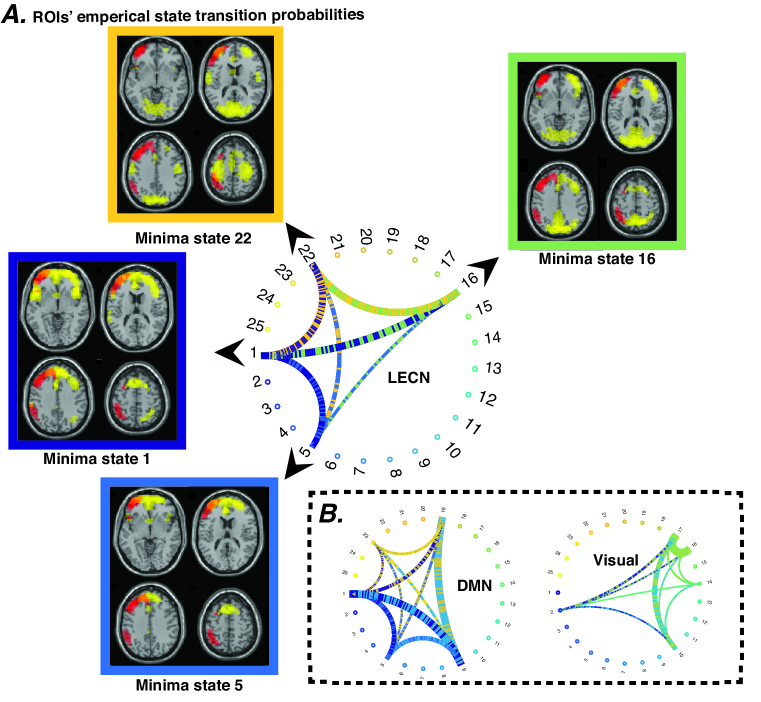
After identifying local minima states and the times spent dwelling within their basin, we next turned to examining the probabilities with which the brain transitioned between single community states to estimate an ROI’s transition profile. Because each time point of the subjects’ dataset is often associated with two or more single community states, we estimated the probability of transitioning from one basin to another, separately for each ROI’s energy landscape (see Fig. 6). For Class-I ROIs that include occipital, parietal, and subcortical areas in the visual, attention, sensorimotor, and basal ganglia systems, we observed that the basin of minima state #17 (characterized by the largest basin size and by congruent allegiance of visual, sensorimotor, basal ganglia, and attention systems) was also the most frequently visited basin. These results once again highlight the strength of this attractor state, which in turn echoes the close functional interactions between Class-I ROIs. For Class-II ROIs including fronto-parietal and frontal areas in the right and left executive control network and the rostral middle frontal systems, we observed a more uniform distribution of transition probabilities between basins. This more uniform transition probability architecture is also characteristic of Class-III ROIs, which are composed of medial and opercular areas in the dorsal medial prefrontal, default mode, and salience systems.
To have a better understanding of the fluidity of the state transitions for each ROI, we measured the level of unpredictability (i.e., entropy) of each ROI’s community allegiance states. We calculated the entropy of allegiance state probabilities for each ROI separately. The significantly higher entropy of the Class-II ROI landscapes ( bootstrap) provides converging evidence of the highly dynamic community organization of ECN ROIs where their single community states more fluidly transition between local minima state basins as highlighted in Fig. 6 (right). This property of ECN ROIs likely facilitates the adaptation of the brain to the real-time demands of a wide range of cognitive functions by fluidly transitioning between a diverse set of functional community states.
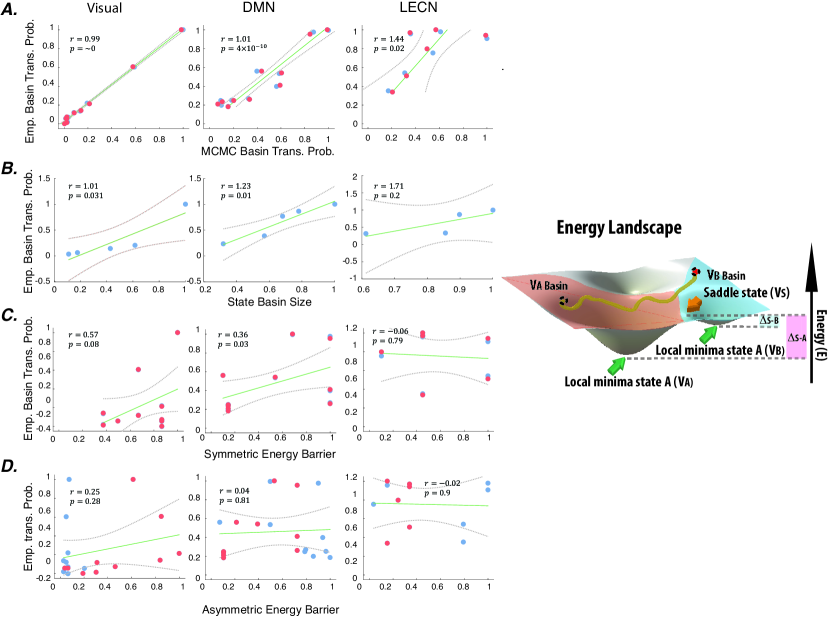
Next, we asked whether we could use the maximum entropy model results to predict the empirically observed transition probabilities, as a confirmation of the modeling framework. To derive theoretically expected transition probabilities, we simulated the transition dynamics between basins using a Markov Chain Monte Carlo (MCMC) method over the energy landscape of each ROI using the Metropolis-Hastings algorithm (see Methods for details). A secondary benefit of this approach was that it allowed us to identify groups of brain regions whose module dynamics were not well-predicted by a random walk model, and therefore might require consideration of more highly constrained walk dynamics. In general, we observed that simulated and empirical transition probabilities were positively correlated with one another (average Pearson correlation coefficient , except LECN for which ), offering initial validation of the MEM approach. Interestingly, however, this relationship displayed differential strength across the three classes of ROIs (see as Figure 7A and SI2 for more details), indicating that some transition probabilities were less well characterized by pairwise interactions (the assumption of the MEM) and/or by random walks across the underlying energy landscape (the assumption of the MCMC). In particular, Class-I ROIs showed the strongest relationships between the simulated and empirical transition probabilities; Class-III ROIs showed significant but weaker correlations and Class-II in general showed insignificant correlations after FDR correction for multiple comparisons. In the earlier MEM analysis, the functional activity Class-II ROIs were well fit, yet the transition probabilities here find low similarity between the model and empirical data. This suggests that a simple random walk model fails to capture the state transition behavior of putative areas in the executive control networks, which form the bulk of Class-II ROIs.
Finally, we asked whether the empirical transition probabilities could be predicted by simpler statistics drawn from the maximum entropy model (and associated energy landscape) and not requiring the full MCMC modeling approach. In general, we observe a positive relationship between the size of a basin and the transition probability of that basin: the brain tends to transition into and out of large basins. This effect is strongest in Class-I and Class-II ROIs, and weaker for Class-III ROIs (Figure 7B). Intuitively, while the basin size is likely to be a strong predictor of transition probability, another important consideration lies in the energy barriers between basins. That is, are two basins separated by a low hill or by a high mountain on the energy landscape? To clarify the relative predictive power of basin size versus barriers between basins, we estimated the energy barrier between pairs of basins by identifying saddle nodes on the energy landscape (see Methods). Importantly, we could estimate these barriers either by considering symmetric transition probability estimates (averaging both transitions into and out of a state), or by considering the full transition probability matrix with small asymmetries. We did not observe any consistent trend linking the size of the energy barrier and the empirically observed transition probabilities (Figure 7C), particularly in the case of the asymmetric estimates (Figure 7D). These results suggest that module dynamics are best explained by basin size rather than by barriers between basins.
In this work we aimed to characterize the dynamic organization of large-scale brain networks and to provide a mechanistic model of the manner in which the brain transitions between large-scale functional states. Drawing on recent work demonstrating the fundamental nature of modular organization in large-scale functional dynamics Sporns and Betzel (2016), we defined these states via local patterns of brain regions’ allegiance to network communities Bassett et al. (2015b). We utilized the maximum entropy modeling (MEM) framework to estimate the probability of occurrence of these states as well as each ROI’s co-occurrence with another ROI in the same community. Our results highlight the existence of three classes of ROIs with similar functional relationships. Visual, attention, sensorimotor, and subcortical ROIs tend to form a single functional community (Class-I). The remaining ROIs form the putative executive control network (Class-II) and the putative default mode and salience network (Class-III). In addition to identifying these distinct classes of ROIs that display inherently different dynamics within putative functional modules, we also studied the probabilities with which the brain transitioned from one pattern of functional modules to another pattern of functional modules. By modeling basin transitions using an MCMC random walk, we predicted empirical probabilities of state transitions with high fidelity for Class-I and Class-III ROIs, and with lower fidelity for executive control (Class-II) ROIs. Interestingly, executive control ROIs also displayed higher entropy energy landscapes, linking diverse state classes, and utilizing uniform transition probabilities across basins, consistent with their unique role in diversifying the brain’s dynamic functional repertoire. More generally, the relatively good fit of the MEM suggests that the complex patterns of network module dynamics can be described simply by pairwise interactions between regional allegiances to communities. In contrast to the widespread interest in network statistics, our results provide a the critical first steps towards a mechanistic model of brain networks dynamics.
Model-Based versus Data-Driven Approaches to Studying Dynamic Functional Connectivity
One of our fundamental aims in performing this work was to understand the dynamic functional interactions between large-scale brain networks driven by underlying neurophysiological processes at smaller spatial scales Logothetis (2008). While many empirical and data-driven approaches are currently being developed and utilized Hutchison et al. (2013), model-based approaches comprise a relatively smaller literature largely including efforts in the Virtual Brain Roy et al. (2014) and dynamic causal modeling Stephan and Roebroeck (2012) communities. Development of such approaches is imperative to our understanding of the role that network dynamics play in attention Kucyi et al. (2016), learning Bassett et al. (2015a), language Doron et al. (2012), and memory Braun et al. (2015), and their evolution through development Chai et al. (2016) or alteration in psychiatric disease Siebenhuhner et al. (2013); Weiss et al. (2011); Du et al. (2016); Yu et al. (2015) and neurological disorders Khambhati et al. (2015); Burns et al. (2014). Here we build on a maximum entropy based modeling framework that has been previously utilized in the context of functional activation profiles (rather than connectivity profiles) Watanabe et al. (2013, 2014b, 2014c). We adapt this approach to study the functional energy landscape of network states and their associated attractor states dynamics. Functional brain states are defined based on regional allegiance to dynamic functional communities, providing insight into the physiological patterns of synchronization between groups of brain regions. This model-based approach revealed notable reductions in the distance between the estimated and empirical distributions of patterns of ICN functional modules from resting state data by considering interactions between all pairs of regions. Therefore, the pair-wise MEM suggests that the observed patterns of BOLD-derived ICNs dynamic functional communities are partly due to their intrinsic tendency to synchronize with one another, likely across known structural connections Watanabe et al. (2013).
Attractor Communities in Dynamic Brain Networks
Our modeling framework is explicitly based on the role that single regions play in the meso-scale organization of dynamic communities. We fit a maximum entropy model to each ROI’s time series of co-occurrence with another ROI in the same community. This approach enables us to identify the dynamic functional roles that different ROIs play in network state dynamics. When combining information from all ROIs, this approach identifies network states that form local energy minima or in essence single community attractors. Indeed, while each region displays a distinct profile of activation across the energy minima, several groups of regions also show similarities in their activation profiles. We refer to these groups as classes, and observe that each single community attractor tended to contain all members of one or two ROI classes: Class-II ROIs (largely comprising executive control regions) coupled with Class-I or Class-III ROIs, whereas Class-I and Class-III ROIs coupled infrequently. This observation suggests that regions in the executive control network play unique roles in meso-scale functional dynamics Andrews-Hanna et al. (2014), forming transient control hubs that can guide interactions between large-scale functional networks Mattar et al. (2015); Bassett et al. (2015a); Braun et al. (2015); Cole et al. (2013).
Dimensionality of Mesoscale Brain Dynamics
Any assessment of brain states is faced with the question of “So, how many are there?” Most prior literature suggests that brain dynamics can be distilled into between 4 and 7 states at the coarsest level of inquiry Allen et al. (2012); Britz et al. (2010); Khanna et al. (2015); Shirer et al. (2012b). Yet, evidence from electrophysiology points to the presence of so-called microstates, of which there may be many more and which can last for very short periods of time Khanna et al. (2015); Vakorin et al. (2011). The repertoire of states available to the brain is therefore arguably more accurately characterized as a hierarchy, with a few coarse states composed of multiple levels of more transient (temporally localized) and focal (spatially localized) states. This complex organization requires computational and data-science approaches Turk-Browne (2013) such as the one that we develop in this work. Here, we uncover 25 states, as defined by local minima in the energy landscape of module dynamics during the resting state. Each state is characterized by a distinct pattern of module allegiance embodied by different brain regions. The identification of these states offers a complementary view to that provided by prior work, which has described changes in module allegiance of brain regions over time Bassett et al. (2011, 2013b, 2015a); Braun et al. (2015); Mattar et al. (2015) and speculated on the cognitive drivers of these changes as regions critical for domain-general processing Fedorenko and Thompson-Schill (2014), associative processing Bassett et al. (2013b), cognitive control Bassett et al. (2015a), and cognitive flexibility Braun et al. (2015). While regional roles are important, the states themselves may also offer insights into what cognitive processes are occurring, either in parallel or in series Mattar et al. (2015). It would be interesting in future work to manipulate cognitive processes via task performance and determine the direct relationship between local minima states and mental states Andrews-Hanna et al. (2014); Kucyi et al. (2016); Betzel et al. (2016); Gu et al. (2016).
Cognitive Control, Flexibility, and Task-Switching
Executive control networks in fronto-parietal cortices play a unique role in the pattern of results that we uncover here. Executive ROIs display states of module allegiance that are unlike the states displayed by other brain areas. Moreover, our results suggest that the brain transitions in and out of these states in a manner that is not as well-fit by an MCMC random walk on the observed energy landscape, suggesting a peculiar complexity of dynamics. Interestingly, executive ROIs also display higher entropy energy landscapes, link diverse state classes, and utilize uniform transition probabilities across basins. These findings are particularly interesting when viewed in the context of executive control function, and its instantiation in brain network architecture. Executive function supports the ability to link information to solve problems, inhibit inappropriate behaviors, and transition between tasks and states Royall et al. (2002). Recent work suggests that these capabilities occur via dynamic interactions between large-scale neural circuits Dajani and Uddin (2015); Cole et al. (2013), often taking the form of competitive or cooperative dynamics Cocchi et al. (2013) between putative functional modules Mattar et al. (2015). Indeed, recent evidence points to fronto-parietal cortices as hubs of flexible modular reconfiguration during task states Bassett et al. (2013b), that are directly correlated with individual differences in learning Bassett et al. (2011, 2015a), memory Braun et al. (2015), and cognitive flexibility Braun et al. (2015). Our current results complement these findings by suggesting that the baseline functional architecture of executive regions supports their role during task performance: (i) the high entropy energy landscapes of these regions can support highly transiently dynamics, and (ii) the uniform transition probabilities can support the integration (cooperative) and segregation (competitive) of many other cognitive systems. It is interesting to speculate that these unique features of executive region dynamics observed at rest may in part be driven by white matter microstructure, consistent with recent evidence pointing towards a structural driver of executive function Gu et al. (2015).
Methodological Considerations
For computational reasons, we have reduced the dimensionality of the data in two ways. First, we chose a small number of ROIs whose time series offer a reasonable representation of the resting state networks from which they derive (see SI). However, because of this down-sampling procedure, we are not sensitive to dynamic fluctuations within a network. Future work using larger datasets could explore whether higher order ICA decompositions offer additional insights into finer-scale dynamics underlying the functional hierarchy that we observe here. Second, we fit the MEM to each ROI’s community allegiance time series, rather than to all ROI pairs’ allegiance at the same time. Future work could aim to develop novel optimization-based methods to characterize the energy landscape of the global structure.
A distinct set of important methodological considerations relates to the dynamic community structure that we estimate as the input to the regional MEMs. We estimate dynamic community structure using a modularity maximization approach Lancichinetti and Fortunato (2011) which has an implicit structural resolution parameter that can be used to tune the number of communities. Following prior work, we employ the default parameter value of unity Bassett et al. (2013a), and it would be interesting in future to study the changes in energy landscapes that occur at different spatial and temporal Mucha et al. (2010) scales. Moreover, following the extraction of dynamic community structure, we binarize the pair-wise allegiance probabilities, necessarily losing sensitivity to fine-scale network perturbations of nodes that are loosely associated with a single community. However, since we mainly focus on the most robust attractor communities, the computational benefits of the reduced state space following binarization outweighs the cost associated with this lack of sensitivity.
See SI for complementary analyses, results, and discussions that were omitted from the manuscript for brevity. Details of the goodness of fit of the MEM, additional information on asymmetries of basin transition probabilities and basin dwell time distributions, spatial maps of ICN components, calculation of band-passed wavelet-coherence, and alternative parcellation methods are discussed in depth in SI 1,2&6, 3, 4, and 5 respectively.
Conclusions and Future Directions
Here we present a viable mechanistic model of dynamic reconfiguration in functional brain networks estimated from resting state fMRI. By representing a brain state as a pattern of functional interactions between brain regions, we reveal structured transitions between a finite number of brain states that act as basins of attraction. Critically, each basin is characterized by a specific set of functional modules: groups of brain areas that display coherent BOLD time series. By characterizing the energy landscape surrounding these basins, we accurately predict the manner in which the brain transitions between states, and we uncover novel markers of the functional role that executive regions play in guiding these transitions. These efforts lay the groundwork for empirical investigations into how these energy landscapes change during task performance, over normative neurodeveloping, throughout healthy aging, or in the context of psychiatric disease or neurological disorders. Moreover, they lay important theoretical groundwork in the critical development of mechanistic models of brain network dynamics subserving cognitive function.
Acknowledgements
This work was directly supported by the Army Research Laboratory through contract number W911NF-10-2-0022, a collaborative mechanism between J.M.V and D.S.B. In addition, D.S.B., S.G., M.G.M, and A.A. would also like to acknowledge support from the John D. and Catherine T. MacArthur Foundation, the Alfred P. Sloan Foundation, the Army Research Office through contract number W911NF-14-1-0679, the National Institute of Health (2-R01-DC-009209-11, 1R01HD086888-01, R01-MH107235, R01-MH107703, and R21-M MH-106799), the Office of Naval Research, and the National Science Foundation (BCS-1441502, CAREER PHY-1554488, and BCS-1631550). The content is solely the responsibility of the authors and does not necessarily represent the official views of any of the funding agencies.
References
- Allen et al. (2012) Allen E.A., Damaraju E., Plis S.M., Erhardt E.B., Eichele T., and Calhoun V.D. (2012). Tracking whole-brain connectivity dynamics in the resting state. Cerebral Cortex 24, 663–676.
- Andrews-Hanna et al. (2014) Andrews-Hanna J.R., Smallwood J., and Spreng R.N. (2014). The default network and self-generated thought: component processes, dynamic control, and clinical relevance. Annals of the New York Academy of Sciences 1316, 29–52.
- Bassett et al. (2013a) Bassett D.S., Porter M.A., Wymbs N.F., Grafton S.T., Carlson J.M., and Mucha P.J. (2013a). Robust detection of dynamic community structure in networks. Chaos: An Interdisciplinary Journal of Nonlinear Science 23, 013142.
- Bassett et al. (2011) Bassett D.S., Wymbs N.F., Porter M.A., Mucha P.J., Carlson J.M., and Grafton S.T. (2011). Dynamic reconfiguration of human brain networks during learning. Proc Natl Acad Sci U S A 108, 7641–7646.
- Bassett et al. (2013b) Bassett D.S., Wymbs N.F., Rombach M.P., Porter M.A., Mucha P.J., and Grafton S.T. (2013b). Task-based core-periphery organization of human brain dynamics. PLoS Comput Biol 9, e1003171.
- Bassett et al. (2015a) Bassett D.S., Yang M., Wymbs N.F., and Grafton S.T. (2015a). Learning-induced autonomy of sensorimotor systems. Nat Neurosci 18, 744–751.
- Bassett et al. (2015b) Bassett D.S., Yang M., Wymbs N.F., and Grafton S.T. (2015b). Learning-induced autonomy of sensorimotor systems. Nat Neurosci 18, 744–751.
- Behzadi et al. (2007) Behzadi Y., Restom K., Liau J., and Liu T.T. (2007). A component based noise correction method (compcor) for bold and perfusion based fmri. Neuroimage 37, 90–101.
- Betzel et al. (2016) Betzel R.F., Satterthwaite T.D., Gold J.I., and Bassett D.S. (2016). A positive mood, a flexible brain. arXiv 1601.
- Blondel et al. (2008) Blondel V.D., Guillaume J.L., Lambiotte R., and Lefebvre E. (2008). Fast unfolding of communities in large networks. J. Stat. Mech. p. P10008.
- Braun et al. (2015) Braun U., Schafer A., Walter H., Erk S., Romanczuk-Seiferth N., Haddad L., Schweiger J.I., Grimm O., Heinz A., Tost H., Meyer-Lindenberg A., and Bassett D.S. (2015). Dynamic reconfiguration of frontal brain networks during executive cognition in humans. Proc Natl Acad Sci U S A 112, 11678–11683.
- Britz et al. (2010) Britz J., Van De Ville D., and Michel C.M. (2010). BOLD correlates of EEG topography reveal rapid resting-state network dynamics. Neuroimage 52, 1162–1170.
- Burns et al. (2014) Burns S.P., Santaniello S., Yaffe R.B., Jouny C.C., Crone N.E., Bergey G.K., Anderson W.S., and Sarma S.V. (2014). Network dynamics of the brain and influence of the epileptic seizure onset zone. Proc Natl Acad Sci U S A 111, E5321–E5330.
- Calhoun et al. (2001) Calhoun V., Adali T., Pearlson G., and Pekar J. (2001). A method for making group inferences from functional mri data using independent component analysis. Human brain mapping 14, 140–151.
- Cammoun et al. (2012a) Cammoun L., Gigandet X., Meskaldji D., Thiran J.P., Sporns O., Do K.Q., Maeder P., Meuli R., and Hagmann P. (2012a). Mapping the human connectome at multiple scales with diffusion spectrum mri. Journal of neuroscience methods 203, 386–397.
- Cammoun et al. (2012b) Cammoun L., Gigandet X., Meskaldji D., Thiran J.P., Sporns O., Do K.Q., Maeder P., Meuli R., and Hagmann P. (2012b). Mapping the human connectome at multiple scales with diffusion spectrum MRI. J Neurosci Methods 203, 386–397.
- Chai et al. (2016) Chai L., Khambhati A., Gur R., Gur R., Satterthwaite T.D., and Bassett D.S. (2016). Evolution of brain network dynamics in neurodevelopment. Submitted .
- Chai et al. (2012) Chai X.J., Castañón A.N., Öngür D., and Whitfield-Gabrieli S. (2012). Anticorrelations in resting state networks without global signal regression. Neuroimage 59, 1420–1428.
- Cocchi et al. (2013) Cocchi L., Zalesky A., Fornito A., and Mattingley J.B. (2013). Dynamic cooperation and competition between brain systems during cognitive control. Trends Cogn Sci 17, 493–501.
- Cole et al. (2014) Cole M.W., Bassett D.S., Power J.D., Braver T.S., and Petersen S.E. (2014). Intrinsic and task-evoked network architectures of the human brain. Neuron 83, 238–251.
- Cole et al. (2013) Cole M.W., Reynolds J.R., Power J.D., Repovs G., Anticevic A., and Braver T.S. (2013). Multi-task connectivity reveals flexible hubs for adaptive task control. Nat Neurosci 16, 1348–1355.
- Dajani and Uddin (2015) Dajani D.R., and Uddin L.Q. (2015). Demystifying cognitive flexibility: Implications for clinical and developmental neuroscience. Trends Neurosci 38, 571–578.
- Doron et al. (2012) Doron K.W., Bassett D.S., and Gazzaniga M.S. (2012). Dynamic network structure of interhemispheric coordination. Proc Natl Acad Sci U S A 109, 18661–18668.
- Du et al. (2016) Du Y., Pearlson G.D., Yu Q., He H., Lin D., Sui J., Wu L., and Calhoun V.D. (2016). Interaction among subsystems within default mode network diminished in schizophrenia patients: A dynamic connectivity approach. Schizophr Res 170, 55–65.
- Fedorenko and Thompson-Schill (2014) Fedorenko E., and Thompson-Schill S.L. (2014). Reworking the language network. Trends Cogn Sci 18, 120–126.
- Fortunato (2010) Fortunato S. (2010). Community detection in graphs. Physics Reports 486, 75–174.
- Friston et al. (1996) Friston K.J., Williams S., Howard R., Frackowiak R.S., and Turner R. (1996). Movement-related effects in fmri time-series. Magnetic resonance in medicine 35, 346–355.
- Girvan and Newman (2002) Girvan M., and Newman M.E.J. (2002). Community structure in social and biological networks. Proc. Natl. Acad. Sci. USA 99, 7821–7826.
- Good et al. (2010) Good B.H., de Montjoye Y.A., and Clauset A. (2010). Performance of modularity maximization in practical contexts. Phys Rev E Stat Nonlin Soft Matter Phys 81, 046106.
- Grimaldi (2006) Grimaldi R.P. (2006). Discrete and Combinatorial Mathematics, 5/e (Pearson Education India).
- Grinsted et al. (2004) Grinsted A., Moore J.C., and Jevrejeva S. (2004). Application of the cross wavelet transform and wavelet coherence to geophysical time series. Nonlin. Processes Geophys. 11, 561–566.
- Gu et al. (2016) Gu S., Betzel R.F., Cieslak M., Delio P., Grafton S.T., Pasqualetti F., and Bassett D.S. (2016). Optimal trajectories of brain state transitions Submitted.
- Gu et al. (2015) Gu S., Pasqualetti F., Cieslak M., Telesford Q.K., Yu A.B., Kahn A.E., Medaglia J.D., Vettel J.M., Miller M.B., Grafton S.T., and Bassett D.S. (2015). Controllability of structural brain networks. Nat Commun 6, 8414.
- Hastings (1970) Hastings W.K. (1970). Monte carlo sampling methods using markov chains and their applications. Biometrika 57, 97–109.
- Hutchison et al. (2013) Hutchison R.M., Womelsdorf T., Allen E.A., Bandettini P.A., Calhoun V.D., Corbetta M., Della Penna S., Duyn J.H., Glover G.H., Gonzalez-Castillo J., et al. (2013). Dynamic functional connectivity: promise, issues, and interpretations. Neuroimage 80, 360–378.
- Jaynes (1957) Jaynes E.T. (1957). Information theory and statistical mechanics. Physical review 106, 620.
- Jenkinson (2004) Jenkinson M. (2004). Improving the registration of b0-distorted epi images using calculated cost function weights. In Tenth International Conference on functional mapping of the human brain.
- Jenkinson et al. (2002) Jenkinson M., Bannister P., Brady M., and Smith S. (2002). Improved optimization for the robust and accurate linear registration and motion correction of brain images. Neuroimage 17, 825–841.
- Jo et al. (2010) Jo H.J., Saad Z.S., Simmons W.K., Milbury L.A., and Cox R.W. (2010). Mapping sources of correlation in resting state fmri, with artifact detection and removal. Neuroimage 52, 571–582.
- Khambhati et al. (2015) Khambhati A.N., Davis K.A., Oommen B.S., Chen S.H., Lucas T.H., Litt B., and Bassett D.S. (2015). Dynamic network drivers of seizure generation, propagation and termination in human neocortical epilepsy. PLoS Comput Biol 11, e1004608.
- Khanna et al. (2015) Khanna A., Pascual-Leone A., Michel C.M., and Farzan F. (2015). Microstates in resting-state eeg: current status and future directions. Neuroscience and Biobehavioral Reviews 49, 105–113.
- Kiviniemi et al. (2011) Kiviniemi V., Vire T., Remes J., Elseoud A.A., Starck T., Tervonen O., and Nikkinen J. (2011). A sliding time-window ica reveals spatial variability of the default mode network in time. Brain connectivity 1, 339–347.
- Kucyi et al. (2016) Kucyi A., Hove M.J., Esterman M., Hutchison R.M., and Valera E.M. (2016). Dynamic brain network correlates of spontaneous fluctuations in attention. Cereb Cortex Feb 13, bhw029.
- Laird et al. (2011) Laird A.R., Fox P.M., Eickhoff S.B., Turner J.A., Ray K.L., McKay D.R., Glahn D.C., Beckmann C.F., Smith S.M., and Fox P.T. (2011). Behavioral interpretations of intrinsic connectivity networks. Journal of cognitive neuroscience 23, 4022–4037.
- Lancichinetti and Fortunato (2011) Lancichinetti A., and Fortunato S. (2011). Limits of modularity maximization in community detection. Phys Rev E Stat Nonlin Soft Matter Phys 84, 066122.
- Logothetis (2008) Logothetis N.K. (2008). What we can do and what we cannot do with fmri. Nature 453, 869–878.
- Ma et al. (2014) Ma S., Calhoun V.D., Phlypo R., and Adalı T. (2014). Dynamic changes of spatial functional network connectivity in healthy individuals and schizophrenia patients using independent vector analysis. NeuroImage 90, 196–206.
- Macke et al. (2011) Macke J.H., Murray I., and Latham P.E. (2011). How biased are maximum entropy models? In Advances in Neural Information Processing Systems. pp. 2034–2042.
- Mattar et al. (2015) Mattar M.G., Cole M.W., Thompson-Schill S.L., and Bassett D S. (2015). A functional cartography of cognitive systems. PLoS Comput Biol 11, e1004533.
- Menon and Uddin (2010) Menon V., and Uddin L.Q. (2010). Saliency, switching, attention and control: a network model of insula function. Brain Structure and Function 214, 655–667.
- Metropolis et al. (1953) Metropolis N., Rosenbluth A.W., Rosenbluth M.N., Teller A.H., and Teller E. (1953). Equation of state calculations by fast computing machines. The journal of chemical physics 21, 1087–1092.
- Meunier et al. (2009) Meunier D., Lambiotte R., Fornito A., Ersche K.D., and Bullmore E.T. (2009). Hierarchical modularity in human brain functional networks. Front Neuroinform 3, 37.
- Mucha et al. (2010) Mucha P.J., Richardson T., Macon K., Porter M.A., and Onnela J.P. (2010). Community structure in time-dependent, multiscale, and multiplex networks. Science 328, 876–878.
- Murphy et al. (2009) Murphy K., Birn R.M., Handwerker D.A., Jones T.B., and Bandettini P.A. (2009). The impact of global signal regression on resting state correlations: are anti-correlated networks introduced? Neuroimage 44, 893–905.
- Newman (2006) Newman M.E.J. (2006). Modularity and community structure in networks. Proceedings of the National Academy of Sciences of the United States of America 103, 8577–8696.
- Porter et al. (2009) Porter M.A., Onnela J.P., and Mucha P.J. (2009). Communities in networks. Notices of the American Mathematical Society 56, 1082–1097, 1164–1166.
- Power et al. (2011) Power J.D., Cohen A.L., Nelson S.M., Wig G.S., Barnes K.A., Church J.A., Vogel A.C., Laumann T.O., Miezin F.M., Schlaggar B.L., and Petersen S.E. (2011). Functional network organization of the human brain. Neuron 72, 665–678.
- Roy et al. (2014) Roy D., Sigala R., Breakspear M., McIntosh A.R., Jirsa V.K., Deco G., and Ritter P. (2014). Using the virtual brain to reveal the role of oscillations and plasticity in shaping brain’s dynamical landscape. Brain Connect 4, 791–811.
- Royall et al. (2002) Royall D.R., Lauterbach E.C., Cummings J.L., Reeve A., Rummans T.A., Kaufer D.I., LaFrance W.C.J., and Coffey C.E. (2002). Executive control function: a review of its promise and challenges for clinical research. A report from the Committee on Research of the American Neuropsychiatric Association. J Neuropsychiatry Clin Neurosci 14, 377–405.
- Saad et al. (2012) Saad Z.S., Gotts S.J., Murphy K., Chen G., Jo H.J., Martin A., and Cox R.W. (2012). Trouble at rest: how correlation patterns and group differences become distorted after global signal regression. Brain connectivity 2, 25–32.
- Salvador et al. (2005) Salvador R., Suckling J., Schwarzbauer C., and Bullmore E. (2005). Undirected graphs of frequency-dependent functional connectivity in whole brain networks. Philos Trans R Soc Lond B Biol Sci 360, 937–946.
- Shirer et al. (2012a) Shirer W., Ryali S., Rykhlevskaia E., Menon V., and Greicius M. (2012a). Decoding subject-driven cognitive states with whole-brain connectivity patterns. Cerebral cortex 22, 158–165.
- Shirer et al. (2012b) Shirer W.R., Ryali S., Rykhlevskaia E., Menon V., and Greicius M.D. (2012b). Decoding subject-driven cognitive states with whole-brain connectivity patterns. Cereb Cortex 22, 158–165.
- Shlens et al. (2006) Shlens J., Field G.D., Gauthier J.L., Grivich M.I., Petrusca D., Sher A., Litke A.M., and Chichilnisky E. (2006). The structure of multi-neuron firing patterns in primate retina. The Journal of neuroscience 26, 8254–8266.
- Siebenhuhner et al. (2013) Siebenhuhner F., Weiss S.A., Coppola R., Weinberger D.R., and Bassett D.S. (2013). Intra- and inter-frequency brain network structure in health and schizophrenia. PLoS One 8, e72351.
- Smith (2002) Smith S.M. (2002). Fast robust automated brain extraction. Human brain mapping 17, 143–155.
- Sporns and Betzel (2016) Sporns O., and Betzel R.F. (2016). Modular brain networks. Annu Rev Psychol 67, 613–640.
- Stephan and Roebroeck (2012) Stephan K.E., and Roebroeck A. (2012). A short history of causal modeling of fMRI data. Neuroimage 62, 856–863.
- Tang et al. (2008) Tang A., Jackson D., Hobbs J., Chen W., Smith J.L., Patel H., Prieto A., Petrusca D., Grivich M.I., Sher A., et al. (2008). A maximum entropy model applied to spatial and temporal correlations from cortical networks in vitro. The Journal of Neuroscience 28, 505–518.
- Treves and Panzeri (1995) Treves A., and Panzeri S. (1995). The upward bias in measures of information derived from limited data samples. Neural Computation 7, 399–407.
- Turk-Browne (2013) Turk-Browne N.B. (2013). Functional interactions as big data in the human brain. Science 342, 580–584.
- Vakorin et al. (2011) Vakorin V.A., Lippe S., and McIntosh A.R. (2011). Variability of brain signals processed locally transforms into higher connectivity with brain development. J Neurosci 31, 6405–6413.
- Watanabe et al. (2013) Watanabe T., Hirose S., Wada H., Imai Y., Machida T., Shirouzu I., Konishi S., Miyashita Y., and Masuda N. (2013). A pairwise maximum entropy model accurately describes resting-state human brain networks. Nature communications 4, 1370.
- Watanabe et al. (2014a) Watanabe T., Hirose S., Wada H., Imai Y., Machida T., Shirouzu I., Konishi S., Miyashita Y., and Masuda N. (2014a). Energy landscapes of resting-state brain networks. Frontiers in Neuroinformatics 8.
- Watanabe et al. (2014b) Watanabe T., Kan S., Koike T., Misaki M., Konishi S., Miyauchi S., Miyahsita Y., and Masuda N. (2014b). Network-dependent modulation of brain activity during sleep. NeuroImage 98, 1–10.
- Watanabe et al. (2014c) Watanabe T., Masuda N., Megumi F., Kanai R., and Rees G. (2014c). Energy landscape and dynamics of brain activity during human bistable perception. Nature communications 5.
- Weiss et al. (2011) Weiss S.A., Bassett D.S., Rubinstein D., Holroyd T., Apud J., Dickinson D., and Coppola R. (2011). Functional brain network characterization and adaptivity during task practice in healthy volunteers and people with schizophrenia. Front Hum Neurosci 5, 81.
- Yeo et al. (2011) Yeo B.T., Krienen F.M., Sepulcre J., Sabuncu M.R., Lashkari D., Hollinshead M., Roffman J.L., Smoller J.W., Zollei L., Polimeni J.R., Fischl B., Liu H., and Buckner R.L. (2011). The organization of the human cerebral cortex estimated by intrinsic functional connectivity. J Neurophysiol 106, 1125–1165.
- Yu et al. (2015) Yu Q., Erhardt E.B., Sui J., Du Y., He H., Hjelm D., Cetin M.S., Rachakonda S., Miller R.L., Pearlson G., and Calhoun V.D. (2015). Assessing dynamic brain graphs of time-varying connectivity in fMRI data: application to healthy controls and patients with schizophrenia. Neuroimage 107, 345–355.
- Zhou (2011) Zhou Q. (2011). Random walk over basins of attraction to construct ising energy landscapes. Physical review letters 106, 180602.