High Dimensional Human Guided Machine Learning
Abstract
Have you ever looked at a machine learning classification model and thought, I could have made that? Well, that is what we test in this project, comparing XGBoost trained on human engineered features to training directly on data. The human engineered features do not outperform XGBoost trained directly on the data, but they are comparable. This project contributes a novel method for utilizing human created classification models on high dimensional datasets.
Why Human Guided?
In the artificial intelligence, machine learning, and human computation fields there is little research into the effectiveness of human generated models. One research project is human guided simple search (?), and tabu search (?). Humans outperform the state of the art algorithms when solving complex visual problems, such as the travelling salesman problem (?; ?; ?). Numerous machine learning algorithms are NP-Complete or harder, such as the set cover machine (SCM) (?). Breakthroughs have been achieved by including humans-in-the-loop for hard optimization and combinatorial problems, (?) and (?). With these promising results there is need for further investigation into human guided machine learning.
Machine learning algorithms typically work with high dimensional datasets, which a human cannot visualize in entirity. But the high dimensionality of a dataset is not an insurmountable obstacle to effectively using a human-in-the-loop.
Approach and Implementation
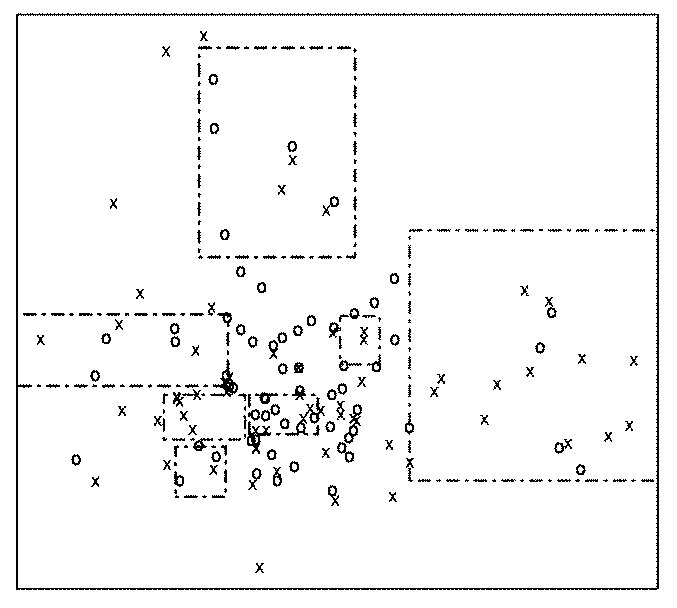
In this project we use a dimension subset approach to test out human effectiveness in creating classification models. Instead of having a human attempt high dimensional visualization, we have humans design models on pairs of dimensions. These models are then used to transform the dataset into a feature space.
XGBoost (?), short for eXtreme Gradient Boosting, is a popular machine learning library that has been used to win multiple Kaggle competitions. An XGBoost model is trained on the transformed data, and the results are compared to training XGBoost on the untransformed data. We are not restricted to only using XGBoost, other machine learning approaches also work and we have tested linear perceptrons, linear regression and support vector machines.
The following process is used to create each model.
-
1.
A pair of dimensions are selected and the training dataset () centered and normalized for those dimensions. The training dataset contains about 100 samples. The pairs are selected based on low correlation between the two dimensions. If there is low correlation, then it is easier to identify clusters of data points. Not all dimensions in a dataset are used by the workers.
-
2.
The worker is given a scatterplot of the two dimensions and proceeds to draw polygons () to separate the data into classification regions. Each polygon classifies a sample to one class (). For simplicity, the polygon is a rectangle, making the models similar to those produced by SCM (?).
-
3.
The collection of polygons drawn by the worker on a pair of dimensions is a single model (). An example of a model is shown in Figure 1.
-
4.
The model is evaluated on a test dataset () producing an accuracy score for the classification regions (), see Equation 1. Only samples contained by a polygon () in the model () contribute to the accuracy score. The test dataset contains about 200 samples.
| (1) |
The sample transformation function is shown in Equation 2, which is a weighted sum of model polygons containing the sample.
| (2) |
Then, for samples and models we have the following feature matrix.
XGBoost is trained on a subset of the samples, and then used to classify the remaining samples. To perform a fair comparison, only the dimensions used by the workers are included in the untransformed samples. For example, if the dataset has dimensions, but only dimensions are used, the XGBoost model is trained on an matrix. Thus, one XGBoost model is trained on the untransformed samples ( data matrix), and another on the transformed samples ( feature matrix).
The Amazon online service Mechanical Turk (AMT) is used to gather human produced models.
-
1.
The AMT job directs the worker to a website where they can perform the classification task.
-
2.
A scatterplot shows plotted according to the randomly chosen dimension pair, and the worker draws boxes on the scatterplot.
-
3.
A progress bar gives feedback on the accuracy of the model. Accuracy is calculated on a validation dataset . The validation dataset contains about 100 samples. Only models that achieve an accuracy above 50% are accepted, to provide quality control.
-
4.
Once the model has been accepted, the website gives the worker a job completion code.
-
5.
Back at the AMT job posting, the worker submits the code for payment.
We use five datasets with binary classification tasks. Datasets consist of one synthetic clustering task, and the rest are real world datasets from Kaggle. Most of the datasets are highly unbalanced, so we balance the datasets to have an equal number of both classes. Additionally, with the exception of the synthetic dataset, the dimensions consist of both nominal and continuous variables. A summary of the datasets is in Table 1, and the dataset sources are the following.
-
•
Madelon (Mad.) (?)
-
•
Carvana (Car.) (?)
-
•
Homesite (Home.) (?)
-
•
Melbourne (Mel.) (?)
-
•
Credit (?)
| Name | Nom. | Int. | Cont. | Note |
|---|---|---|---|---|
| Mad. | 0 | 500 | 0 | hyper-XOR problem |
| Car. | 18 | 0 | 14 | car auction |
| Home. | 295 | 0 | 1 | real estate |
| Mel. | 178 | 61 | 11 | grant applications |
| Credit | 0 | 6 | 4 | credit risks |
Results and Conclusion
Table 2 demonstrates the results from training XGBoost directly on the data, as well as on the features generated by the AMT workers. XGBoost’s model is parameterized by cross validation. The parameters are learning rate (0.01, 0.05, 0.1, 0.3), max tree depth (2, 5, 10, 15), and number of rounds (50, 100, 200, 400, 800).
| Name | M’ | M-M’ | D’ | Data | N | Features |
|---|---|---|---|---|---|---|
| Mad. | 2000 | 600 | 73 | 0.650 | 320 | 0.655 |
| Car. | 2000 | 2230 | 7 | 0.521 | 194 | 0.481 |
| Home. | 2000 | 1806 | 43 | 0.795 | 194 | 0.723 |
| Mel. | 2000 | 2500 | 9 | 0.542 | 64 | 0.512 |
| Credit | 2000 | 18052 | 8 | 0.762 | 156 | 0.717 |
We’ve shown that human guided machine learning can be crowd sourced through workers drawing polygons on scatterplots. These models do not outperform standard algorithmic approaches, but are comparable. The contribution of this project is human model creation on high dimensional datasets.
Future research will discover if and when human produced models outperform purely algorithmic approaches. In this research, human produced models did not outperform algorithmic approaches likely due to loss of information. Transforming the data using the models reduces the data granularity. A way ahead is to find a way to preserve granularity while using the human produced models.
Acknowledgements
The researchers thank the AMT workers who contributed their valuable insight.
References
- [Acuña and Parada 2010] Acuña, D. E., and Parada, V. 2010. People efficiently explore the solution space of the computationally intractable traveling salesman problem to find near-optimal tours. PloS one 5(7):e11685.
- [Anderson et al. 2000] Anderson, D.; Anderson, E.; Lesh, N.; Marks, J.; Mirtich, B.; Ratajczak, D.; and Ryall, K. 2000. Human-guided simple search. In AAAI/IAAI, 209–216.
- [Carvana 2011] Carvana. 2011. Don’t get kicked! https://www.kaggle.com/c/DontGetKicked/ data.
- [Chen and Guestrin 2016] Chen, T., and Guestrin, C. 2016. Xgboost: A scalable tree boosting system. arXiv preprint arXiv:1603.02754.
- [Dry et al. 2006] Dry, M.; Lee, M. D.; Vickers, D.; and Hughes, P. 2006. Human performance on visually presented traveling salesperson problems with varying numbers of nodes. The Journal of Problem Solving 1(1):4.
- [Guyon et al. 2004] Guyon, I.; Gunn, S.; Ben-Hur, A.; and Dror, G. 2004. Result analysis of the nips 2003 feature selection challenge. In Advances in neural information processing systems, 545–552.
- [Homesite 2015] Homesite. 2015. Homesite quote conversion. https://www.kaggle.com/c/ homesite-quote-conversion/data.
- [Kaggle 2011] Kaggle. 2011. Give me some credit. https://www.kaggle.com/c/ GiveMeSomeCredit/data.
- [Khatib et al. 2011] Khatib, F.; DiMaio, F.; Cooper, S.; Kazmierczyk, M.; Gilski, M.; Krzywda, S.; Zabranska, H.; Pichova, I.; Thompson, J.; Popović, Z.; et al. 2011. Crystal structure of a monomeric retroviral protease solved by protein folding game players. Nature structural & molecular biology 18(10):1175–1177.
- [Klau et al. 2002] Klau, G. W.; Lesh, N.; Marks, J.; and Mitzenmacher, M. 2002. Human-guided tabu search. In AAAI/IAAI, 41–47.
- [Krolak, Felts, and Marble 1971] Krolak, P.; Felts, W.; and Marble, G. 1971. A man-machine approach toward solving the traveling salesman problem. Communications of the ACM 14(5):327–334.
- [Le Bras et al. 2014] Le Bras, R.; Xue, Y.; Bernstein, R.; Gomes, C. P.; and Selman, B. 2014. A human computation framework for boosting combinatorial solvers. In Second AAAI Conference on Human Computation and Crowdsourcing.
- [Marchand and Taylor 2003] Marchand, M., and Taylor, J. S. 2003. The set covering machine. The Journal of Machine Learning Research 3:723–746.
- [of Melbourne 2010] of Melbourne, U. 2010. Predict grant applications. https://www.kaggle.com/c/unimelb/data.