rightsretained \isbn978-1-4503-4073-1/16/10 \DeclareCaptionTypecopyrightbox
Incorporating Clicks, Attention and Satisfaction into a Search Engine Result Page Evaluation Model
Abstract
Modern search engine result pages often provide immediate value to users and organize information in such a way that it is easy to navigate. The core ranking function contributes to this and so do result snippets, smart organization of result blocks and extensive use of one-box answers or side panels. While they are useful to the user and help search engines to stand out, such features present two big challenges for evaluation. First, the presence of such elements on a search engine result page (SERP) may lead to the absence of clicks, which is, however, not related to dissatisfaction, so-called “good abandonments.” Second, the non-linear layout and visual difference of SERP items may lead to non-trivial patterns of user attention, which is not captured by existing evaluation metrics.
In this paper we propose a model of user behavior on a SERP that jointly captures click behavior, user attention and satisfaction, the CAS model, and demonstrate that it gives more accurate predictions of user actions and self-reported satisfaction than existing models based on clicks alone. We use the CAS model to build a novel evaluation metric that can be applied to non-linear SERP layouts and that can account for the utility that users obtain directly on a SERP. We demonstrate that this metric shows better agreement with user-reported satisfaction than conventional evaluation metrics.
doi:
http://dx.doi.org/10.1145/2983323.2983829keywords:
Evaluation; User behavior; Click models; Mouse movement; Good abandonment1 Introduction
When looking at the spectrum of queries submitted to a web search engine, we see a heavy head of high-frequent queries (“head queries”) as well as a long tail of low-frequent queries (“tail queries”) [32]. While a small number of head queries represent a big part of a search engine’s traffic, all modern search engines can answer these queries quite well. In contrast, tail queries are more challenging, and improving the quality of results returned for tail queries may help a search engine to distinguish itself from its competitors. These queries often have an underlying informational user need: it is not the user’s goal to navigate to a particular website, but rather to find out some information or check a fact. Since the user is looking for information, they may well be satisfied by the answer if it is presented directly on a SERP, be it inside an information panel or just as part of a good result snippet. In fact, as has been shown by Stamou and Efthimiadis [33], a big portion of abandoned searches is due to pre-determined behavior: users come to a search engine with a prior intention to find an answer on a SERP. This is especially true when considering mobile search where the network connection may be slow or the user interface may be less convenient to use.
An important challenge arising from modern SERP layouts is that their elements are visually different and not necessarily placed in a single column. As was shown by Dumais et al. [13], grouping similar documents helps user to navigate faster. Since then this approach has been studied extensively by the IR community and adopted by the major search engines with so-called vertical blocks and side panels (Figure 1). When information is presented in such a way, the user examines it in a complex way, not by simply scanning it from top to bottom [11, 35, 36].

We claim that the currently used user models and corresponding evaluation metrics have several disadvantages. First, most of the models assume that the SERP consists of equally shaped result blocks, often homogeneous, presented in one column, which often prevents us from accurately measuring user attention. Second, none of the current Cranfield-style evaluation metrics account for the fact that the user may gain utility directly from the SERP. And finally, and, perhaps, the most important of all, is that the offline evaluation metrics, although sometimes based on a user model, do not learn from the user-reported satisfaction, but rather use ad-hoc notions for utility and effort.
In this paper we propose an offline evaluation metric that accounts for non-trivial attention patterns of modern SERPs and the fact that a user can gain utility not only by clicking documents, but also by simply viewing SERP items. Our approach consists of two steps, each having value on its own: (1) we build a unified model of a user’s clicks, attention and satisfaction, the Clicks, Attention and Satisfaction (CAS) model; and (2) we use this model to build a Cranfield-style evaluation metric (which we call the CAS metric).
Consequently, our research questions can be formulated as follows:
-
RQ1
Does a model that unites attention and click signals give more precise estimations of user behavior on a SERP and self-reported satisfaction? How well does the model predict click vs. satisfaction events?
-
RQ2
Does an offline evaluation metric based on such a model show higher agreement with user-reported satisfaction than conventional metrics such as DCG?
The rest of the paper is organized as follows. In Section 2 we discuss related work. Then we present our user model in Section 3. In Section 4 we present an evaluation metric based on this model. Section 5 describes our experimental setup. In Section 6 we present results of our experiments followed by a discussion in Section 7. We conclude in Section 8.
2 Related Work
2.1 Abandonment
Turpin et al. [34] show that perceived relevance of the search results as seen on a SERP (snippet relevance or direct SERP item relevance as we call it) can be different from the actual relevance and should affect the way we compute utility of the page. Li et al. [24] introduce the notion of good abandonment showing that utility can be gained directly from the SERP without clicks. Chuklin and Serdyukov [7] demonstrate that the presence of snippets answering the user query increases the number of abandonments, suggesting that the user can be satisfied without a click. A similar study has been carried out for mobile search by Arkhipova and Grauer [1], who perform online experiments and demonstrate that satisfaction may come from snippets, not just from clicked results.
2.2 Mouse movement
Another important part of related studies concerns mouse movement. It has been demonstrated that there is a strong relation between mouse movement and eye fixation, although this relation is not trivial [31]. Even though the correlation between eye fixation and mouse movement is far from perfect, the latter has been shown to be a good indicator of user attention [29], comparable in quality to eye gaze data. In later work Navalpakkam et al. [30] show that mouse movements are not always aligned with eye fixations, suggesting the idea that this behavior is user-dependent. Based on the idea of eye-mouse association, a classifier has been developed that can predict the fact of an individual user carefully reading a SERP item [26] and even the satisfaction reported by the user [27], based on mouse movements. Huang et al. [19] demonstrate that mouse movements can serve as a strong signal in identifying good abandonments. Diriye et al. [12] show that mouse movement data together with other signals can indeed yield an efficient classifier of good abandonments. Their work also introduces an experimental setup for in-situ collection of good abandonment judgements. They argue that this is the only way of collecting ground truth data, as even query owners have difficulties telling the reason for abandonment if they are asked later.
2.3 Click models
Previous work on click models is also important for our study. A click model is a probabilistic graphical model used to predict user clicks and in some cases even user satisfaction [9]. Chuklin et al. [8] suggest a way to convert any conventional click model to a Cranfield-style evaluation metric. Huang et al. [20] propose an extended click model that uses mouse interactions to slightly refine an existing click model. Chen and Min [5] adopt a generative approach where relevance, clicks and mousing are written as noisy functions of previous user actions. They use this approach to predict clickthrough rates (CTRs) of results on the SERP. Diaz et al. [11] show that visually salient SERP elements can dramatically change mouse movement trails and suggest a model that handles this.
Our work is different from previous work on good abandonment in that we not only allow for stopping after a good SERP item, but we account for this in terms of the total utility accumulated by the user, which brings us closer to the traditional Cranfield-style evaluation approach.
Our work is different from previous work on mouse movement and click models in that we do not study them separately, but use both as evidence for locating the user’s attention.
On top of that, we explicitly include in our model the notion of accumulated utility and user satisfaction as well as the possibility to gain utility from results that were not interacted with.
3 Model
Let us first describe the Clicks, Attention and Satisfaction (CAS) model that we are going to use. It is a model of user behavior on a SERP that has three components:
-
•
an attention model;
-
•
a click model; and
-
•
a satisfaction model.
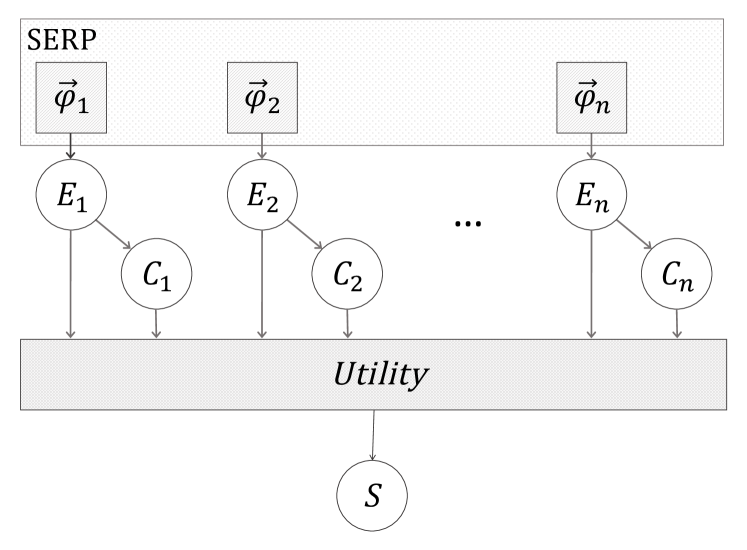
The model is visualized in Figure 2. Each SERP item gives rise to a feature vector that determines the examination event . After examination the user may or may not click through (). Then the examined and clicked documents contribute to the total utility, which, in turn determines satisfaction (). We describe each of the three components in the following sections.
We should note here that we train a relevance-based click model, where the click probability depends on the relevance label assigned by the raters and not on the document itself (see [8]). A classical click model can also be trained (from a bigger dataset) and compared using click likelihood similar to what we do in Section 6.1. However, we still need a relevance-based model to build an evaluation metric (Sections 4 and 6.2).
3.1 Attention (examination) model
Diaz et al. [11] suggest a model that predicts mouse transitions between different elements of the SERP. While mousing can be used as a proxy for user attention focus [31, 16, 30], we observe in our data entire classes of sessions where mouse tracks and attention areas are substantially different, while others are not.111For instance, currency conversion queries often result in no mousing at all, yet the user reports satisfaction. Similar patterns of discrepancy between mousing and attention have also been reported by Rodden et al. [31]. Hence, we cannot fully reconstruct the attention transition path. That is why, unlike [11], we train a pointwise model of user attention:
| (1) |
where is an index referring to one of the items comprising the SERP (result snippets, weather results, knowledge panels, etc.), is a random variable corresponding to the user examining item , is a vector of features indexed by the item , and is a function converting a feature vector into a probability. The features we use are presented in Table 1.
| Feature group | Features | # of features |
|---|---|---|
| rank | user-perceived rank of the SERP item (can be different from ) | 1 |
| CSS classes | SERP item type (Web, News, Weather, Currency, Knowledge Panel, etc) | 10 |
| geometry | offset from the top, first or second column (binary), width (), height (), | 5 |
The function that converts feature vectors into probabilities is a logistic regression. Instead of training it directly from mouse movement data, which is only a part of the examined items, we train it in such a way that it optimizes the full likelihood of the data, which includes not just mouse movement, but also clicks and satisfaction labels. More on this in the following sections.
3.2 Click model
For our click model we use a generalization of the Position-Based Model (PBM) [9], at the core of which lies an examination hypothesis, stating that in order to be clicked a document has to be examined and attractive:
| (2) | ||||
| (3) |
where is a random variable corresponding to clicking the -th SERP item, is the attractiveness probability of the SERP item . Unlike the classic PBM model, where examination is determined by the rank of the SERP item, in our model we use a more general approach to compute the examination probability , as described in Section 3.1.
3.3 Satisfaction model
Next, we propose a satisfaction model. As we noted in the introduction, user satisfaction may come from clicking a relevant result, but also from examining a good SERP item. We also assume that satisfaction is not a binary event that happens during the query session, but has a cumulative nature. In particular, we allow the situations where after examining a good document or a good SERP item the user may still continue the session. This assumption is supported by data that we collected from raters (Section 5.2).
After looking at a SERP item (referred to as “summary extracted from a bigger document” in the instructions), our raters were asked whether they think that “examining the full document will be useful to answer the question ” and if so, what the reason is. While looking at the reasons specified by the raters we found out that of the raters who said that they would click through on a SERP, indicated that their goal was “to confirm information already present in the summary,” which implies that the summary has an answer, yet the users continue examining it.
To put these ideas into a model, we assume that each relevant document or SERP item that received a user’s attention contributes towards the total utility gained by the user:
| (4) |
where and are vectors of rater-assigned labels of direct SERP item relevance and full document relevance, respectively; and are the transformation functions that convert the corresponding raters’ labels into utility values. To accommodate variable ratings from different raters, we assume and to be linear functions of the rating histogram with weights learned from the data:
| (5) | ||||
| (6) |
where and are assumed to be histograms of the ratings assigned by the raters. We have three grades for (see Figure 5, question 2) and four relevance grades for (Irrelevant, Marginally Relevant, Relevant, Perfect Match); the vectors have corresponding dimensions.
Then, we assume that the probability of satisfaction depends on the accumulated utility via the logit function:
| (7) |
where is an intercept.
Finally, we can write down the satisfaction probability as follows:
3.4 Model training
To be able to train the CAS model we make a further assumption that the attractiveness probability depends only on the relevance ratings assigned by the raters:222We also tried using separate attractiveness labels collected from the raters, but the data was too noisy due to subjective nature of the question. See Section 5.2 for more details.
| (9) |
Since the function has to yield a probability, we set it to be a logistic regression of the rating distribution.
Now that we have the model fully specified, we can write the likelihood of the observed mouse movement, click and satisfaction data and optimize it using a gradient descent method. We use the L-BFGS algorithm [25], which is often used for logistic regression optimization. It has also been shown to be robust to correlated features [28].
One important thing to note is that while computing the satisfaction probability (3.3) as part of the likelihood expression, the values of click probabilities are always either or , while the value of the examination probability can be either if there is a mouse fixation or it is computed using (1) if there is no mouse fixation on the SERP item.
4 Search Evaluation Metric
Now that we have described a model of the user’s behavior on a SERP, we can use this model to build an evaluation metric. Once the parameters of the model are fixed, it can easily be re-used for any new search ranking or layout change. This is very important when working on improving a search engine and allows for quick iterations.
Assume that we have the following judgements about the SERP items from human raters:
-
1.
direct SERP item relevance ; and
-
2.
topical relevance of the full document (assigned after clicking and examining the full document).
Assume further that we have trained the model as explained in Section 3.4. Now we can simply plug in the relevance labels and the model parameters in equation (4) to obtain the utility metric:
| (10) |
Note that after the parameters have been estimated and fixed, only the raters’ judgements and layout information are used to evaluate system performance. In this way we ensure the scalability and re-usability of the Cranfield-style offline evaluation.
5 Experimental Setup
Our first research question from the introduction requires us to build a model and evaluate it on self-reported satisfaction. That prompted us to collect a log of user actions. See Section 5.1. Similarly, for the second question from the introduction we need to have judgements from independent raters and we used crowdsourcing for it. See Section 5.2.
Below we carefully describe each step of of our data collection so as to facilitate reproducibility. Then we detail the baseline models and the way we evaluate the models.
5.1 In-situ data collection
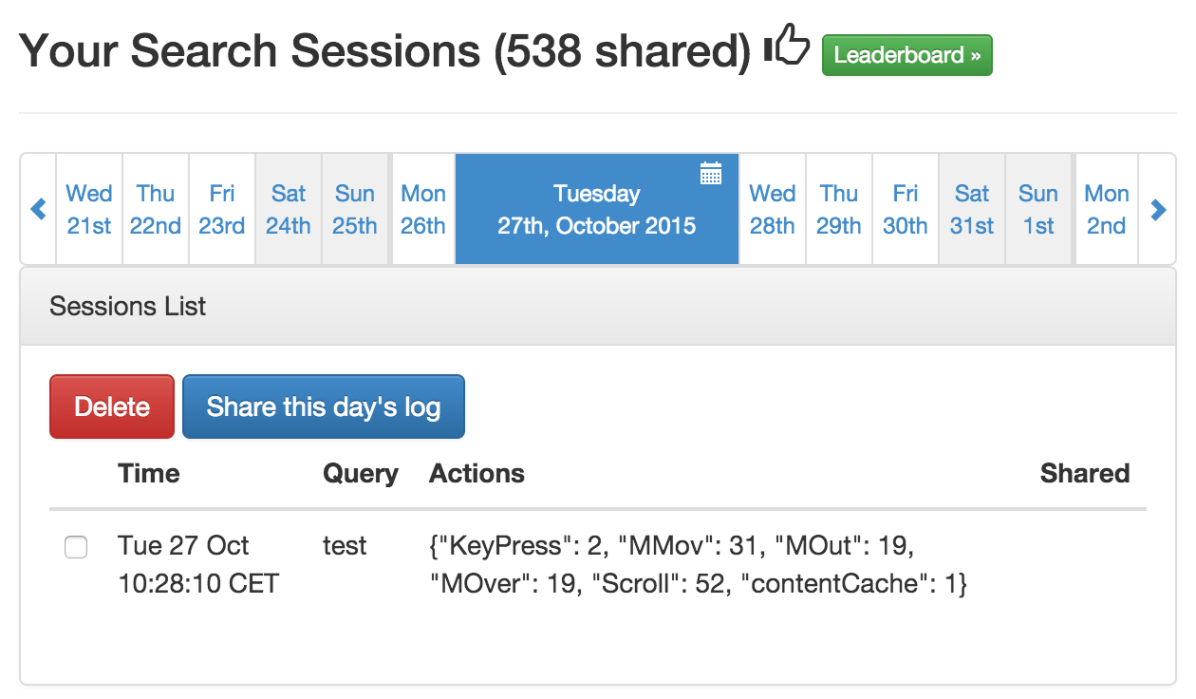
First of all, we set up a proxy search interface that intercepts user queries to a commercial search engine and collects click and mouse movements data. The log collection code is based on the EMU.js library by Guo and Agichtein [15]. The interface was used by a group of volunteers who agreed to donate their interaction data. The design of the experiment was also reviewed by the University’s Ethical Committee. We only used the queries that were explicitly vetted by the owners as not privacy sensitive using the log management interface we provide; see Figure 3.333Our code, including modifications to EMU.js is available at https://github.com/varepsilon/cas-eval.
We should also stress here, that unlike laboratory settings, the search experience was not changed: the user received the same list of results and interacted with them in the same way as if they were using the underlying search system in the normal manner. Occasionally we showed a pop-up questionnaire asking users to rate their search experience upon leaving the SERP; see Figure 4. To avoid showing it prematurely, we forced result clicks to open a new browser tab. Through this questionnaire we collected explicit satisfaction labels that we later used as ground truth to train and evaluate the CAS model.
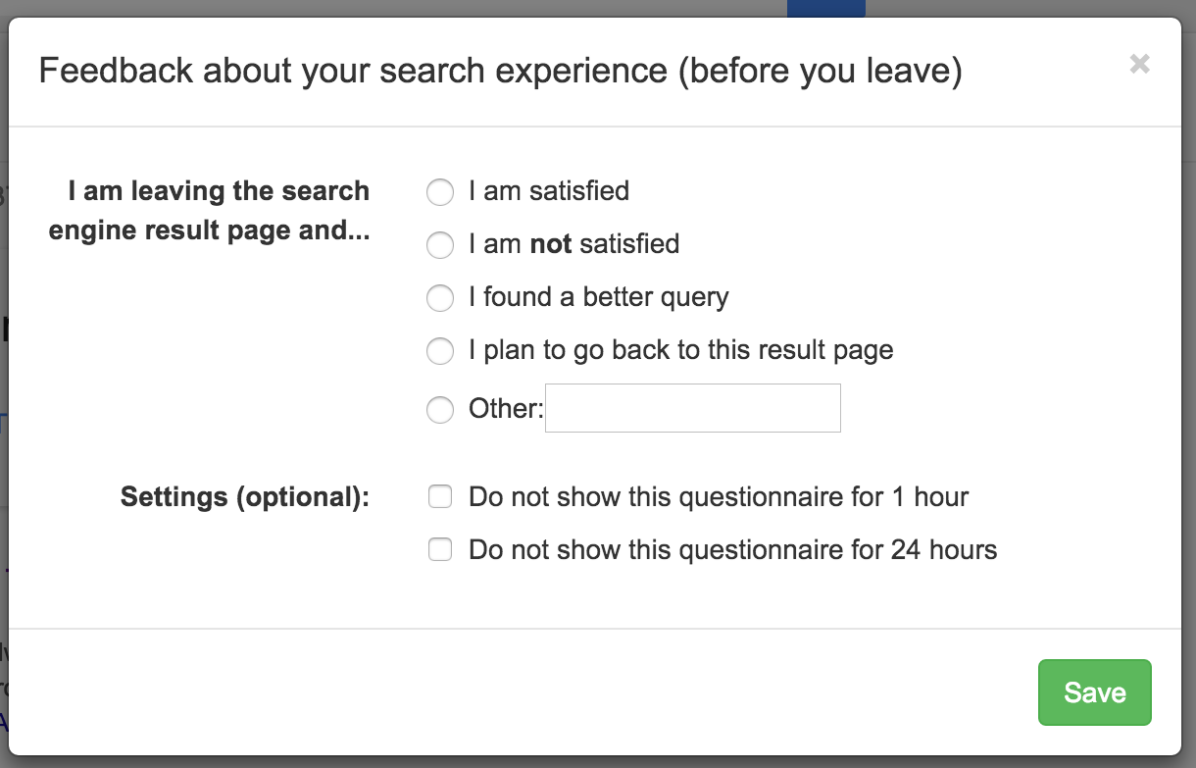
Each user saw the pop-up questionnaire no more than ten times a day and only for of the sessions. The questionnaire was equipped with “mute buttons” that allowed the user to disable the questions for one hour or hours. We assumed that this questionnaire, if it was not shown overly frequently, would not seriously affect the overall user experience. A similar setup was used in [12].
The dataset parameters are summarized in Table 2.
| # of participants | |
| # of shared sessions (queries) | |
| # of shared sessions with satisfaction feedback |
5.2 Crowdsourcing data collection
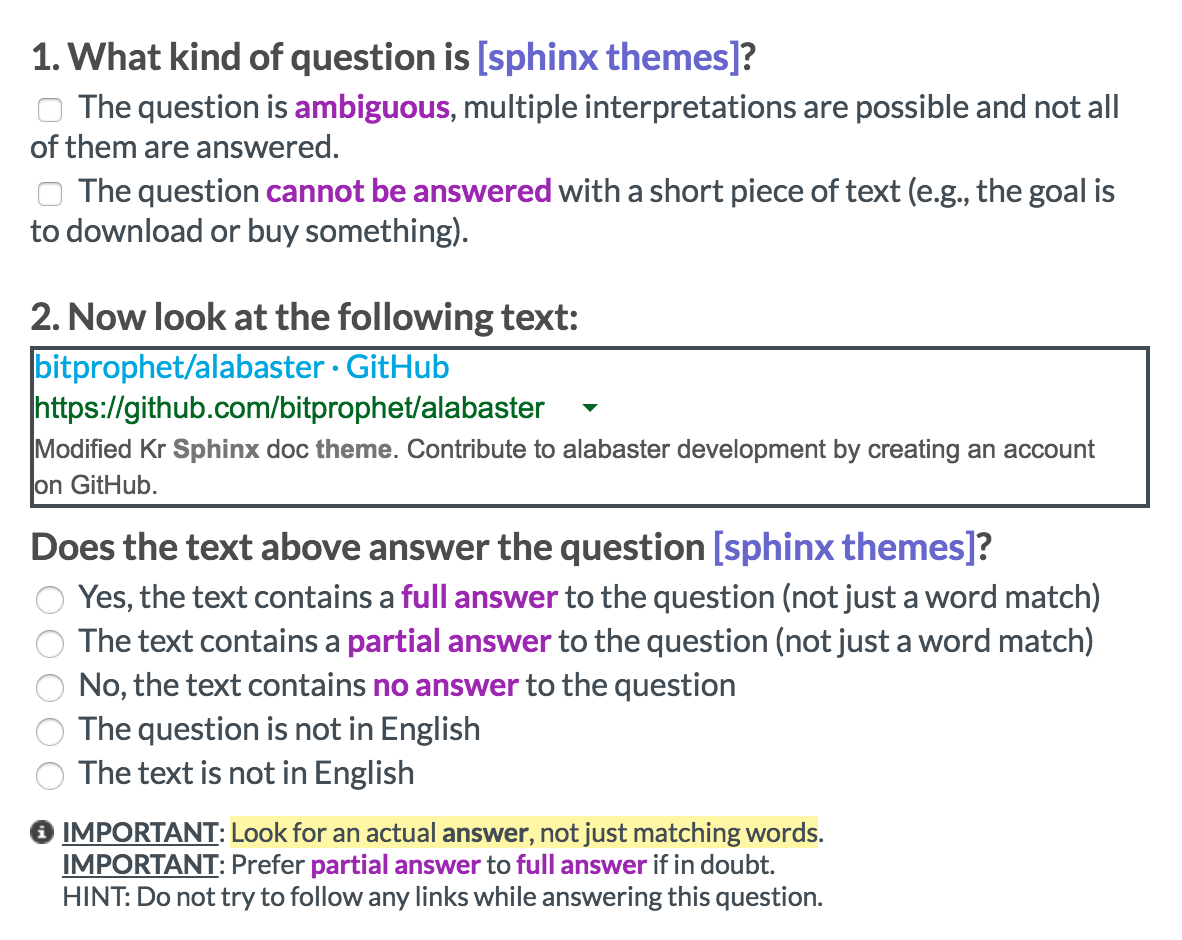
As a second stage of our experiment we asked crowdsourcing raters (“workers”) to assign (D) and (R) labels (see Section 4) by showing them SERP items or corresponding web documents and asking the following questions:
-
(D)
Does the text above answer the question ?
-
(R)
Does the document that you see after clicking the link contain an answer to the question ?
For the first question we showed only the part of the SERP corresponding to a single SERP item and no clickable links. For the second one we only showed a link and required the workers to click it. Moreover, the above two tasks were run separately so the chances of raters confusing the two tasks were quite low. When comparing the most common (D) and (R) labels assigned for each document, they show Pearson correlation values of and Spearman correlation values of only , which proves that they are quite different.
Originally, a third question was also included to collect attractiveness labels (“(A)-ratings”) to be used instead of (R) relevance in (9). It ran as follows: “Above is a summary extracted from a bigger document. Do you think examining the full document will be useful to answer the question ?” However, this proved to be a very subjective question, and attractiveness labels collected this way were less useful as click predictor compared to relevance labels (R). To be precise, the average (A)-rating for the clicked results was , while it was for non-clicked ( standard deviation for both). For the (R)-ratings the corresponding numbers were as follows: (standard deviation of ) for clicked and (standard deviation of ) for non-clicked. That proves that (R) serves better as a click predictor.
From preliminary runs of the crowdsourcing experiment we learned that the crowd workers rarely pay attention to the detailed instructions of a task, so we decided against using terms like “query” (we used question instead) or “snippet” (we referred to it as text or summary). After several iterations of improving the task we also decided to ask the raters to provide justifications for their answers. We later used this as an additional signal to filter out spammers (see Appendix A), but it can also be used to understand more about the complexity of individual questions or the task as a whole [2]. One application for the data collected in this way we already saw when we discussed the satisfaction model in Section 3.3. Another analysis that we ran was to identify potential good abandonments, i.e., queries that may be answered directly on a SERP [24]. We found out that, even though the raters often disagree with themselves,444Approximately of the raters said that a query is both a potential good and bad abandonment when a slightly different wording was used (or indicated that a potential bad abandonment query has an answer on a SERP). the queries that were marked as potential good abandonments most often by the raters, were all labeled as such in an independent rating.
An example of the task interface is shown in Figure 5. We used the CrowdFlower platform, which is the only crowdsourcing platform we know of that is available outside of the US. Workers were paid per task to keep the hourly pay above , well above the minimum wage of one of the author’s home country and a psychological threshold for the raters to treat it as a fair pay.555The workers were shown an optional survey at the end of the task where they rated “Pay” from to (out of ).
The key parameters of the dataset that we collected in this manner are summarized in Table 3.666The anonymized version of the dataset can be obtained at http://ilps.science.uva.nl/resources/cas-eval.
| (D) | (R) | |
|---|---|---|
| # of workers | ||
| # of ratings | ||
| # of snippets/documents rated |
After removing ratings coming from spammers (see Appendix A) and sessions that are labeled as something other than “I am satisfied” or “I am not satisfied” (see Figure 4) we are left with query sessions. Of those, were marked as satisfactory; (24 items) of the SERPs are heterogeneous, meaning that they have something other than “ten blue links.” For these queries we have rated results. If an item does not have a rating, we assume the lowest rating 0, although more advanced approaches exist [3, 4].
5.3 Baseline models/metrics
To compare the performance of our CAS model, we implemented the following baseline models:
- •
-
•
the PBM position-based model [9], a robust model with fewer parameters than UBM;
-
•
a random model that predicts click and satisfaction with fixed probabilities (learned from the data).
Apart from these, we also included the following metrics:
- •
-
•
the uUBM metric, the metric that showed the best results in [8]. It is similar to the above UBM model, but parameters are trained on a different and much bigger dataset, namely a search log of Yandex.777https://yandex.com, the most used search engine in Russia.
This way we include both non-model-based (DCG) and model-based metrics (the rest), but also locally trained models (UBM, PBM) as well as the uUBM model trained on a different dataset.
For testing we employ -fold cross-validation that we restart times, each time reshuffling the data, see Algorithm 1. Thus, we have experimental outcomes that we aggregate to assess significance of the results.
6 Results
Below we report results on comparing the CAS model and corresponding evaluation metric to other models and metrics, respectively.
6.1 Evaluating the CAS model
We evaluate the CAS model by comparing the log-likelihood values for different events, viz. clicks and satisfaction. We also analyse the contribution of different attention features introduced in Table 1.
Likelihood of clicks
First, we would like to know how the CAS model compares to the baseline models in terms of log-likelihood. Figure 6 shows the likelihood of clicks for different models. On top of the CAS model described above, we also included three modifications:
-
•
CASnod is a stripped-down version that does not use (D) labels;
-
•
CASnosat is a version of the CAS model that does not include the satisfaction term (3.3) while optimizing the model; and
-
•
CASnoreg is a version of the CAS model that does not use regularization while training.888All other models were trained with -regularization.
As we can see from Figure 6, the difference between different variants of CAS is minimal in terms of click log-likelihood, but we will see later that they are, in fact, different. UBM and PBM show better log-likelihood values on average, with PBM being more robust. There are two reasons for CAS to underperform here. First, it is trained to optimize the full likelihood, which includes moused results and satisfaction, not just the likelihood of clicks. As we will see later, CAS shows much better likelihood for satisfaction, more than enough to make up for a slight loss in click likelihood. Second, the class of models for examination and attractiveness probabilities we have chosen (logistic regression) may not be flexible enough compared to the arbitrary rating-to-probability mappings used by PBM and UBM. While similar rating-to-probability mappings can be incorporated into CAS as well, it makes the training process much harder and we leave it for future work.
Likelihood of satisfaction
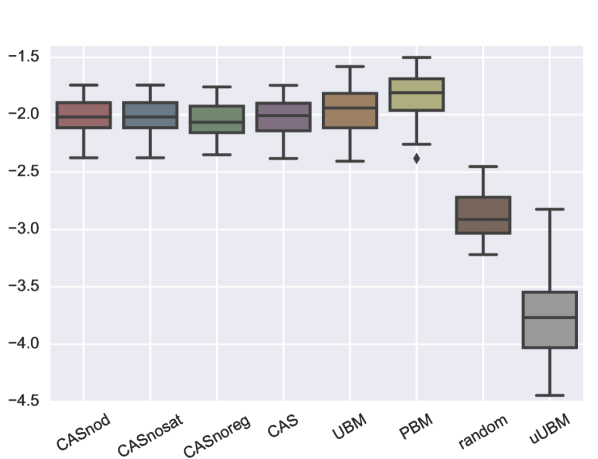
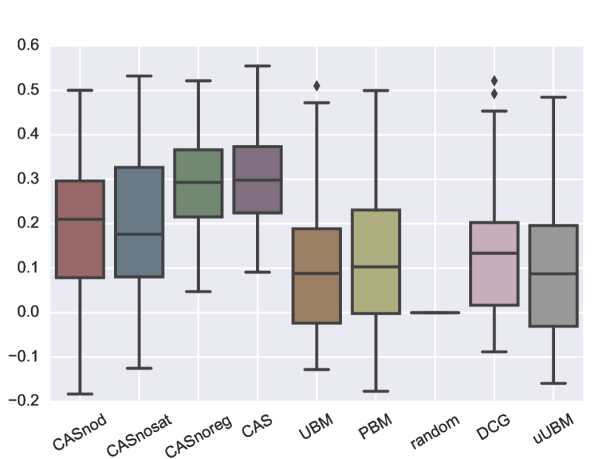
Next, we look into the log-likelihood of the satisfaction predicted by the various models; see Figure 7. For the models that do not have a notion of satisfaction (CASnosat, UBM, PBM, uUBM), we used the sigmoid transformation of the utility function, which, in turn, was computed as the expected sum of relevance of clicked results (see [8]). However, all such models were inferior to the random baseline; this finding supports the idea of collecting satisfaction feedback directly from the user instead of relying on an ad-hoc interpretation of utility that may be quite different from the user’s perception of satisfaction.
By comparing the results for CAS vs. CASnoreg in Figure 7 we also see that regularization leads to a more stable satisfaction prediction likelihood, which is, however, lower on average. If we have a large sample of data that is representative of the user population, regularization may as well be omitted. By comparing the performance of CAS vs. CASnod we can also see that the lack of (D) ratings clearly hurts the model’s performance as it now cannot explain some of the utility directly gained from the SERP.
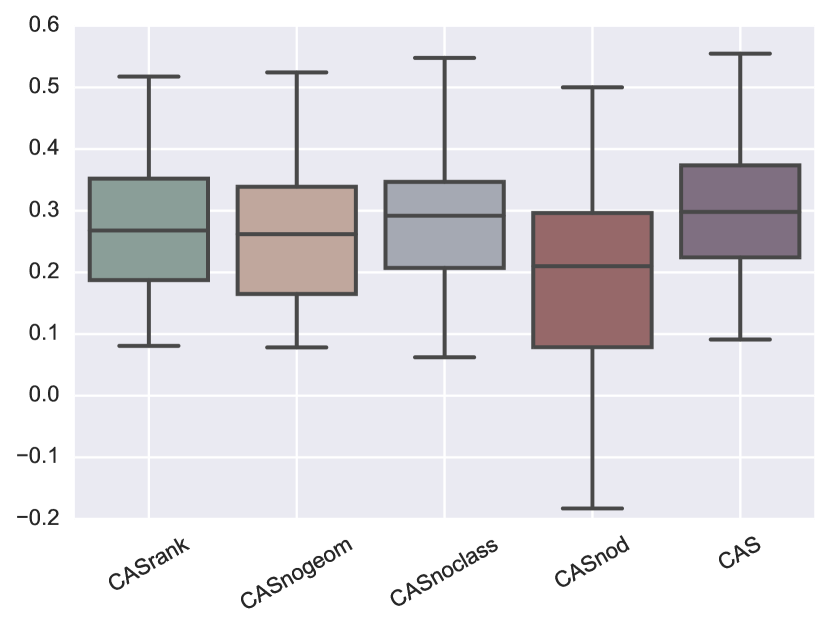
Analyzing the attention features
Finally we look at the features used by the attention model (Table 1). If we exclude some of these features we obtain the following simplified versions of the CAS model:
-
•
CASrank is the model that only uses the rank to predict attention; this makes the attention model very similar to PBM and the existence of the satisfaction component (3.3) is what makes the biggest difference;
-
•
CASnogeom is the model that only uses the rank and SERP item type information and does not use geometry; and
-
•
CASnoclass is the model that does not use the CSS class features (SERP item type).
We compare these models to the vanilla CAS and CASnod models in terms of log-likelihood of click and satisfaction prediction as we did above for the baseline models.
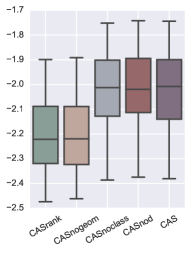
What we can see from these plots is that excluding (D) labels (CASnod) almost does not affect click prediction accuracy, but it does substantially hurt the satisfaction prediction. This is expected as these labels are only used in the satisfaction formula (3.3). On the other hand, removing geometry features (CASnogeom, CASrank) hurts click prediction the most, while having a less prominent impact on satisfaction prediction. Finally, removing CSS class features (CASnoclass) has a small effect on both click and satisfaction prediction, but much smaller than removing geometry affects click prediction or removing (D) labels affects satisfaction prediction.
In this section we showed that the CAS model predicts clicks slightly worse than the baseline models, albeit at roughly the same level. When it comes to predicting satisfaction events, the baseline models show much lower log-likelihood values, the only comparable performance is shown by the random model, but it still performs worse than CAS. In terms of incorporating satisfaction into our models, we demonstrated that it is necessary to do so in order to beat the random baseline on the log-likelihood of satisfaction (CASnosat is always worse than the baseline) and the (D)-labels play an essential role for model accuracy: CASnod shows lower log-likelihood than the CAS. This answers our first research question RQ1.
6.2 Evaluating the CAS metric
Now we evaluate the metric derived from the CAS model and described in Section 4. To do this we compute correlations with baseline metrics and with user-reported satisfaction.
Correlation between metrics
Table 4 shows the average Pearson correlation between utilities produced by different metrics averaged across folds and repetitions of cross-validation.
| CASnosat | CASnoreg | CAS | UBM | PBM | DCG | uUBM | |
|---|---|---|---|---|---|---|---|
| CASnod | 0.593 | 0.564 | 0.633 | 0.470 | 0.487 | 0.546 | 0.441 |
| CASnosat | 0.664 | 0.715 | 0.707 | 0.668 | 0.735 | 0.684 | |
| CASnoreg | 0.974 | 0.363 | 0.379 | 0.417 | 0.341 | ||
| CAS | 0.377 | 0.394 | 0.440 | 0.360 | |||
| UBM | 0.814 | 0.972 | 0.882 | ||||
| PBM | 0.906 | 0.965 | |||||
| DCG | 0.943 |
As we can see, metrics from the CAS family are less correlated with the baseline metrics than they are with each other. The highest level of correlation with the baseline metrics among the CAS metrics is achieved by CASnosat, the metric that does not explicitly include satisfaction in the user model. This is expected as its model is close to PBM. Another observation from Table 4 is that CASnod is also quite different from the baseline metrics, but not as much as CASnoreg and CAS, which, again, shows that including (D) relevance labels (direct snippet relevance) makes the metric quite different.
Correlation with user-reported satisfaction
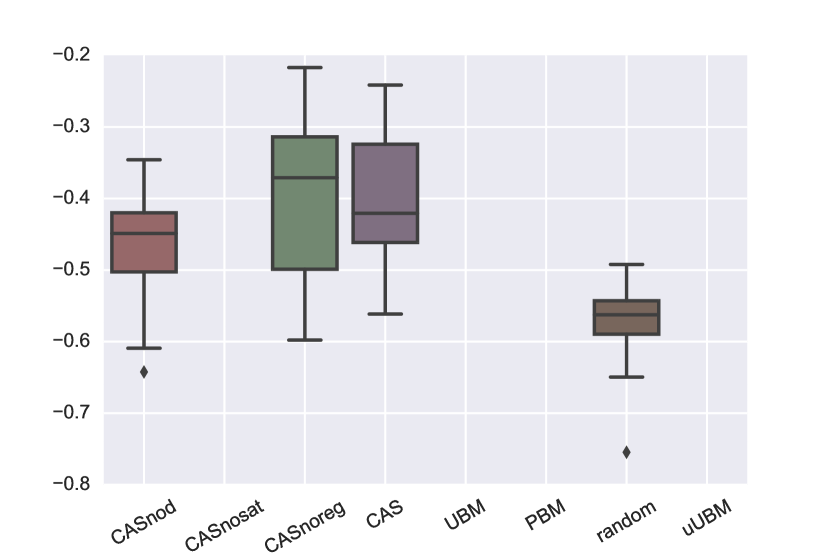
Figure 9 shows the Pearson correlation between the utility induced by one of the models and the satisfaction reported by the user (zero or one).
As we can see from the plot, the metric induced by the CAS model shows the best Pearson correlation values, despite the fact that it was trained to maximize the full likelihood of the data, not just to predict satisfaction. Correlation is always above zero for metrics based on CAS and CASnoreg, but for the metrics based on CASnod and CASnosat the correlation can be negative, which, again, reinforces the importance of the (D) labels and the explicit satisfaction component in the model. While comparing CAS to the baseline models, we observed that the correlation values for the CAS-based metrics are at least higher on average.
To prove that the CAS model is especially useful in case of heterogeneous SERPs we performed the following experiment. We made a stratified random split of the dataset into training and testing, where the test set contains of the data and exactly one heterogeneous SERP (as we mentioned in Section 5.2, our dataset contains such SERPs). We then computed utility of this one SERP using the metric trained on the train set and compared it to the satisfaction label for the corresponding session. We then repeated this process times and computed the Pearson correlation of the utilities and satisfaction labels. Results are reported in Table 5. We see that metrics of the CAS family show much higher correlation with the user-reported satisfaction then other metrics.
| CAS | UBM | PBM | random | DCG | uUBM |
|---|---|---|---|---|---|
| 0.60 | 0.38 | -0.05 | -0.39 | 0.24 | -0.08 |
| CASrank | CASnogeom | CASclass | CASnod | CASnosat | CASnoreg |
| 0.15 | -0.04 | 0.27 | -0.04 | 0.48 | 0.67 |
Analyzing the attention features
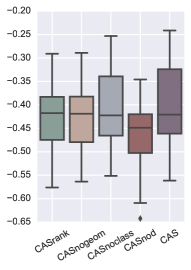
Similar to our analysis in Section 6.1 we perform an ablation study, this time to compare vanilla CAS to CASrank, CASnogeom, CASnoclass and CASnod in terms of how well the metric induced by them is correlated with user-reported satisfaction. The results are shown in Figure 10.
As can be see from the plot, removing the class features reduces correlation only a little (CAS vs. CASnoclass). We hypothesize that the reason for this is that in our dataset only of the SERPs have non-trivial SERP items. Removing geometry features (CASnogeom) or both geometry and class features (CASrank) already makes the metric perform worse, which supports the fact that modern SERPs require a non-trivial attention model. Finally, the worst performing metric is CASnod which does not use the (D)-labels. The performance drop is much higher than for the models discussed above, which shows that attention features are important for satisfaction prediction, but having (D)-labels brings more to the table. This is consistent with the analysis of the results reported in Figure 8b.
In this section we showed that the metric based on the CAS model that we propose differs substantially from the baseline metrics, but less so if the model does not include (D) labels or disregards the satisfaction term altogether. More importantly, the CAS metric is not just different from the baseline metrics, it also shows better correlation with the satisfaction reported by users. So, indeed, incorporating satisfaction yields a new and interesting metric, which answers RQ2.
7 Discussion
First of all, we would like to acknowledge some limitations of the paper. Our dataset is small compared to the typical datasets used for training click models [9] and may be somewhat biased in terms of query distribution since most of the users whose data was used have a Computer Science background. It would be preferable to collect such data at a bigger scale. One direction for future work would be to train the CAS model on heterogeneous data, where potentially a bigger dataset with clicks and mousing is supplemented by a smaller one with satisfaction labels.
Feature engineering for the attention model is also not comprehensive and was not a goal of the current paper. One may add more saliency features to detect the users’ attention or even train separate skimming and reading models [26].
Another challenging part in our setup is the use of crowd workers. It would be interesting to run a study with trained raters and learn how to extrapolate it to the crowd, by adjusting the instructions and filtering the spammers in a more automated fashion than we have used [22]. There is also a noticeable difference between raters and the users. For example, Liu et al. [27] claim that the raters pay more attention to the effort required to complete a task, while the users care more about utility. Also, the ratings assigned by the owners of the query are different from the ones assigned by other people [6].
Mobile search evaluation [17, 18] is another facet of future work. As we mentioned before, navigating away from a SERP is more expensive there, so the users tend to gain utility directly from the SERP and the search engines add more ways to help this. It would be interesting to see how we can leverage additional attention signals to adapt the CAS model for mobile settings.
8 Conclusion
In this paper we have presented a model of user behavior that combines clicks, attractiveness and satisfaction in a joint model, which we call the CAS model. We have also proposed a method to estimate the parameters of the model and have shown how a Cranfield-style offline evaluation metric can be built on top of this model. We have also described the crowdsourcing setup to collect labels for individual documents.
We have demonstrated that the model conceived in this way can be used as a robust predictor of user satisfaction without sacrificing its ability to predict clicks. We have also shown that decoupling satisfaction from attention and clicks leads to inferior satisfaction prediction without gain in predicting clicks.
In addition, we have presented a metric that can be used for offline search system evaluation, an important component of ranking development. The CAS metric with parameters trained from user data consistently shows correlation with satisfaction, unlike traditional metrics. Moreover, the metric is quite different, suggesting that including it into one’s evaluation suite may lead to a different view on which version of the ranking system is better.
While the current study has its limitations, we view it as a motivation to move away from the ten blue links approach and adopt an evaluation metric that uses rich features and relevance signals beyond traditional document relevance. We also call for releasing a dataset that would allow for a more comprehensive evaluation than currently provided by TREC-style evaluation setups.
Acknowledgements. This research was supported by Ahold, Amsterdam Data Science, Blendle, the Bloomberg Research Grant program, the Dutch national program COMMIT, Elsevier, the European Community’s Seventh Framework Programme (FP7/2007-2013) under grant agreement nr 312827 (VOX-Pol), the ESF Research Network Program ELIAS, the Royal Dutch Academy of Sciences (KNAW) under the Elite Network Shifts project, the Microsoft Research Ph.D. program, the Netherlands eScience Center under project number 027.012.105, the Netherlands Institute for Sound and Vision, the Netherlands Organisation for Scientific Research (NWO) under project nrs 727.011.005, 612.001.116, HOR-11-10, 640.006.013, 612.066.930, CI-14-25, SH-322-15, 652.002.001, 612.001.551, the Yahoo Faculty Research and Engagement Program, and Yandex. All content represents the opinion of the authors, which is not necessarily shared or endorsed by their respective employers and/or sponsors. The choice of baseline models and the CAS model suggested here are based on prior work and the authors’ own ideas and not on practices used by commercial companies that the authors are affiliated with or receiving funding from.
REFERENCES
- Arkhipova and Grauer [2014] O. Arkhipova and L. Grauer. Evaluating mobile web search performance by taking good abandonment into account. In SIGIR, pages 1043–1046. ACM, 2014.
- Aroyo and Welty [2014] L. Aroyo and C. Welty. The three sides of CrowdTruth. Human Computation, 1(1):31–44, 2014.
- Aslam and Yilmaz [2007] J. A. Aslam and E. Yilmaz. Inferring document relevance from incomplete information. In CIKM, pages 633–642. ACM, 2007.
- Büttcher et al. [2007] S. Büttcher, C. L. A. Clarke, P. C. K. Yeung, and I. Soboroff. Reliable information retrieval evaluation with incomplete and biased judgements. In SIGIR, pages 63–70. ACM, 2007.
- Chen and Min [2015] X. Chen and H. Min. Improving click model by combining mouse movements with click-through data. In ICSESS, pages 183–187, 2015.
- Chouldechova and Mease [2013] A. Chouldechova and D. Mease. Differences in search engine evaluations between query owners and non-owners. In WSDM, pages 103–112. ACM, 2013.
- Chuklin and Serdyukov [2012] A. Chuklin and P. Serdyukov. Good abandonments in factoid queries. In WWW, pages 483–484. ACM Press, 2012.
- Chuklin et al. [2013] A. Chuklin, P. Serdyukov, and M. de Rijke. Click model-based information retrieval metrics. In SIGIR, pages 493–502. ACM, 2013.
- Chuklin et al. [2015] A. Chuklin, I. Markov, and M. de Rijke. Click Models for Web Search. Morgan & Claypool, 2015.
- Cohen [1960] J. Cohen. A coefficient of agreement for nominal scales. Educational and Psychological Measurement, XX(1):37–46, 1960.
- Diaz et al. [2013] F. Diaz, R. W. White, G. Buscher, and D. Liebling. Robust models of mouse movement on dynamic web search results pages. In CIKM. ACM, 2013.
- Diriye et al. [2012] A. Diriye, R. W. White, G. Buscher, and S. T. Dumais. Leaving so soon? Understanding and predicting search abandonment rationales. In CIKM, pages 1025–1034. ACM, 2012.
- Dumais et al. [2001] S. Dumais, E. Cutrell, and H. Chen. Optimizing search by showing results in context. In CHI, pages 277–284. ACM, 2001.
- Dupret and Piwowarski [2008] G. Dupret and B. Piwowarski. A user browsing model to predict search engine click data from past observations. In SIGIR, pages 331–338. ACM, 2008.
- Guo and Agichtein [2008] Q. Guo and E. Agichtein. Exploring mouse movements for inferring query intent. In SIGIR, pages 707–708. ACM, 2008.
- Guo and Agichtein [2010] Q. Guo and E. Agichtein. Towards predicting web searcher gaze position from mouse movements. In CHI’10 Extended Abstracts on Human Factors in Computing Systems, pages 3601–3606. ACM, 2010.
- Guo et al. [2013] Q. Guo, H. Jin, D. Lagun, S. Yuan, and E. Agichtein. Mining touch interaction data on mobile devices to predict web search result relevance. In SIGIR, pages 153–162. ACM, 2013.
- Huang and Diriye [2012] J. Huang and A. Diriye. Web user interaction mining from touch-enabled mobile devices. In HCIR, 2012.
- Huang et al. [2011] J. Huang, R. W. White, and S. Dumais. No clicks, no problem: using cursor movements to understand and improve search. In CHI, pages 1225–1234. ACM, 2011.
- Huang et al. [2012] J. Huang, R. W. White, G. Buscher, and K. Wang. Improving searcher models using mouse cursor activity. In SIGIR. ACM, 2012.
- Järvelin and Kekäläinen [2002] K. Järvelin and J. Kekäläinen. Cumulated gain-based evaluation of IR techniques. ACM Transactions on Information Systems, 20(4):422–446, 2002.
- Kazai and Zitouni [2016] G. Kazai and I. Zitouni. Quality management in crowdsourcing using gold judges behavior. In WSDM, pages 267–276. ACM, 2016.
- Krippendorff [1970] K. Krippendorff. Estimating the reliability, systematic error and random error of interval data. Educational and Psychological Measurement, 30(1):61–70, 1970.
- Li et al. [2009] J. Li, S. Huffman, and A. Tokuda. Good abandonment in mobile and PC internet search. In SIGIR, pages 43–50. ACM, 2009.
- Liu and Nocedal [1989] D. C. Liu and J. Nocedal. On the limited memory bfgs method for large scale optimization. Mathematical programming, 45(1-3):503–528, 1989.
- Liu et al. [2014] Y. Liu, C. Wang, K. Zhou, J. Nie, M. Zhang, and S. Ma. From skimming to reading: A two-stage examination model for web search. In CIKM, pages 849–858. ACM, 2014.
- Liu et al. [2015] Y. Liu, Y. Chen, J. Tang, J. Sun, M. Zhang, S. Ma, and X. Zhu. Different users, different opinions: Predicting search satisfaction with mouse movement information. In SIGIR, pages 493–502. ACM, 2015.
- Minka [2003] T. P. Minka. A comparison of numerical optimizers for logistic regression. Unpublished draft, 2003.
- Navalpakkam and Churchill [2012] V. Navalpakkam and E. F. Churchill. Mouse tracking: Measuring and predicting users’ experience of web-based content. In CHI, pages 2963–2972. ACM, 2012.
- Navalpakkam et al. [2013] V. Navalpakkam, L. Jentzsch, R. Sayres, S. Ravi, A. Ahmed, and A. Smola. Measurement and modeling of eye-mouse behavior in the presence of nonlinear page layouts. In WWW, pages 953–964. ACM, 2013.
- Rodden et al. [2008] K. Rodden, X. Fu, A. Aula, and I. Spiro. Eye-mouse coordination patterns on web search results pages. In CHI, pages 2997–3002, 2008.
- Silverstein et al. [1998] C. Silverstein, M. Henzinger, H. Marais, and M. Moricz. Analysis of a very large altavista query log. Techn. report, Systems Research Center, Compaq Computer Corporation, 1998.
- Stamou and Efthimiadis [2010] S. Stamou and E. N. Efthimiadis. Interpreting user inactivity on search results. In ECIR, pages 100–113. Springer, 2010.
- Turpin et al. [2009] A. Turpin, F. Scholer, K. Jarvelin, M. Wu, and J. S. Culpepper. Including summaries in system evaluation. In SIGIR, pages 508–515. ACM, 2009.
- Wang et al. [2013] C. Wang, Y. Liu, M. Zhang, S. Ma, M. Zheng, J. Qian, and K. Zhang. Incorporating vertical results into search click models. In SIGIR, pages 503–512. ACM, 2013.
- Wang et al. [2015] C. Wang, Y. Liu, M. Wang, K. Zhou, J. Nie, and S. Ma. Incorporating non-sequential behavior into click models. In SIGIR, pages 283–292. ACM, 2015.
Appendix A Filtering Spammers
To identify spammers, we used the free-text fields where the raters were asked to copy text from the snippet or full document to support their relevance ratings. If the text was not copied from the snippet (in case of direct snippet relevance) or contained gibberish words, we added this worker to the list of suspicious workers. After each batch of tasks sent for ratings was finished, we manually reviewed top lowest scoring workers according to those metrics and banned them from the future tasks.999Manual examination of the worker’s ratings before banning is enforced by the crowdsourcing platform that we used. We also ignored workers with fewer than three ratings following [2]. In total, we ignored ratings coming from workers out of , which corresponds to of direct snippet relevance ratings (D) and of relevance ratings (R).
To measure worker disagreement we reported average Cohen’s kappa [10] as well as Krippendorf’s alpha [23]. The numbers are reported in Table 6.
| % of workers | % of ratings | Cohen’s | Krippendorf’s | |
|---|---|---|---|---|
| label | removed | removed | kappa | alpha |
| (D) | 32% | 27% | 0.339 | 0.144 |
| (R) | 41% | 29% | 0.348 | 0.117 |
As we can see, the agreement numbers are rather low, which shows that there is still a big variation of opinions. Fortunately, our model is able to accommodate this by taking the histogram of ratings and not just a single number coming from averaging or majority vote, see equations (5), (6) and (9).
We also experimented with worker-worker and worker-task disagreement scores [2]. We remove workers that disagree with too many other workers on either global or per-item level. We explored different thresholds on disagreement scores and managed to improve overall agreement measured by Cohen’s kappa and Krippendorf’s alpha (which was expected) but it did not improve the results (Section 6). We suspect that the reason is that there are always enough careless workers that consistently give wrong answers and show good agreement with each other, and the worker disagreement-based method is not able to catch them. Moreover, some disagreement is natural in such a subjective task; reducing it does not necessarily improve quality.
Finding a good balance between data quantity and data quality is a topic for a different discussion and is outside the scope of this paper. Changing the settings for spammer filtering to very aggressive (removing all workers that made at least one mistake thus filtering out over of the ratings) and to very permitting (no spammer filtering) both give rise to models with inferior performance both in terms of likelihood of clicks/satisfaction and the correlation of utility and user-reported satisfaction.