The donor of Aquila X-1 revealed by high angular resolution near-infrared spectroscopy
Abstract
The low mass X-ray binary Aquila X-1 is one of the most active neutron star X-ray transients. Despite its relatively bright quiescent optical counterpart, the detection of its companion has been hampered by the presence of a nearby interloper star. Using the infrared integral field spectrograph SINFONI on the VLT-8.2m telescope, we unambiguously single out Aquila X-1 from the interloper. Phase-resolved near infrared spectroscopy reveals absorption features from a companion star moving at a projected velocity of . We here present the first dynamical solution and associated fundamental parameters of Aquila X-1, imposing new constraints on the orbital inclination () and the distance () to this prototypical neutron star transient.
keywords:
accretion, accretion discs – X-rays: binaries – stars: neutron stars1 Introduction
Neutron star X-ray transients (NSXRTs) are a sub-type of low mass X-ray binaries harbouring a low mass star () and a neutron star (NS). They spend most of their lives in a faint, quiescent state, but show occasional outbursts where their X-ray luminosity increases above per cent of the Eddington luminosity. Observing NSXRTs in outburst, while convenient for accretion studies (e.g. Muñoz-Darias et al. 2014), implies that most of the system luminosity arises from non-stellar components, completely veiling the companion star spectral features and preventing a dynamical solution even in the infrared (e.g. Mata Sánchez et al. 2015). On the other hand, the study of NSXRTs in their fainter, quiescent state – where the relative contribution of the companion star to the total flux is larger – depends greatly on the distance to the source and the Galactic extinction.
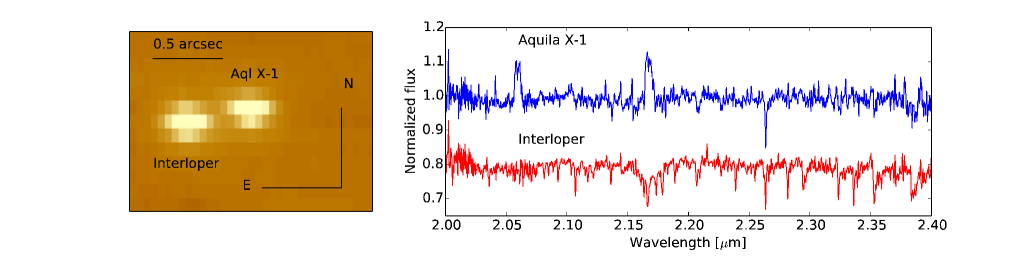
Aquila X-1 (hereafter Aql X-1, discovered by Kunte et al. 1973) is a recurrent NSXRT which has exhibited both coherent millisecond X-ray pulsations at (Casella et al., 2008) and thermonuclear bursts (e.g. Galloway et al. 2008). Despite showing recurrent outbursts and having a relatively accessible quiescent optical magnitude (V=21.6, Chevalier et al. 1999), a radial velocity study of the donor star is still missing. This has been prevented by the presence of an interloper star placed less than 0.5 arcsec apart from Aql X-1 (Chevalier et al., 1999). The interloper is mag brighter than Aql X-1 in the V-band but of comparable brightness at NIR wavelengths. In this work, we exploit the better spatial resolution inherent to the near-infrared (nIR) observations as well as adaptive optics techniques to obtain phase resolved, Integral Field Spectroscopy (IFS), which allow us to clearly resolve Aql X-1 from the interloper star.
2 Observations
SINFONI is a nIR integral field spectrograph fed by an adaptive optics module currently installed at the Cassegrain focus of the 8.2m Very Large Telescope (VLT) at Cerro Paranal (Chile). We obtained IFS in K-band (resolving power ) with an adaptive optics module working under natural guide star mode and a spatial pixel scale of (with a field-of-view of )
The campaign includes 24 observations performed across several nights and sampling different orbital phases (always during the quiescent state) from 5 May 2010 to 29 September 2011. Each observation consists of 3-nodding exposures that were combined to subtract the sky contribution for a total exposure time of per observation. The reduction of the spectroscopic cubes was performed using public SINFONI pipeline recipes. The final products are 24 cubes, where Aql X-1 and the interloper star are clearly resolved (see Fig.1) with a typical full-width-at-half-maximum (FWHM) of (note that the K-band diffraction limit for an 8.2m telescope is ). Early type standard stars were observed each night with the same instrumental configuration in order to carry out a telluric correction. Likewise, K0–M0 spectral type templates were obtained for radial velocity analysis and spectral classification.
We extracted the spectra using an aperture radius of , which provided independent, non-contaminated spectra of both Aql X-1 and the interloper. Spectra were analysed with the molly software. A telluric correction was applied using the atmospheric transmission profile derived from each standard star after masking their early type spectral features. Since our study requires precise measurement of orbital velocities, a wavelength correction due to flexure effects was performed using the sky spectra. The spectra were re-calibrated using OH emission lines (Rousselot et al., 2000), which yielded corrections under . The final, averaged spectra are presented in Fig.1.
3 Results
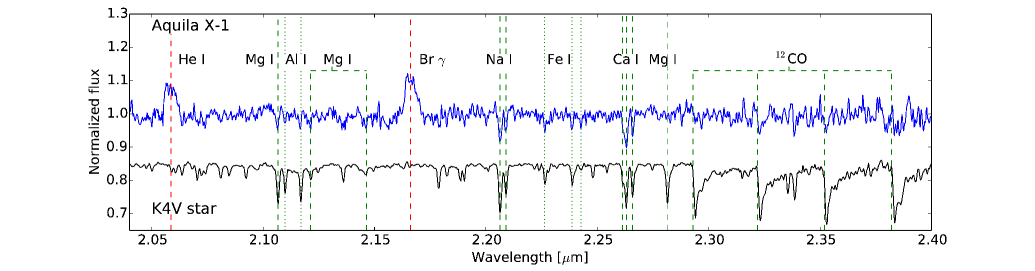
The averaged spectrum of Aql X-1 (Fig. 1) shows both emission lines from the accretion disc and absorption features from the donor star. The individual spectra are noisier, but have enough quality [signal-to-noise ratio () ] to perform a radial velocity study.
3.1 Radial velocity curve of the donor star
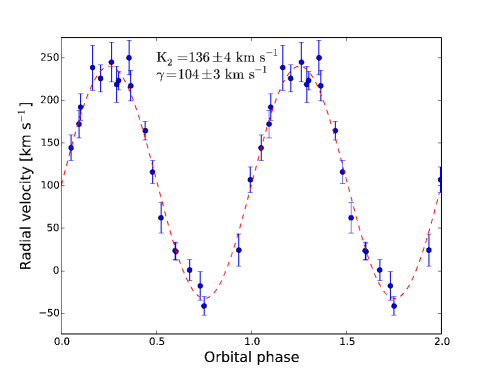
Our SINFONI spectral templates have a SNR too low to be used in a radial velocity study. Instead, we compared our object spectra with F to M main-sequence stars templates from the IRTF Spectral Library (Rayner, Cushing & Vacca 2009, Cushing, Rayner & Vacca 2005) after degrading our data to their lower resolution (). We use the molly xcor routine to perform the cross-correlation, obtaining the radial velocity shift of each individual spectrum. To carry out this task we considered a spectral region free of both emission lines and residuals from the telluric correction, where prominent absorption features such as Na i doublet () and Ca i triplet () are present (Fig. 2). For each spectrum we computed the binary phase using the most accurate orbital elements available in the literature i.e. (Garcia et al., 1999) and (Chevalier & Ilovaisky, 1998). We note that the phase uncertainty, projected onto our last data point, amounts to . The resultant radial velocity curve (Fig. 3) reveals a clear orbital modulation caused by the motion of the donor star (see Sec. 4). A sinusoidal fit to the data of the form:
| (1) |
where is the observed velocity, is the systemic velocity, the phase offset and the donor star orbital velocity, yields: ; and (). This is obtained from the cross-correlation with the template, but we note that G to M templates return values consistent within . Our data allows us to define a new from the epoch with the maximum number of observations (). Using this new value we refine the orbital period to .
3.2 Spectral classification and veiling
Fig. 2 shows that both the donor star and the accretion flow contribute to the nIR emission of Aql X-1 . Therefore, the actual spectrum of the companion is veiled by a factor , defined as the fractional contribution of non-stellar sources to the total flux (e.g. the accretion disc contribution). In order to constrain and the spectral type of the companion we produced, for each template, a grid of spectra sampling the range , and compared them with the averaged spectrum of Aql X-1 in the donor star rest frame using a minimization routine. The minimum of the distribution constrains the donor star spectral type to be and the K-band veiling to . The same analysis reveals a spectral type for the interloper.
3.3 Diagnostic diagram: The radial velocity curve of the NS
In order to constrain the radial velocity of the neutron star we analysed the evolution of the most prominent emission line present in the spectra, namely Br (). We constructed a diagnostic diagram (Shafter et al., 1986) where we fit the emission line in each spectrum to a double Gaussian model with a fixed separation (). Large values trace the movement of the wings of the line, which are expected to be formed in the inner parts of the accretion disc. For each value we apply a sinusoidal fit (similar to eq. 1) to the obtained velocities. By averaging the results for separations in the range , where we found that the fit was acceptable (including visual inspection) and stable, we infer: . We carried out the same analysis using the fainter He i () line and obtained consistent results.
The systemic velocity derived from this technique is consistent within with the derived from the donor star radial velocity curve. Likewise, the zero phase suggests that the wings of the lines are formed in the surrounding disc around the NS, tracing its movement. Therefore, we propose as a good estimate of the radial velocity of the neutron star. We note that both and derived from the diagnostic diagram are consistent with previous determinations using optical emission lines by Garcia et al. (1999, ,, H) and Cornelisse et al. (2007, , , H).
3.4 Astrometry of Aql X-1 and light curves
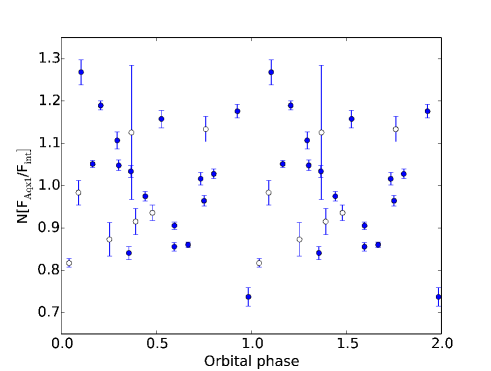
The high angular resolution achieved by SINFONI allowed us to single out Aql X-1 from a nearby field star. Aiming at refining the object coordinates, we collapsed each individual cube along the spectral dimension and fitted a bidimensional Gaussian to the resultant "photometric" images. We derived a centroid position relative to the interloper of ; , which is consistent within with that obtained from ultraviolet observations (Hynes & Robinson, 2012), yielding a separation of . The collapsed images can also be used to perform differential photometry against the interloper star, which is expected to remain constant during the observations. The obtained light curve from aperture photometry (see Fig. 4) shows variability at () level (), but there is no clear orbital modulation (see Sec. 4).
3.5 Rotational broadening
In an attempt to measure the rotational broadening of the companion star in Aql X-1 we compared the breadth of the absorption features – using the averaged spectrum in the companion star rest frame – with template stars observed with the same instrumental configuration. These cover spectral types K0IV, K3V, K7V and M0V and were co-added in order to produce a single "K-type" template with sufficient SNR for this analysis. We then artificially broadened this grand-sum template spectrum using a linear limb-darkening coefficient of 0.33 (Al-Naimiy, 1978), and compared it with the Aql X-1 spectrum using optsub molly routine to determine the best fit. Unfortunately, we were not able to resolve the minimum of the distribution. This is not surprising given that our spectral resolution is and we expect (using our and values; see Wade & Horne 1988) a rotational broadening of .
4 Discussion
We have determined the orbital velocities of the system components in Aql X-1 as well as the donor star spectral type. We can use these results to constrain other fundamental parameters of the system such as the inclination, the NS mass and the distance.
4.1 The distance to Aql X-1
K-band photometry was carried out using the data cubes after collapsing in the spectral dimension. These were compared with standard stars observed each night. The mean values for the interloper star and Aql X-1 are and , respectively, where the uncertainty refers to one standard deviation. The observed hydrogen equivalent column density (Campana et al., 2014) and the relation (Watson, 2011) yields . We apply the extinction relation provided by Cardelli et al. (1989) to derive the extinction in the K-band: . If we consider the veiling factor from Sec. 2, the apparent magnitude of the donor star of Aql X-1 is .
Cox (2000) provides absolute visual magnitudes and stellar parameters of dwarf and giant stars. Conversion to the K-band can be achieved through the bolometric correction tables from Masana et al. (2006). On the other hand, a dwarf star is not large enough to fill the Roche Lobe of a 19h orbital period system, and therefore no accretion would be expected. The frequent outbursts observed in Aql X-1 require the donor star to be an evolved star which has expanded to the Roche Lobe radius (Eggleton, 1983). Taking this into account, we predict an absolute magnitude for the donor of Aql X-1 of , which results in a distance of . Our result is consistent with that derived from thermonuclear X-ray burst analysis (, Galloway et al. 2008). If we consider the interloper star to be a and the extinction to be lower than that of Aql X-1, it places this object at , in agreement with previous determinations (Chevalier et al., 1999).
The radial velocity curve of the Galaxy reported in Clemens (1985) and refined by Nakanishi & Sofue (2003) implies that the expected radial velocity of an object at the position of Aql X-1 would be ( for the interloper star). From our spectra we found a systemic velocity for the interloper of , which is fully consistent with the expected value. In the case of Aql X-1 we measure . This implies a natal kick in the radial direction of , in agreement with findings in others neutron star binaries (e.g. Cen X-4, González Hernández et al. 2005).
4.2 Masses and inclination of Aql X-1
Our radial velocity curve, presented in Sec. 3, provides the first dynamical detection of the donor star in Aql X-1, revealing a projected velocity of . Previous attempts to measure the donor star orbital velocity in the optical regime were hampered by the presence of the interloper star. The so-called Bowen technique, which studies narrow emission lines (particularly the Bowen blend) arising from the inner, irradiated face of the companion star during the outburst, proposed (Cornelisse et al., 2007). Neither the obtained velocity amplitude (see e.g. Muñoz-Darias et al. 2005) nor the orbital phases are compatible with the solution presented here. Although the Bowen technique has proven to be valid in several systems (e.g. Steeghs & Casares 2002), a contaminating contribution to the Bowen blend by structures arising in other parts of the binary different from the irradiated face of the companion (e.g. hot-spot) has been observed in some cases (e.g. Ser X-1, Hynes et al. 2004). This issue (as noted by the authors in Cornelisse et al. 2007) together with a limited orbital coverage probably concealed the donor star emission features in their spectra. A full optical spectroscopic study of Aquila X-1 in outburst will be presented in a forthcoming work (Jiménez-Ibarra et al. in prep.).
The results derived in Sec. 3 (, and ) produce a mass ratio , as well as a mass function:
| (2) |
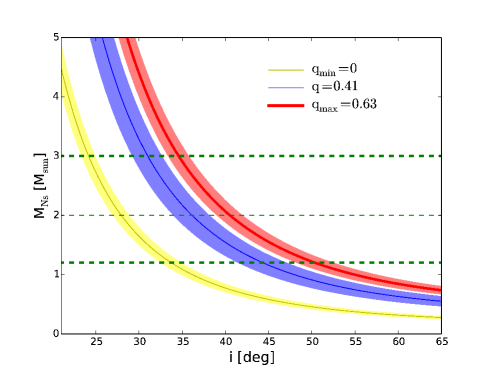
which does not significantly restrict the mass of the NS due to both the uncertainty in and the unknown value of the orbital inclination (). The detection of both thermonuclear burst and pulsed emission indicates a NS acretor in Aql X-1, and thus its mass should be higher than (Kiziltan et al., 2013). Similarly, the companion star has been classified as an evolved star; assuming that binary evolution does not significantly increase its mass (see Kolb, King & Baraffe 2001) then (Cox, 2000), which all together yields an upper limit to the mass ratio of . Using our and , and considering a conservative constraint of , the inclination parameter is restricted to (see Fig. 5). By including the proposed and the upper limit imposed by the most massive NS found so far (, PSR J0348+0432; Antoniadis et al. 2013), we obtain . On the other hand, photometric observations (Welsh et al., 2000) constrain the orbital inclination to , which is fully consistent with our results. A canonical NS () would require . Galloway et al. (2016) have very recently reported on the presence of intermittent X-ray dips on Aql X-1, which seem to be only present in 10% of the orbital cycles. Our less constraining (i.e. more solid) upper limit ( for ) rules out a high orbital inclination as the origin of these events.
Casares (2015) found a linear correlation between and the FWHM of the Hα line. The more general solution presented in the aforementioned paper,
| (3) |
assumes that the FWHM of the emission line is determined by the gas velocity at a characteristic disc radius , where is the distance from the compact object to the Lagrangian point . This empirical correlation implies that the Hα line is typically formed (in quiescence) at about . Following the same procedure but using Brγ instead of Hα together with our and values suggest that this line is formed at more external radii (), which is an expected feature supporting our results.
Finally, we note that the quiescent nIR emission of Aql X-1 shows significant long-term variability at 20% level, but no apparent orbital modulation (Fig. 4). The latter could be due to both the relatively low inclination that we have derived and the presence of accretion related variability during the quiescent state (our observations were spanned over different epochs across more than a year). Spurious variability owing to a variable contribution from the interloper star is not expected since it only typically accounts for less than 5 per cent of the object flux (seeing ; see Fig. 4). On the other hand, X-ray variability during the quiescence has been observed in Aql X-1 (Cackett et al., 2011), and optical variability is a common property of both quiescent black hole and NS transients (e.g. Zurita et al. 2003).
5 Conclusions
We used near infrared integral field spectroscopy to single out Aquila X-1 from a nearby interloper star. The spectra reveal, for the first time, absorption features corresponding to a donor, veiled by in the K-band, and moving at a projected orbital velocity of . We further refine the ephemerides of the system to and , and constrain the orbital inclination to . Using the de-reddened K-band magnitude and the constraints on the spectral type we infer a distance to the source of .
Acknowledgements
DMS acknowledges Fundación La Caixa for the financial support received in the form of a PhD contract. We also acknowledge support by the Spanish Ministerio de Economía y competitividad (MINECO) under grant AYA2013-42627. JC is supported from the Leverhulme Trust through the Visiting Professorship Grant VP2-2015-046. Based on observations made with ESO telescopes at the La Silla Paranal Observatory under program ID 085.D-0271. MOLLY software developed by T. R. Marsh is gratefully acknowledged.
References
- Al-Naimiy (1978) Al-Naimiy H. M., 1978, Ap&SS, 53, 181
- Antoniadis et al. (2013) Antoniadis J., et al., 2013, Science, 340, 448
- Cackett et al. (2011) Cackett E. M., Fridriksson J. K., Homan J., Miller J. M., Wijnands R., 2011, MNRAS, 414, 3006
- Campana et al. (2014) Campana S., Brivio F., Degenaar N., Mereghetti S., Wijnands R., D’Avanzo P., Israel G. L., Stella L., 2014, MNRAS, 441, 1984
- Cardelli et al. (1989) Cardelli J. A., Clayton G. C., Mathis J. S., 1989, ApJ, 345, 245
- Casares (2015) Casares J., 2015, ApJ, 808, 80
- Casella et al. (2008) Casella P., Altamirano D., Patruno A., Wijnands R., van der Klis M., 2008, ApJ, 674, L41
- Chevalier & Ilovaisky (1998) Chevalier C., Ilovaisky S. A., 1998, IAU Circ., 6806
- Chevalier et al. (1999) Chevalier C., Ilovaisky S. A., Leisy P., Patat F., 1999, A&A, 347, L51
- Clemens (1985) Clemens D. P., 1985, ApJ, 295, 422
- Cornelisse et al. (2007) Cornelisse R., Casares J., Steeghs D., Barnes A. D., Charles P. A., Hynes R. I., O’Brien K., 2007, MNRAS, 375, 1463
- Cox (2000) Cox A. N., 2000, Allen’s astrophysical quantities
- Cushing et al. (2005) Cushing M. C., Rayner J. T., Vacca W. D., 2005, ApJ, 623, 1115
- Eggleton (1983) Eggleton P. P., 1983, ApJ, 268, 368
- Galloway et al. (2008) Galloway D. K., Muno M. P., Hartman J. M., Psaltis D., Chakrabarty D., 2008, ApJS, 179, 360
- Galloway et al. (2016) Galloway D. K., Ajamyan A. N., Upjohn J., Stuart M., 2016, preprint, (arXiv:1607.00074)
- Garcia et al. (1999) Garcia M. R., Callanan P. J., McCarthy J., Eriksen K., Hjellming R. M., 1999, ApJ, 518, 422
- González Hernández et al. (2005) González Hernández J. I., Rebolo R., Peñarrubia J., Casares J., Israelian G., 2005, A&A, 435, 1185
- Hynes & Robinson (2012) Hynes R. I., Robinson E. L., 2012, ApJ, 749, 3
- Hynes et al. (2004) Hynes R. I., Charles P. A., van Zyl L., Barnes A., Steeghs D., O’Brien K., Casares J., 2004, MNRAS, 348, 100
- Kiziltan et al. (2013) Kiziltan B., Kottas A., De Yoreo M., Thorsett S. E., 2013, ApJ, 778, 66
- Kolb et al. (2001) Kolb U., King A. R., Baraffe I., 2001, MNRAS, 321, 544
- Kunte et al. (1973) Kunte P. K., Durgaprasad N., Gokhale G. S., Iyengar V. S., Manchanda R. K., Sreekantan B. V., 1973, Nature Physical Science, 245, 37
- Masana et al. (2006) Masana E., Jordi C., Ribas I., 2006, A&A, 450, 735
- Mata Sánchez et al. (2015) Mata Sánchez D., Muñoz-Darias T., Casares J., Steeghs D., Ramos Almeida C., Acosta Pulido J. A., 2015, MNRAS, 449, L1
- Muñoz-Darias et al. (2005) Muñoz-Darias T., Casares J., Martínez-Pais I. G., 2005, ApJ, 635, 502
- Muñoz-Darias et al. (2014) Muñoz-Darias T., Fender R. P., Motta S. E., Belloni T. M., 2014, MNRAS, 443, 3270
- Nakanishi & Sofue (2003) Nakanishi H., Sofue Y., 2003, PASJ, 55, 191
- Rayner et al. (2009) Rayner J. T., Cushing M. C., Vacca W. D., 2009, ApJS, 185, 289
- Rousselot et al. (2000) Rousselot P., Lidman C., Cuby J.-G., Moreels G., Monnet G., 2000, A&A, 354, 1134
- Shafter et al. (1986) Shafter A. W., Szkody P., Thorstensen J. R., 1986, ApJ, 308, 765
- Steeghs & Casares (2002) Steeghs D., Casares J., 2002, ApJ, 568, 273
- Wade & Horne (1988) Wade R. A., Horne K., 1988, ApJ, 324, 411
- Watson (2011) Watson D., 2011, A&A, 533, A16
- Welsh et al. (2000) Welsh W. F., Robinson E. L., Young P., 2000, AJ, 120, 943
- Zurita et al. (2003) Zurita C., Casares J., Shahbaz T., 2003, ApJ, 582, 369