Ancient eruptions of Carinae: A tale written in proper motions
Abstract
We analyze eight epochs of Hubble Space Telescope H+[N ii] imaging of Carinae’s outer ejecta. Proper motions of nearly 800 knots reveal that the detected ejecta are divided into three apparent age groups, dating to around 1250 A.D., to around 1550 A.D., and to during or shortly before the Great Eruption of the 1840s. Ejecta from these groups reside in different locations and provide a firm constraint that Car experienced multiple major eruptions prior to the 19th century. The 1250 and 1550 events did not share the same axisymmetry as the Homunculus; the 1250 event was particularly asymmetric, even one-sided. In addition, the ejecta in the S ridge, which have been associated with the Great Eruption, appear to predate the ejection of the Homunculus by several decades. We detect essentially ballistic expansion across multiple epochs. We find no evidence for large-scale deceleration of the observed knots that could power the soft X-ray shell by plowing into surrounding material, suggesting that the observed X-rays arise instead from fast, rarefied ejecta from the 1840s overtaking the older dense knots. Early deceleration and subsequent coasting cannot explain the origin of the older outer ejecta—significant episodic mass loss prior to the 19th century is required. The timescale and geometry of the past eruptions provide important constraints for any theoretical physical mechanisms driving Car’s behavior. Non-repeating mechanisms such as the merger of a close binary in a triple system would require additional complexities to explain the observations.
keywords:
circumstellar matter – stars: individual: Carinae – stars: mass-loss1 Introduction
One of the most remarkable stars in our galaxy, Carinae has been puzzling astronomers for over 150 years. In the mid-nineteenth century, it became increasingly variable, then peaked temporarily as the second brightest star in the sky (Innes, 1903; Davidson & Humphreys, 1997; Frew, 2004; Smith & Frew, 2011) before slowly fading over more than a decade. During this Great Eruption, Car ejected an estimated 10–15 M☉ into the well-known bipolar Homunculus nebula (Smith et al., 2003). A second, Lesser Eruption followed in 1890 (Innes, 1903; Humphreys et al., 1999; Frew, 2004), but only ejected M☉ (Ishibashi et al., 2003; Smith, 2005).
Car belongs to a class of stars known as luminous blue variables (LBVs, Humphreys & Davidson, 1994), very massive, unstable, post-main-sequence stars characterized by luminous mass-loss events. Even among LBVs, Car is unusual and its parameters are extreme. In its current quiescent state, Car is substantially more luminous than most other known LBVs (e.g., van Genderen, 2001; Smith & Tombleson, 2015). It is one of only two Galactic LBVs that has been observed in a giant eruption. The other is P Cygni, whose largest eruption involved significantly less energy and mass loss, similar to Car’s Lesser Eruption (Smith & Hartigan, 2006). Moreover, Car has a massive binary companion in an eccentric 5.5-year orbit (Damineli, 1996; Damineli et al., 1997; Damineli et al., 2000; Corcoran et al., 2001; Whitelock et al., 2004), and is located in the rich cluster Trumpler 16, home to dozens of O-type stars (Smith, 2006a). In contrast, most LBVs are relatively isolated and lack O-type neighbors (Smith & Tombleson, 2015).
The mechanism of Car’s Great Eruption—which released roughly ergs of kinetic energy (Smith et al., 2003; Smith, 2008)—remains a mystery. Many theories treat it as part of single-star evolution, invoking super-Eddington radiation-driven winds (Davidson, 1971; Maeder, 1983; de Jager, 1984; Lamers & Fitzpatrick, 1988; Stothers & Chin, 1993; Glatzel & Kiriakidis, 1993; Glatzel, 1994; Humphreys & Davidson, 1994; Shaviv, 2000; Owocki et al., 2004). However, the source of the increased bolometric luminosity in these scenarios is unclear. Alternatively, the eccentric orbit of Car’s companion has been taken to imply that the Great Eruption was influenced by periastron interactions between the two binary components. Based on nineteenth-century observers’ estimates of the primary star’s color and brightness, its radius must have been much larger than at present, large enough that its companion would significantly interact or even physically collide (Iben, 1999; Smith, 2011). A speculative idea is that the collision mixed fresh nuclear fuel to greater depths, causing a sudden burst of increased nuclear burning (Smith, 2011). It has also been proposed that periastron tidal interactions spun up the primary to unstable rates, leading to a burst of mass loss (Cassinelli, 1999), or that the Great Eruption was fueled by accretion from the primary onto its companion (Soker, 2007; Kashi & Soker, 2010). Still other theories postulate a hierarchical triple system, in which the close inner pair either merged (Gallagher, 1989; Iben, 1999; Morris & Podsiadlowski, 2009; Podsiadlowski, 2010; Portegies Zwart & van den Heuvel, 2016) or underwent a dynamical exchange with the outer companion (Livio & Pringle, 1998).
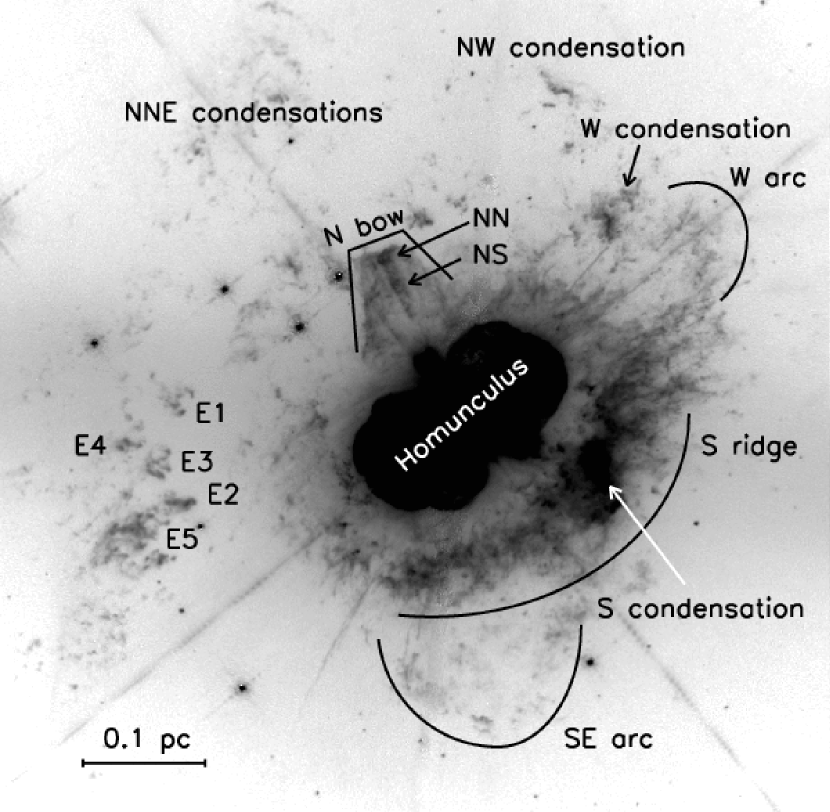
Models of the driving cause of the Great Eruption must also incorporate the outer ejecta, a collection of irregular condensations found out to nearly half a parsec outside the Homunculus (Thackeray, 1950; Walborn, 1976; Meaburn et al., 1996; Smith & Morse, 2004; Weis, 2012). These outer ejecta (Figure 1) are highly nitrogen-rich, suggesting a substantial degree of CNO processing (Davidson et al., 1986; Smith & Morse, 2004). They contain a minimum mass of 2–4 M☉ (Weis, 2012), with dust observations suggesting a much larger total mass (Gomez et al., 2010). The various models for the Great Eruption produce different explanations for the outer ejecta. The merger model of Portegies Zwart & van den Heuvel (2016), for instance, predicts that the outer ejecta were formed after the formation of the Homunculus.
The proper motions of the outer ejecta provide concrete constraints on Car’s mass-loss history. The bright S condensation and the “jet”-shaped N bow (see Figure 1) have motions consistent with having been ejected during the Great Eruption (Walborn et al., 1978; Ebbets et al., 1993; Currie et al., 1996; Morse et al., 2001). Some results have suggested, however, that the extended S ridge is up to one hundred years older (Walborn et al., 1978; Morse et al., 2001). The age of the E condensations is even less clear: Walborn et al. (1978) found transverse velocities of 300–400 km s-1, indicating ejection dates in the mid-1400s, but Walborn & Blanco (1988) determined ten years later that the same features had slowed dramatically, suggesting they were from the Great Eruption after all. While the motions of the outer condensations have hinted at prior mass-loss events, a single ejection date around the time of the Great Eruption could not be ruled out.
In this paper, we measure the proper motions of Car’s outer ejecta to unprecedented accuracy, using 16 different baselines over 21 years of Hubble Space Telescope (HST) data. The depth and resolution of the HST images allow us to re-evaluate the origins of the N, E, and S features, and, for the first time, measure motions of the fainter NNE, NW, and SE condensations. We find no evidence of widespread deceleration, and show that while some of the outer ejecta come from the Great Eruption (or the lead-up to it), many features require at least one prior mass-loss event centuries earlier. Our data, image registration, and approach to measuring proper motions are described in Section 2; the results are presented in Section 3. We discuss the implications of our results on models of Car in Section 4 and conclude with a summary in Section 5.
2 Observations and Analysis
2.1 HST ACS
| Instrument | Camera | Date | Filter | Exp. Time (s) | Program ID |
|---|---|---|---|---|---|
| WFPC2 | WF3 | 1993 Dec 31 | F658N | 2 200 | 5188 |
| WFPC2 | WF3 | 1997 Jul 11 | F658N | 2 200 | 7253 |
| WFPC2 | WF3 | 1999 Jun 12 | F658N | 2 200 | 8178 |
| WFPC2 | WF3 | 2001 Jun 4 | F658N | 2 200 | 9226 |
| WFPC2 | WF3 | 2003 Aug 8 | F658N | 2 100 | 9775 |
| WFPC2 | WF3 | 2008 Sept 6 | F658N | 2 100 | 11500 |
| ACS | WFC | 2005 Jul 18 | F658Na | 2 500 | 10241 |
| ACS | WFC | 2014 Aug 4 | F658Na | 2 520 | 13390 |
| aNote that the bandpass of the ACS 658N filter is different from that of the WFPC2 filter of the same name (see discussion in Section 2.2). |
We obtained new H+[N ii] images of Car and the surrounding Tr 16 cluster on 2014 Aug 4, using the Wide Field Channel (WFC) of the Advanced Camera for Surveys (ACS) on HST (program ID 13390; see Table 1). These observations were designed to replicate our observations of 2005 Jul 18 (Smith et al., 2010) as closely as possible, in pointing and position angle, in order to minimize position-dependent uncertainties when measuring proper motions. The Homunculus and central star are heavily saturated in these exposures, which were each 500–520 s long. In both epochs, observations were made as a series of arcsec2 “footprints,” each consisting of three pairs of CR-SPLIT dithers in a linear offset pattern designed to fill in the ACS chip gaps. Car and its outer ejecta were observed in a single footprint; the rest make up a mosiac of Tr 16 and neighboring Tr 14 (see Smith et al., 2010). All data were processed by the standard HST ACS pipeline, which does bias subtraction and flat-fielding and corrects for charge transfer efficiency (CTE) to produce an image with the designation “flc.” The pipeline also produces a “drc” image that has been additionally corrected for geometric distortion and dither-combined via AstroDrizzle.
We transformed both epochs of ACS data to a common distortion-free reference frame via a modified version of the method used in Anderson et al. (2008a, b), Anderson & van der Marel (2010), and Sohn et al. (2012, see also ). An initial reference frame, aligned with the axis pointing north and with a pixel scale of 50 mas pixel-1, was constructed using the astrometric solutions in the headers of the drc images to match stars that appear in overlapping images. However, the resampling performed by AstroDrizzle makes the drc images unsuitable for direct high-accuracy positional measurements. Instead, we performed point spread function (PSF) fitting on the the undrizzled flc images using the program img2xym_WFC.09x10 (Anderson & King, 2006), which uses a library of spatially dependent effective PSFs. We then applied the geometric distortion corrections of Anderson (2006) to the measured stellar positions.
Next, we iteratively mapped the stellar positions from the flc images to the reference frame by:
-
1.
identifying the high signal-to-noise stars (typically several hundred per image) in common between each flc image and the reference frame;
-
2.
computing the six-dimensional linear transformation from the distortion-corrected positions of the flc images to the reference frame; and
-
3.
replacing each existing reference-frame stellar position with the average of that star’s transformed, distortion-corrected flc positions.
After three iterations, the internal accuracy of the reference frame was pixels (1 mas, or 1.2 km s-1 over this 9-year baseline at the distance of Car) across a single footprint.
Using the final linear transformations determined by this process, we resampled the flc images from each epoch into the reference frame using the algorithm described in Anderson et al. (2008a), scaling each image to a total exposure time of 500 s. The end result was a single stacked image at each epoch for each observed footprint. With both epochs of data on the same reference frame, the positions of ejecta features in the stacked images could be directly compared. Figure 2 presents difference images (stacked image from 2014 minus stacked image from 2005) for named regions of interest in Car’s outer ejecta. In these images, material has moved from the dark patches into the corresponding bright areas. It is immediately qualitatively apparent that some features have greater transverse velocities than others; the N bow, for instance, is rapidly overtaking the small feature to its immediate northwest. Notably, there are no pronounced changes in condensation morphology or brightness from 2005 to 2014.
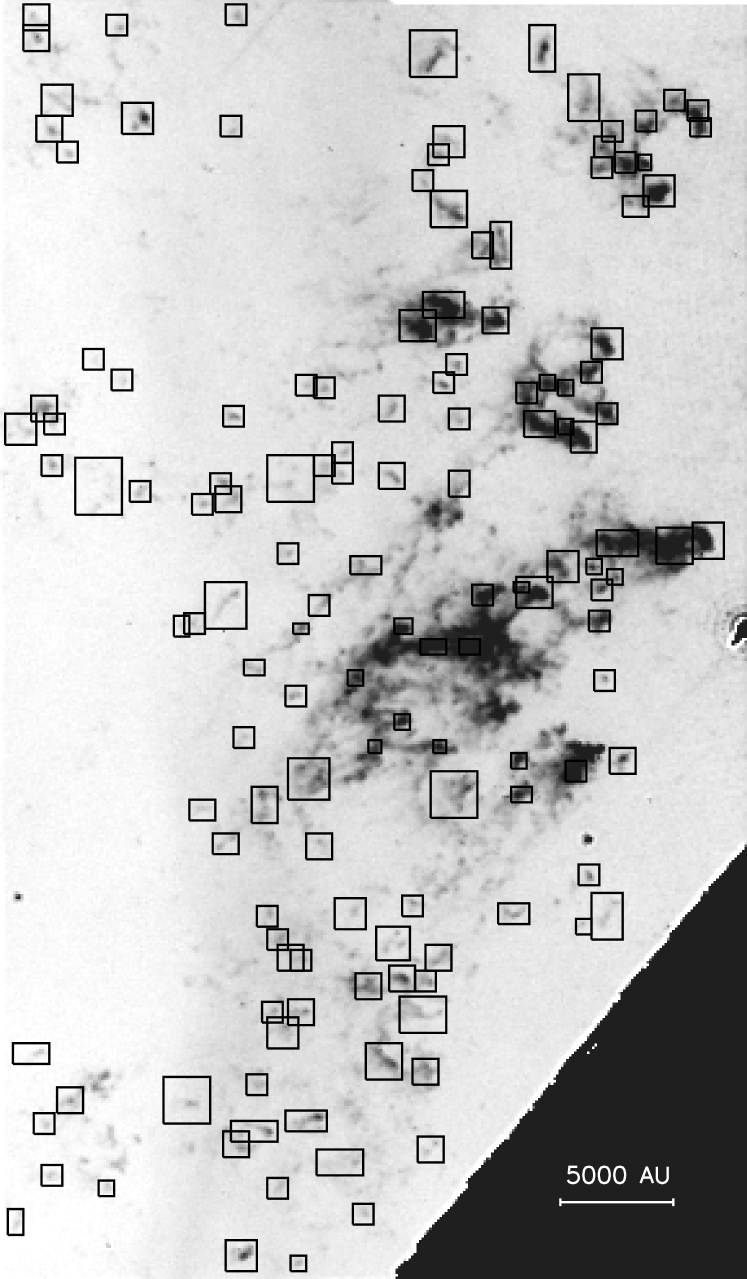
The proper motions of well-defined knots in the ejecta around Car were measured in the stacked images. “Well-defined” features are those that are (1) not contaminated by or confused with the saturated Homunculus or diffraction spikes in either epoch and (2) sufficiently isolated for a defined knot or feature to be identified. A total of 620 such features were identified in the ACS images. To measure the proper motion of each, we subtracted a median-filtered image (filtered using a kernal size of 12 pixels) in order to suppress the local diffuse H background. We then extracted the knot using a box size optimized for that feature; Figure 3 illustrates the boxes used for the features in and around the E condensations. We used our implementation of the modified cross-correlation technique developed by Currie et al. (1996), Hartigan et al. (2001), and Morse et al. (2001, see also ) to determine the difference in position between the two epochs. In brief, the box containing the feature of interest was compared to the second image and an array was generated containing the total of the square of the difference between two images for each shift. The minimum of this array corresponds to the shift that best matches the two images. Angular displacements were converted to km s-1 assuming a distance of 2.3 kpc (Smith, 2006b). To estimate the uncertainty on the offset, we repeated the procedure using a variety of box sizes. The median proper motion uncertainty for features measured in the ACS images is 2.7 km s-1.
| Baseline | Instrument | t | # Features | Median |
|---|---|---|---|---|
| (years) | (km s-1) | |||
| 1993–1997 | WFPC2 | 3.524068 | 694 | 8.5 |
| 1993–1999 | WFPC2 | 5.443602 | 704 | 7.0 |
| 1993–2001 | WFPC2 | 7.422813 | 712 | 5.4 |
| 1993–2003 | WFPC2 | 9.599420 | 714 | 4.8 |
| 1993–2008 | WFPC2 | 14.680967 | 698 | 3.9 |
| 1997–1999 | WFPC2 | 1.919534 | 703 | 14.3 |
| 1997–2001 | WFPC2 | 3.898745 | 742 | 7.7 |
| 1997–2003 | WFPC2 | 6.075352 | 713 | 6.3 |
| 1997–2008 | WFPC2 | 11.156898 | 686 | 4.6 |
| 1999–2001 | WFPC2 | 1.979211 | 716 | 12.1 |
| 1999–2003 | WFPC2 | 4.155818 | 684 | 8.0 |
| 1999–2008 | WFPC2 | 9.237365 | 679 | 4.6 |
| 2001–2003 | WFPC2 | 2.176607 | 633 | 13.0 |
| 2001–2008 | WFPC2 | 7.258153 | 666 | 5.5 |
| 2003–2008 | WFPC2 | 5.081546 | 648 | 7.6 |
| 2005–2014 | ACS | 9.046256 | 620 | 2.7 |
2.2 HST WFPC2
To supplement our proper motion measurements from the 2005–2014 ACS baseline, we searched the HST archive for additional deep images of Car taken with an F658N filter. Six epochs of observations from the Wide-Field Planetary Camera 2 (WFPC2) met our requirements: the images had to be deep enough for the outer ejecta to be visible, and Car had to be centered on one of the Wide Field chips (the field of view of the Planetary Camera chip is too small). The dates and program IDs for these data are given in Table 1. We retrieved the longest exposures available at each epoch: a pair of 200-s exposures from each of 1993, 1997, 1999, and 2001, and a pair of 100-s exposures from each of 2003 and 2008. Car itself and much of the Homunculus are saturated in these images, although the bleeding is much less extensive than in the ACS images, which have both longer exposure times and a wider filter bandpass (see below). All of the data had been reprocessed by the final version of the HST WFPC2 pipeline, which produces images designated “c0m” that have been bias-subtracted, dark-corrected, and flat-fielded.
Note that there are important differences between the WFPC2 F658N filter and the ACS filter of the same name. The former covers a narrow wavelength range (FWHM 38 Å) roughly centered on [N ii], capturing emission from that line with Doppler shifts from approximately -615 to +1130 km s-1. The latter is broader (FWHM 72 Å), capturing [N ii] emission with radial velocities up to 1600 km s-1 as well as significant H emission. Although most of the same ejecta features seen in the ACS images are identifiable in the WFPC2 images, there is no way to guarantee that the knot shapes are unaffected by the differences in filter bandpass. Consequently, we do not measure proper motions directly between WFPC2 and ACS images. We use only WFPC2–WFPC2 and ACS–ACS baselines. In addition, the fastest known ejecta are Doppler-shifted out of one or both filters and are not detected. The WFPC2 F658N filter would not, for instance, pick up the -875 km s-1 blueshifted emission just outside the southeast lobe of the Homunculus (Currie et al., 2002), even if the Homunculus were not saturated in our images. Both filters miss the -3200 km s-1 blueshifted ejecta detected further out by Smith (2008). Our images thus exclude the fastest-moving material from the Great Eruption and therefore do not exclude the possibility of additional recent mass-loss episodes. We note, however, that since few of the ejecta seen in the ACS images drop out in the WFPC2 images (and those that do are relatively faint and not detected in the shortest exposures), few to none of the dense knots measured in our images have radial velocities of 1000–1500 km s-1.
We took the same approach to aligning and stacking the WFPC2 data as we did with the ACS images. We used a modified version of the img2xym program (Anderson & King, 2006) to measure stellar positions in the c0m images, employing a library of spatially dependent effective WFPC2 PSFs from Anderson & King (2000). The measured positions were then corrected for the 34th-row anomaly (Anderson & King, 1999) and for geometric distortion (Anderson & King, 2000). We identified 6–10 isolated, low-proper-motion stars in common between each WFPC2 image and the ACS-based reference frame, and used those stars to derive a six-parameter linear transformation between each distortion-corrected WFPC2 frame and the reference frame. Unlike with the ACS data, we did not iterate on the process: we took the ACS-based reference frame as final. The internal accuracy of the alignment and stacking procedure is reference-frame pixels (3 mas) for the first four epochs. The shorter, lower signal-to-noise 2003 and 2008 exposures had greater positional uncertainties of up to 0.2 reference frame pixels (10 mas).
Using the calculated transformations, the WFPC2 c0m images were resampled and stacked into a single image at each epoch, aligned with the ACS-based reference frame. The c0m images, which have a plate scale of 99.6 mas pixel-1, were oversampled during stacking so that the output image matched the 50-mas pixels of the ACS images. An example of the results is shown in the right panel of Figure 2, which shows difference images for the major named regions of Car’s outer ejecta for the 1993–2001 baseline. Although the resolution is somewhat lower compared to the ACS images, much detail is still apparent. Animated GIFs of each region, made from all eight epochs of aligned data, are available in the online supplementary material.
The proper motions of the features identified in the ACS images were measured in the WFPC2 images, using the modified cross-correlation technique described in Section 2.1, for every possible baseline among the six epochs (a total of 15 baselines). Some features were contaminated by diffraction spikes or saturation bleeds in some epochs; proper motions for these features were measured using only the epochs in which they were not contaminated. The baselines, number of features measured, and median proper motion uncertainties for each baseline are given in Table 2. The median proper motion uncertainties range from 3.9 to 14.3 km s-1, and the magnitude of the uncertainty is highly negatively correlated with the length of the baseline (i.e., shorter baselines produce greater uncertainties). In the areas blocked by saturation bleeding in the ACS images, we used the 1993–2001 baseline (the longest baseline with 200-s exposures) to identify additional features which were then measured across the other WFPC2 baselines where possible. A small number of features in a gap that was saturated in 2001 are identified in the 1993–2003 baseline instead, then measured across other baselines where possible. In total, we measure the proper motions of 792 individual features in the ejecta of Car. Each feature is measured in 1–16 baselines (including the 2005–2014 ACS baseline); on average, a feature is measured in 14 baselines.
2.3 Position of the central source
Owing to the heavy saturation of the Homunculus, we were unable to measure the position of Car itself in any of our stacked images. Instead, we measure the centroid of the central star in an F631N WFPC2 Planetary Camera image from Morse et al. (1998). The centroid positions of five surrounding stars in this image were used to derive a linear transformation to our reference frame. We estimate that this transformation is accurate to reference-frame pixels. Added in quadrature with the 0.5-pixel uncertainties in absolute knot positions, this means that the overall uncertainty in a knot’s distance from Car is 0.55 pixels (27 mas, or 60 A.U. at the distance of Car). For a knot moving at 300 km s-1, this translates to an uncertainty in its age of 0.9 years.
3 Results
3.1 HST proper motions over two decades

Figure 4 presents our results in aggregate: a histogram of the weighted mean proper motions of all measured features, along with proper motion histograms for the ejecta in each of the regions highlighted in Figure 2. The transverse velocities of Car’s outer ejecta range from 219 km s-1 to 1462 km s-1, with a broad peak at 300–600 km s-1 and a secondary peak at 750–900 km s-1. The highest proper motions are found in the N bow, the S ridge, and the parts of the W arc that overlap with the upper S ridge. The presence and location of speeds upward of 1000 km s-1 agrees with past observations of the S ridge and N bow (Walborn et al., 1978; Walborn & Blanco, 1988; Ebbets et al., 1993; Morse et al., 2001). The mix of speeds seen in the lower S ridge is also consistent with the results of Morse et al. (2001).
Our results for the E condensations (no high-proper-motion features; mean proper motion km s-1) agree solidly with the results of Walborn et al. (1978), who used photographic plate images from 1950 to 1975. However, the observed motion in our HST images disagrees strongly with the deceleration hypothesis of Walborn & Blanco (1988), who added data from 1985 and found that the E condensations had dramatically slowed over 10 years. The Walborn & Blanco (1988) deceleration hypothesis predicts that the E features would have reached zero velocity by the end of the twentieth century, a hypothesis that our data definitively exclude.
With a total of 16 different baselines from two instruments, we can approach the question of acceleration/deceleration with unprecedented detail. Figure 5 plots the measured proper motions over time for three features representative of the E condensations and of the ejecta overall. The weighted mean transverse velocity of each feature is overplotted, along with a least-squares fit to the data. Although there is some variation among the proper motions, there are no overall trends with time. In a test, the measured motions for all three features shown in Figure 5 are consistent with having been drawn from a distribution with constant transverse velocity.

This level of variance and (lack of) acceleration is found across all our data. Out of the 792 features for which proper motions were measured, only 50 (6%) have data that are inconsistent at the level with being drawn from a constant velocity distribution. These 50 features occupy no special region of physical space or velocity space. The slopes of the least-squares fits to velocity versus time for these 50 features also fall inside the range of slopes found for the rest of the ejecta. If material were being significantly accelerated (from being hit by younger, faster material) or decelerated (from running into older material), we would expect to see some kind of spatial correlation of those changes in velocity, yet we do not. Thus, while we cannot rule out small amounts of acceleration or deceleration for individual features, the outer ejecta appear to be, on the whole, expanding ballistically. We therefore treat all velocities as constant unless otherwise noted, and use the weighted mean as the final proper motion for each feature.
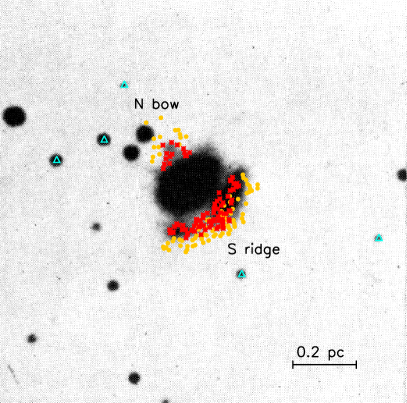
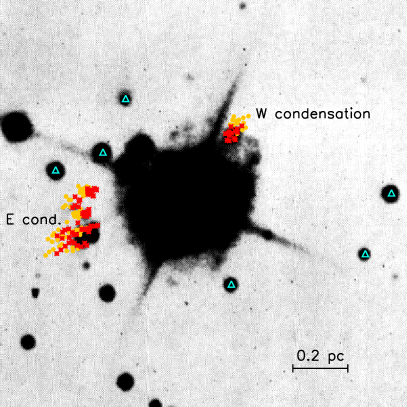
As a last check on whether the assumption of constant velocities is appropriate, we extrapolate our observed positions of the outer ejecta back to 1950 and compare them to the ground-based photographic plate images of Thackeray (1950). We aligned the Thackeray (1950) images to a copy of our stacked ACS image that had been convolved with a broad PSF to approximately match the resolution of the older images. Figure 6 shows the predicted 1950 positions, with the observed 2005 positions overplotted for comparison. There is good agreement between our predicted positions and the observed features in 1950. Although one must be conscious of the limitations of photographic plate data, these data are consistent with ballistic motion of Car’s ejecta over the past 60 years. From the motion that we measure, however, we cannot rule out significant acceleration or deceleration that may have occurred earlier than 60 years ago.
3.2 Ages of the outer ejecta
Under the assumption that the constant velocities observed over the last 60 years apply over the lifetime of the ejecta, estimating ejection dates is trivial. Earlier episodes of acceleration or deceleration would affect the specific ejection dates deduced, but, as we discuss in Section 4.3, are unlikely to affect the overall relationships between groups of ejecta. Ejection date results are summarized in Figure 7: the magnitude and direction of each knot’s proper motion are indicated by the length and orientation of its arrow, and the arrows are color-coded by apparent ejection date. Red arrows mark the most recently ejected material, i.e., material that was ejected around the time of the Great Eruption, while blue and purple arrows indicate the oldest material. It can be seen in Figure 7 that all 792 measured features are moving nearly directly away from the central star.
There are several distinct groups of ejecta in Figure 7:
-
1.
The N bow, S condensation, and S ridge (which extends nearly completely around the Homunculus) all date back to the early 1800s, consistent with prior results (Walborn et al., 1978; Ebbets et al., 1993; Morse et al., 2001). As we discuss below, the age of the S ridge suggests an origin during one of the precursor outbursts to the Great Eruption (seen as spikes in the historical light curve; Smith & Frew, 2011), before the ejection of the Homunculus.
-
2.
The E blobs and many of the NNE condensations date back to an ejection event in the thirteenth century. This event was apparently highly asymmetric: there are no ejecta with this age to the south or west. (Note, however, that our HST ACS footprint for this reference frame cuts off in the far southwest. We address this issue further in Section 3.3.)
-
3.
The SE arc, the W and NW condensations, and part of the W arc appear to date to an intermediate eruption in the sixteenth century. In the SE and W arcs, this material is being overtaken by faster-moving material from the Great Eruption. The lower S ridge is a mix of material of different ages, explaining why Morse et al. (2001) dated this region to half a century before the Great Eruption.
One might surmise that the apparently intermediate ages of material in the SE and W arcs could result from the interaction between material from the 1200s and material from the 1800s. However, there are no newer ejecta around the NW condensation or the faint ejecta to the far north. As we discuss in Section 4.1, radial velocities also suggest that these ejecta are not connected to the thirteenth-century eruption. They also lie outside the soft X-ray shell, which traces strong current interactions between ejecta (see Section 4.2)
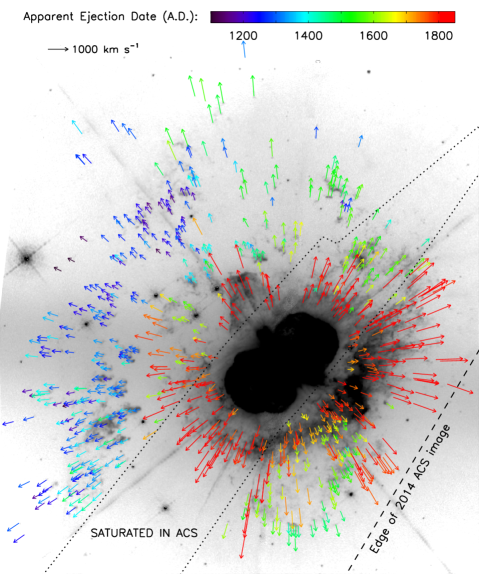
Figure 8 presents these data in an alternative form, plotting the transverse velocity of ejecta features versus their projected distance from Car. Again, there is evidence for at least two eruptions, one in the early 1800s and another circa 1250 A.D. An intermediate eruption, circa 1550 A.D., is suggested but less obvious. As mentioned above, the sixteenth-century ages could in principle be the result of interaction between ejecta from the Great Eruption and the 1200s event. However, the intermediate-aged features appear in a fairly clear line in velocity–distance space (i.e., as a Hubble-like law) rather than being smeared between the points from the two other events.

An additional feature of interest in Figure 8 is that nearly all of the nineteenth-century features appear to have been ejected decades before 1843. Proper motions of the Homunculus date it to the mid-1840s (Currie et al., 1996; Smith & Gehrz, 1998; Morse et al., 2001); this is when the light curve of Car reached its peak (Smith & Frew, 2011). There are two possibilities for why the S ridge and its extended wings appear older: (1) its material experienced a period of deceleration as it interacted with circumstellar material early in its history before continuing to expand ballistically; or (2) it was ejected prior to the formation of the Homunculus. The second option is supported by the photometric record: the Great Eruption was preceded by a brightening in 1838 and a similar but poorly observed event in 1827 (see Smith & Frew, 2011, who found that these events align with the predicted periastron times of Car’s binary orbit). The data before 1827 are very sparse (or nonexistent) and leave open the possibility of additional prior periastron outbursts. The S ridge may have been ejected during one or more of these events rather than during the main peak of the Great Eruption. Its strong asymmetry may therefore be related to stellar collisions at periastron (Smith, 2011) associated with these early brightenings. The alternative explanation (an early deceleration episode) is plausible for the material at the edges of the bright S condensation, which appears in Figure 8 around 16–20″ and 500–700 km s-1. We could be seeing the result of interaction between the S condensation (ejected during the Great Eruption) and the slightly older S ridge material.
Finally, Figure 9 presents histograms of the apparent ejection dates, both overall and for each of the regions in Figures 2 and 4. The differences in age between the various groups of features are clearly evident. The E and NNE condensations, for instance, are much older than the upper S ridge and S condensations. The mix of ages in the W arc and the lower S ridge is also apparent. As in Figure 8, the overall histogram of ejection dates shows two obvious distinct events, in the thirteenth and nineteenth centuries, as well as a smaller peak of features ejected in the late 1500s.
Overall, our proper motions of Car’s outer ejecta solidly confirm that there was at least one major mass-loss event prior to the Great Eruption, barring a strong deceleration event occurring sometime before 1950 (see Section 4.3). Assuming constant velocities, there is an approximately 600-year interval between the two most distinct eruptions. If the third eruption is included, then these major mass-loss events have occurred every 300 years.

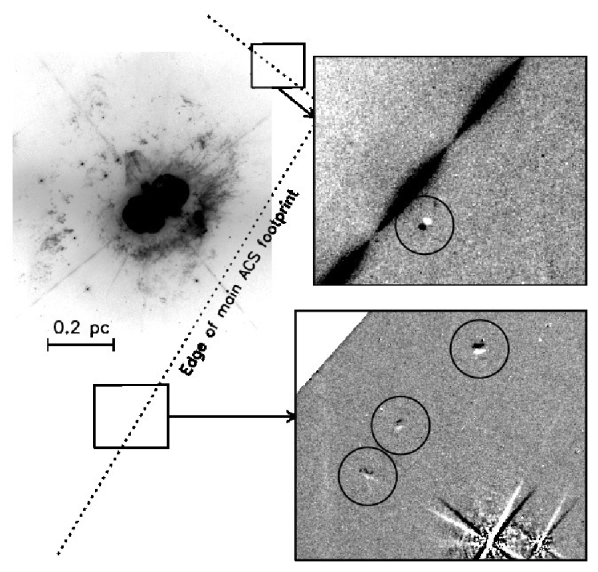
3.3 Asymmetry and the most distant ejecta
As mentioned above and as shown in Figure 7, the reference frame in which we identified and measured ejecta cuts off closer to Car on the southwest than on any other side, complicating our assessment of asymmetry. We searched the adjacent ACS footprints (which together make up a mosaic of the Tr 16 cluster; see Smith et al., 2010) for other possible ejecta. As shown in Figure 10, we found only four small features moving away from Car, three to the south and one to the northwest. We were able to measure the proper motions of three of those features, although a relative zero-point uncertainty of several km s-1 exists between footprints because of their minimal overlap. For the same reason, there is also a several-pixel (100s mas) uncertainty in distance from the central source.
The knot to the northwest has a transverse velocity of km s-1, giving it an estimated ejection date of 1045 15 A.D., assuming ballistic motion. The two knots that we were able to measure to the far south are traveling at 460–480 km s-1 and date to 900 30 A.D. The four outer knots could thus come from a smaller, older mass-loss event or events. Given the systemic uncertainties described above, however, we cannot rule out an association with the thirteenth-century event.
Notably, there are no large-scale older ejecta similar to the E condensations on the west side of Car. It would appear that the eruption in the 1200s was highly asymmetric, perhaps even one-sided, sending substantial mass to the east and northeast but little to no mass in other directions. The Great Eruption, despite producing the bipolar Homunculus, was also significantly asymmetric, ejecting more mass into the extended S ridge than into the distinctly shaped N bow. The sixteenth-century ejecta show some possible bipolarity, but are not aligned with the axis of the Homunculus.
4 Discussion
4.1 Comparison to radial velocities
To fill out the third dimension of the outer ejecta’s motion, we turn to radial velocity studies in the literature. Weis et al. (2001) measured radial velocities of 90 distinct features in the outer ejecta, finding speeds from 100 km s-1 (in the SE arc) to 1960 km s-1 (in the upper part of the S ridge). The E condensations, the N bow, most of the NNE condensations, and the unnamed material on the east side of the Homunculus—including all of the ejecta that date back to the 1200s—are blueshifted. In contrast, the S ridge, S condensation, SE arc, W arc, W condensation, NW condensation, and some of the material to the far north are redshifted. The Homunculus itself is also aligned in this fashion, with a blueshifted southeast lobe and redshifted northwest lobe, tilted out of the plane of the sky by 48 (e.g., Davidson et al., 2001; Smith, 2006b).
The ejecta from the thirteenth-century eruption are traveling toward us at an angle of 20–40 out of the plane of the sky, depending on whether we use the radial velocities of Meaburn et al. (1987) and Smith & Morse (2004) or those of Weis et al. (2001, who present only the highest-magnitude velocities for each feature). The ejecta that appear to date from the 1500s, however, are traveling away from us, tilted up to 30 from the plane of the sky. The dividing line between the two proper motion groups on the north side of Car closely follows the dividing line between blue- and redshifted material seen by Weis et al. (2001). With the intermediate-aged material in a completely different part of three-dimensional space than the oldest ejecta, it becomes much more likely that the intermediate-aged features are from a distinct eruption rather than the result of past acceleration/deceleration from ejecta interactions.
4.2 Relationship to X-ray emission and the extremely fast ejecta
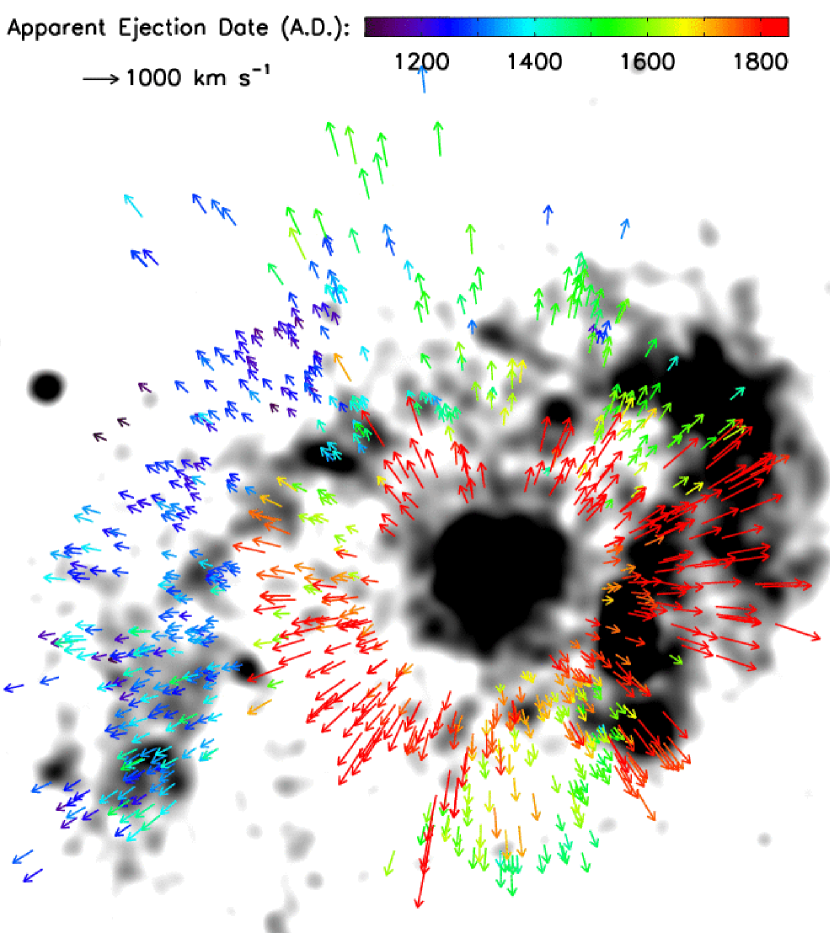
Car is encircled by an elongated partial ring or shell of soft X-ray emission that extends from just south of the S condensation, over the W arc, and around to the E condensations (Chlebowski et al., 1984; Seward et al., 2001). Figure 11 shows a Chandra X-ray Observatory image of Car and its surroundings (Seward et al., 2001), with the proper motion velocity vectors for the optical ejecta plotted on top. The X-ray shell has roughly the same axis orientation as the Homunculus, but has a notable gap to the south and southeast.
The spatial association between the soft X-ray shell and the optical features in the outer ejecta has led to a broad consensus that the X-ray emission is the result of shock heating from ejecta interactions (Chlebowski et al., 1984; Corcoran et al., 1998; Seward et al., 2001; Weis et al., 2001; Smith & Morse, 2004). The strongest soft X-ray emission is coincident with the S condensation, upper S ridge, and W arc, where we have measured a mix of ages for the dense optical ejecta. Extremely fast ejecta, with radial speeds of up to km s-1, have been detected close to the E condensations and coincident with the X-ray shell (Smith & Morse, 2004; Smith, 2008). As described in Section 2.2, this very fast material, originating from the Great Eruption in the nineteenth century, is Doppler-shifted out of the narrowband filters used here and is not detected in our images. It is presumably interacting with or approaching the denser, slower blobs measured in this paper. Additional spectral mapping of the outer ejecta is needed to explore the full distribution of the high-velocity material and its relationship to the soft X-ray emission.
Given the limits on the deceleration that we measured for the knots in the E condensations, we can roughly estimate their relative density compared to the very fast ejecta. Over 21 years of HST observations, the features in the E condensations change velocity by an average of -0.1 1.2 km s-1 yr-1 (consistent with zero). Assuming that the collision between ejecta is fully inelastic and that momentum is conserved, the observed E condensations are thus 10–104 times denser than the impacting very fast ejecta, depending on the timescale over which the fast ejecta decelerate.
Returning to Figure 11, note that there is no spatial correlation between the sixteenth-century ejecta and the soft X-ray emission. The SE arc falls in the X-ray gap, and the northern ejecta lie outside the X-ray shell altogether. If the intermediate ages of these ejecta were the result of interaction between the thirteenth- and nineteenth-century ejecta, we would expect to see strong X-ray emission from the location of these interactions. We would also expect there to be apparently sixteenth-century ejecta around the E blobs, where very fast ejecta are observed to be hitting the thirteenth-century material. We observe neither of these things, further strengthening the case that there was a distinct eruption in the 1500s.
4.3 Alternate ejection histories
In our analysis, we have found approximate ejection dates by assuming that there was no substantial, large-scale deceleration (or acceleration) of the outer ejecta prior to their first detection in 1950. Car is surrounded by a “cocoon” of less-nitrogen-rich material, likely from pre-eruption mass loss (Smith & Morse, 2004). Here, we explore the hypothesis that all of the observed outer ejecta were decelerated early in their history as they encountered this material, then tapered to their current coasting velocities as the density of the cocoon diminished with radius. In this case, the ejection dates of all the knots move later and closer together. The true timescale between eruptions could then be closer to 100–200 years instead of 300 years. However, our main result, the detection of multiple major mass-loss events in Car’s history, is unaffected. That is the most straightforward scenario to explain our observations.
The most extreme alternate ejection history—that all of the observed outer ejecta date to the Great Eruption of the 1840s, but suffered different amounts of deceleration with an asymmetric wind—is much less likely. It requires a complex pre-existing configuration of mass to decelerate the observed outer ejecta such that they reach their current coasting velocities at their current distances from Car. A spherically symmetric distribution of pre-eruption circumstellar material (e.g., a stellar wind with a density profile) could not have produced the different coasting velocities seen at the same radii from the star. Compare, for example, the NNE and NW condensations: although both are 25″ from Car, the average proper motion of the NNE knots is 380 km s-1 while the NW knots are moving at 550 km s-1.
The E condensations provide a particularly firm constraint, as they are already 19–23″ from the central star in the Thackeray (1950) images. To reach that distance by 1950 with an origin in the 1840s would require a minimum initial projected speed of 2000 km s-1. The measured projected speeds of the E condensations over the past two decades are 350–600 km s-1. If these features were ejected in the 1840s, there is no way for them to have reached the observed separation from Car and yet have their current, relatively low speeds without invoking a dense shell located close to their 1950 positions. One could then posit additional pre-existing partial shells that would have decelerated the NW and SE condensations to their present-day coasting velocities. This scenario would still require substantial and episodic prior mass-loss events. It would have much the same consequences for Car’s eruptive history, except it would indicate that the star’s surface nitrogen enhancement took place recently, between the older shell-producing events and the 1840s Great Eruption.
From an energy standpoint, we know the Great Eruption did produce ejecta with velocities of 1000 km s-1 or more; they are seen in spectra of the equatorial plane of the Homunculus and of near or inside the soft X-ray shell (Smith, 2008). However, as discussed in Section 4.2, some of these very fast ejecta are coincident with and appear to be running into the E condensations, likely powering the observed soft X-ray shell. There is no clear mechanism by which two sets of mass should reach the same projected distance over the same time yet have present-day speeds that differ by a factor of ten. Furthermore, the ejection of all of the dense outer ejecta at 1000 km s-1 or more would require a dramatic upward revision of the estimated energy budget of the Great Eruption. The discovery of the very fast ejecta roughly doubled the Great Eruption’s energy budget (Smith, 2008), and that number assumed that the 3000 km s-1 material was about a factor of ten less dense than the slower, named ejecta. (Note that this agrees with our rough estimate of the density ratio in Section 4.2.) The explosive amount of kinetic energy required to eject several solar masses of outer ejecta at these speeds approaches that of a core-collapse supernova.
4.4 Implications for models of Eta Car
The proper motions of the outer ejecta thus confirm that Car has undergone at least two and probably three major mass-loss events over the last millennium, including the nineteenth-century Great Eruption. These results raise a number of interesting questions that are as yet unanswered by existing theories: What mechanism drives these repeating eruptions? Why do they repeat on a several-hundred-year timescale, much longer than the 5.5-year binary orbit? Why was the thirteenth-century eruption so one-sided? Why does the Homunculus have a clear bipolar symmetry that past eruptions lack? Models of Car’s behavior must not treat the Great Eruption in isolation, but should aim to account for all of the observed characteristics of the prior eruptions.
In single-star models (i.e., those in which the companion star plays no significant role), Car’s eruptions are considered to be continuum-driven super-Eddington wind events, where the extra luminosity arises from as-yet-unidentified mechanisms (Davidson & Humphreys, 1997; Owocki et al., 2004). However, it is difficult for a single-star model to explain the observed asymmetry in the outer ejecta and the changes in mass-loss symmetry with time. What could cause a single star to produce the highly one-sided mass loss of the thirteenth-century eruption, then eject the axisymmetric Homunculus several centuries later?
Current models involving a binary or higher-order multiple system may get us closer, but also have difficulty explaining the observed historical mass loss. The time between major eruptive events is much longer than the orbital period of the current binary (5.54 years, Damineli, 1996). If the eruptions are influenced by periastron interactions (Cassinelli, 1999; Soker, 2007; Kashi & Soker, 2010; Smith, 2011), these interactions must be suppressed for long periods of time. Models that invoke a one-time catastrophic event such as a merger (Gallagher, 1989; Iben, 1999; Morris & Podsiadlowski, 2009; Podsiadlowski, 2010; Portegies Zwart & van den Heuvel, 2016) or a dynamical exchange (Livio & Pringle, 1998) require additional unexplained complexities to account for these repetitive yet discrete events separated by centuries.
The lack of older, more distant outer ejecta rules out additional major mass-loss events prior to the thirteenth century. Bohigas et al. (2000) claimed to detect a much older (104 yr) bipolar shell, but this was interpreted by Smith et al. (2005) as Car’s astropause, modified by the wind of a nearby Of star, as it lacks the nitrogen-rich chemistry or clumpy structure of the other outer ejecta. What, then, caused Car’s eruptive behavior to start in the 1200s? The apparently sudden initiation of mass ejections is probably an important clue, and is another key constraint for models.
An added complication in the story of Car is the 1890s Lesser Eruption, in which a much smaller amount of mass (0.1 M☉; Ishibashi et al., 2003; Smith, 2005) was ejected with the same geometry as the Homunculus. Secondary eruptions of this sort, occurring several decades after a major outburst, have been observed in P Cygni and some of the other known eruptive LBVs (Humphreys et al., 1999). Our data are not sensitive to similar small eruptions in the decades after the larger thirteenth- and sixteenth-century events.
5 Conclusions
We have aligned eight epochs of HST imaging (both WFPC2 and ACS) of Car’s outer ejecta to the same distortion-corrected reference frame and measured the proper motions of 792 ejecta features, many for the first time. We achieve unprecedented time coverage, with each feature measured in up to 16 baselines over 21 years, as well as unprecedented velocity precision (few km s-1) and spatial resolution for these features.
All 792 features measured in Car’s outer ejecta have transverse velocities pointing nearly directly away from the star. The majority have proper motions of 300–600 km s-1, although some are as fast as 1500 km s-1. The fastest-moving material is found in the large feature known as the S ridge and in the broadly jet-shaped N bow. Both date back to Car’s Great Eruption in the 1840s or to a few decades prior.
Over the 21 years of data, we see no evidence for large-scale acceleration or deceleration of any of the outer ejecta: 94% of the knots are consistent with moving at constant velocity over that time. Comparison to images from 1949–1950 support ballistic motion over a longer time period. Under the assumption of constant velocity, we find that the material in and around the E and NNE condensations was ejected in the mid-1200s A.D., give or take 50–100 years. With the exception of three small knots to the far south of Car and one to the northwest, the ejecta dating to the mid-1200s are all found to one side of the central star and are blueshifted.
We also see evidence of a third, intermediate eruption that occurred in the sixteenth century. Ejecta dating to the mid-1500s are found in the SE arc, the W condensation, and in and around the NW condensation. From proper motions alone, we cannot rule out that this intermediate date peak is the result of newer ejecta from the Great Eruption hitting the older material from the 1200s. However, the radial velocities of these features place them in a different part of three-dimensional space from the thirteenth-century ejecta. The lack of X-ray emission over the SE arc and the features to the far north also indicates a lack of strong interaction between ejecta at those spots.
In summary, we have shown with distance-independent measurements that Car erupted at least once, likely twice, before its Great Eruption in the 1800s. Models for this still-enigmatic star must therefore explain the recurrence of these major mass-loss events, along with their several-hundred-year timescale and their various asymmetries.
Acknowledgements
The authors would like to thank Jay Anderson for providing us with his suite of PSF-fitting and image alignment software, and for his valuable instruction, guidance, and technical support. We also thank the anonymous referee for constructive comments that improved the paper. Support for this work was provided by NASA grant GO-13390 from the Space Telescope Science Institute, which is operated by the Association of Universities for Research in Astronomy, Inc. under NASA contract NAS 5-26555. This work is based on observations made with the NASA/ESA Hubble Space Telescope, obtained from the Data Archive at the Space Telescope Science Institute.
References
- Anderson (2006) Anderson J., 2006, in Koekemoer A. M., Goudfrooij P., Dressel L. L., eds, The 2005 HST Calibration Workshop: Hubble After the Transition to Two-Gyro Mode. p. 11
- Anderson & King (1999) Anderson J., King I. R., 1999, PASP, 111, 1095
- Anderson & King (2000) Anderson J., King I. R., 2000, PASP, 112, 1360
- Anderson & King (2006) Anderson J., King I. R., 2006, Technical report, PSFs, Photometry, and Astronomy for the ACS/WFC. Space Telescope Science Institute
- Anderson & van der Marel (2010) Anderson J., van der Marel R. P., 2010, ApJ, 710, 1032
- Anderson et al. (2008a) Anderson J., et al., 2008a, AJ, 135, 2055
- Anderson et al. (2008b) Anderson J., et al., 2008b, AJ, 135, 2114
- Bohigas et al. (2000) Bohigas J., Tapia M., Ruiz M. T., Roth M., 2000, MNRAS, 312, 295
- Cassinelli (1999) Cassinelli J. P., 1999, in Morse J. A., Humphreys R. M., Damineli A., eds, Astronomical Society of the Pacific Conference Series Vol. 179, Eta Carinae at The Millennium. p. 358
- Chlebowski et al. (1984) Chlebowski T., Seward F. D., Swank J., Szymkowiak A., 1984, ApJ, 281, 665
- Corcoran et al. (1998) Corcoran M. F., et al., 1998, ApJ, 494, 381
- Corcoran et al. (2001) Corcoran M. F., Ishibashi K., Swank J. H., Petre R., 2001, ApJ, 547, 1034
- Currie et al. (1996) Currie D. G., et al., 1996, AJ, 112, 1115
- Currie et al. (2002) Currie D. G., Dorland B. N., Kaufer A., 2002, A&A, 389, L65
- Damineli (1996) Damineli A., 1996, ApJ, 460, L49
- Damineli et al. (1997) Damineli A., Conti P. S., Lopes D. F., 1997, New Astron., 2, 107
- Damineli et al. (2000) Damineli A., Kaufer A., Wolf B., Stahl O., Lopes D. F., de Araújo F. X., 2000, ApJ, 528, L101
- Davidson (1971) Davidson K., 1971, MNRAS, 154, 415
- Davidson & Humphreys (1997) Davidson K., Humphreys R. M., 1997, ARA&A, 35, 1
- Davidson et al. (1986) Davidson K., Dufour R. J., Walborn N. R., Gull T. R., 1986, ApJ, 305, 867
- Davidson et al. (2001) Davidson K., Smith N., Gull T. R., Ishibashi K., Hillier D. J., 2001, AJ, 121, 1569
- Ebbets et al. (1993) Ebbets D., Malumuth E., Davidson K., White R., Walborn N., 1993, in Cassinelli J. P., Churchwell E. B., eds, Astronomical Society of the Pacific Conference Series Vol. 35, Massive Stars: Their Lives in the Interstellar Medium. p. 263
- Frew (2004) Frew D. J., 2004, Journal of Astronomical Data, 10, 6
- Gallagher (1989) Gallagher J. S., 1989, in Davidson K., Moffat A. F. J., Lamers H. J. G. L. M., eds, Astrophysics and Space Science Library Vol. 157, IAU Colloq. 113: Physics of Luminous Blue Variables. pp 185–192
- Glatzel (1994) Glatzel W., 1994, MNRAS, 271
- Glatzel & Kiriakidis (1993) Glatzel W., Kiriakidis M., 1993, MNRAS, 263, 375
- Gomez et al. (2010) Gomez H. L., Vlahakis C., Stretch C. M., Dunne L., Eales S. A., Beelen A., Gomez E. L., Edmunds M. G., 2010, MNRAS, 401, L48
- Hartigan et al. (2001) Hartigan P., Morse J. A., Reipurth B., Heathcote S., Bally J., 2001, ApJ, 559, L157
- Humphreys & Davidson (1994) Humphreys R. M., Davidson K., 1994, PASP, 106, 1025
- Humphreys et al. (1999) Humphreys R. M., Davidson K., Smith N., 1999, PASP, 111, 1124
- Iben (1999) Iben Jr. I., 1999, in Morse J. A., Humphreys R. M., Damineli A., eds, Astronomical Society of the Pacific Conference Series Vol. 179, Eta Carinae at The Millennium. p. 367
- Innes (1903) Innes R. T. A., 1903, Annals of the Cape Observatory, 9, 75B
- Ishibashi et al. (2003) Ishibashi K., et al., 2003, AJ, 125, 3222
- Kashi & Soker (2010) Kashi A., Soker N., 2010, ApJ, 723, 602
- Lamers & Fitzpatrick (1988) Lamers H. J. G. L. M., Fitzpatrick E. L., 1988, ApJ, 324, 279
- Livio & Pringle (1998) Livio M., Pringle J. E., 1998, MNRAS, 295, L59
- Maeder (1983) Maeder A., 1983, A&A, 120, 113
- Meaburn et al. (1987) Meaburn J., Wolstencroft R. D., Walsh J. R., 1987, A&A, 181, 333
- Meaburn et al. (1996) Meaburn J., Boumis P., Walsh J. R., Steffen W., Holloway A. J., Williams R. J. R., Bryce M., 1996, MNRAS, 282, 1313
- Morris & Podsiadlowski (2009) Morris T., Podsiadlowski P., 2009, MNRAS, 399, 515
- Morse (1999) Morse J. A., 1999, in Morse J. A., Humphreys R. M., Damineli A., eds, Astronomical Society of the Pacific Conference Series Vol. 179, Eta Carinae at The Millennium. p. 13
- Morse et al. (1998) Morse J. A., Davidson K., Bally J., Ebbets D., Balick B., Frank A., 1998, AJ, 116, 2443
- Morse et al. (2001) Morse J. A., Kellogg J. R., Bally J., Davidson K., Balick B., Ebbets D., 2001, ApJ, 548, L207
- Owocki et al. (2004) Owocki S. P., Gayley K. G., Shaviv N. J., 2004, ApJ, 616, 525
- Podsiadlowski (2010) Podsiadlowski P., 2010, New Astron. Rev., 54, 39
- Portegies Zwart & van den Heuvel (2016) Portegies Zwart S. F., van den Heuvel E. P. J., 2016, MNRAS, 456, 3401
- Reiter & Smith (2014) Reiter M., Smith N., 2014, MNRAS, 445, 3939
- Reiter et al. (2015a) Reiter M., Smith N., Kiminki M. M., Bally J., Anderson J., 2015a, MNRAS, 448, 3429
- Reiter et al. (2015b) Reiter M., Smith N., Kiminki M. M., Bally J., 2015b, MNRAS, 450, 564
- Seward et al. (2001) Seward F. D., Butt Y. M., Karovska M., Prestwich A., Schlegel E. M., Corcoran M., 2001, ApJ, 553, 832
- Shaviv (2000) Shaviv N. J., 2000, ApJ, 532, L137
- Smith (2005) Smith N., 2005, MNRAS, 357, 1330
- Smith (2006a) Smith N., 2006a, MNRAS, 367, 763
- Smith (2006b) Smith N., 2006b, ApJ, 644, 1151
- Smith (2008) Smith N., 2008, Nature, 455, 201
- Smith (2011) Smith N., 2011, MNRAS, 415, 2020
- Smith & Frew (2011) Smith N., Frew D. J., 2011, MNRAS, 415, 2009
- Smith & Gehrz (1998) Smith N., Gehrz R. D., 1998, AJ, 116, 823
- Smith & Hartigan (2006) Smith N., Hartigan P., 2006, ApJ, 638, 1045
- Smith & Morse (2004) Smith N., Morse J. A., 2004, ApJ, 605, 854
- Smith & Tombleson (2015) Smith N., Tombleson R., 2015, MNRAS, 447, 598
- Smith et al. (2003) Smith N., Gehrz R. D., Hinz P. M., Hoffmann W. F., Hora J. L., Mamajek E. E., Meyer M. R., 2003, AJ, 125, 1458
- Smith et al. (2005) Smith N., Morse J. A., Bally J., 2005, AJ, 130, 1778
- Smith et al. (2010) Smith N., Bally J., Walborn N. R., 2010, MNRAS, 405, 1153
- Sohn et al. (2012) Sohn S. T., Anderson J., van der Marel R. P., 2012, ApJ, 753, 7
- Soker (2007) Soker N., 2007, ApJ, 661, 490
- Stothers & Chin (1993) Stothers R. B., Chin C.-W., 1993, ApJ, 408, L85
- Thackeray (1950) Thackeray A. D., 1950, MNRAS, 110, 524
- Walborn (1976) Walborn N. R., 1976, ApJ, 204, L17
- Walborn & Blanco (1988) Walborn N. R., Blanco B. M., 1988, PASP, 100, 797
- Walborn et al. (1978) Walborn N. R., Blanco B. M., Thackeray A. D., 1978, ApJ, 219, 498
- Weis (2012) Weis K., 2012, in Davidson K., Humphreys R. M., eds, Astrophysics and Space Science Library Vol. 384, Astrophysics and Space Science Library. p. 171, doi:10.1007/978-1-4614-2275-4_8
- Weis et al. (2001) Weis K., Duschl W. J., Bomans D. J., 2001, A&A, 367, 566
- Whitelock et al. (2004) Whitelock P. A., Feast M. W., Marang F., Breedt E., 2004, MNRAS, 352, 447
- de Jager (1984) de Jager C., 1984, A&A, 138, 246
- van Genderen (2001) van Genderen A. M., 2001, A&A, 366, 508