Granular solids Dynamics and mechanics of faulting Deformation, plasticity, and creep
Experimental study of shear band formation: bifurcation and localization
Abstract
We report the experimental observation of the bifurcation at the origin of localization of the deformation in a granular material submitted to uniaxial compression. We present a quantitative characterization of the heterogeneity in the strain field repartition allowing to evidence objectively the existence of a bifurcation initiating the shear bands formation process. We show that this bifurcation is supercritical and has no clear signature on the stress-strain curve. At the bifurcation, a symetry breaking occurs characterized by the emergence of a well-defined orientation corresponding to the Mohr-Coulomb angle. Yet, plasticity is still diffuse and the shear band extension is of the order of the sample width. While loading proceeds, the shear band narrows until it reaches, after the peak of the stress-strain curve, a stationary width.
pacs:
83.80.Fgpacs:
91.55.Fgpacs:
81.40.Lm1 Introduction
Numerous amorphous materials such as foams, colloidal glasses, granular materials or metallic glasses, tend to present shear banding when they are sheared, i.e. the concentration of the deformation in a subpart of the system, so that a cohabitation between an almost solid part and a fluid-like part is observed [1].
In the case of granular materials, this localization of the deformation takes the form of failure planes of a few beads diameter thickness [2, 3, 4]. Because this localization of the deformation has obvious connection with soils stability and fault formation, numerous works have been devoted to its prediction. In the context of elastoplasticity, localization is described as a bifurcation phenomenon [5, 6, 3] which corresponds to the emergence of solutions presenting discontinuities in the strain rate field. The condition yields solely a direction, without any prediction concerning the number of bands, their thickness or their position. Experimentally, setup allowing a full-field observation of the strain repartition during the loading are scarce [4, 7, 8] and there has been a long debate if shear bands emerge before, at or after the peak of the loading curve. Recent progresses in the detection methods [9, 10] have allowed to observe intermittent inhomogeneities in the strain field occuring before failure [11, 12, 13]. Those results have renewed the interest for this field of research with a particular interest for the understanding the microscale processes at the origin of the shear bands formation [14]. All those studies show that the localization process initiates well before the peak of the loading curve and cannot be identified has the sudden propagation of a failure plane from a defect. Surprisingly, a clear experimental signature of the bifurcation coining the initiation of the localization process is still missing.
As granular materials are amorphous materials, an approach to understand the physics underlying the shear localization process is to tackle the problem from the soft glassy materials point of view. Indeed, recent progresses in the understanding of the elementary mechanisms at the origin of their plastic response have been made [15] and the similarities in their behaviors allow to hope for a universal description of the plastic flow of amorphous systems. Failure and shear bands formation in this framework are supposed to originate from the elastic long-range coupling between the elementary plastic events which initiates avalanches of correlated rearrangements. Corresponding to this picture, recent numerical and theoretical works show that the failure of amorphous materials could be seen as a critical phenomenon [16, 17]. The question of the nature of this transition and of the universality class to which it belongs is one of the key question of the field. Several recent works, both experimental [18, 19] and theoretical [20] point towards a discontinuous phase transition, i.e. a first-order transition. Practically, depending on the material and on the loading conditions, the precise form and nature of the shear bands differ from one system to another [1]. It is thus not clear if the universality of the mechanism of plasticity at the elementary scale hold when the plasticity self-organizes at a larger scale into shear bands.
Here we present an experimental study of the whole process of failure in a granular sample submitted to a biaxial test, from the initial homogeneous deformation to final permanent shear bands. Using image analysis tools, we quantify the anisotropy in the spatial distribution of the strain and exhibit objective quantities to characterize shear bands formation. We demonstrate experimentally the existence of a bifurcation during the loading process corresponding to a symetry breaking and to the birth of a definite direction in the strain field. We show that this bifurcation is supercritical: no discontinuity occurs in the observed field during the loading and at the bifurcation, the strain field is still diffuse in the material. As the loading proceed, the thickness of the shear band decreases until it reaches a stationary value.
In a first part, we describe the experimental setup. In a second part we present the image analysis tools which allow us to give an objective measurement of the spatial repartion of the deformation in the sample and we apply it to the analysis of our experiments. In the last part, we discuss our results in the framework of different theories.
2 Experimental setup
The setup is a biaxial compressive test extensively described in another publication [11] and schematized in Figure 1. The material consists in dry glass beads of diameter m. It is placed between a preformed latex membrane (85 55 25 mm3) and a glass plate. A pump produces a partial vacuum inside the membrane, creating a confining pressure . The preparation of the sample ensures reproducible experiments at a volume fraction of . The prismatic sample thus obtained is placed in a testing machine which enforces the following conditions: (i) the back plate and the front glass plate forbid displacements normal to their plane and thus ensure plane strain conditions; (ii) a roller bearing at the bottom allows for a translational degree of freedom. This feature is a modification of the setup of ref. [11] which allows a breaking of symmetry when failure occurs as we will see in the following; (iii) the upper plate is displaced vertically by a stepper motor with a velocity of m/s leading to a deformation rate of s-1. A sensor fixed on the top plate measures the force exerted in the direction from which the stress on the plate is deduced. The value of the confining stress for all the experiments presented here is 30 kPa so that crushing of particles is not expected. The loading curves of three different experiments prepared in the same conditions are shown in Figure 1(c). Such curves are very similar to loading curves reported in the literature for not too dense samples. A plateau with a local maximum can be identified for each of those curves indicating a modification in the response of the material. Those changes in response are usually identified as indicator of the failure of the material: after this point the sample is supposed to be best represented as separated in blocks in relative solid translation. In our experiments those local maxima occur at a value of the deviatoric stress in the range 80 to 90 kPa, corresponding to an axial deformation of 5 to 6.5 %. From the value of stress at those points, the Mohr-Coulomb angle, , can be deduced for each experiment [21]: . Our measurements give an average of .
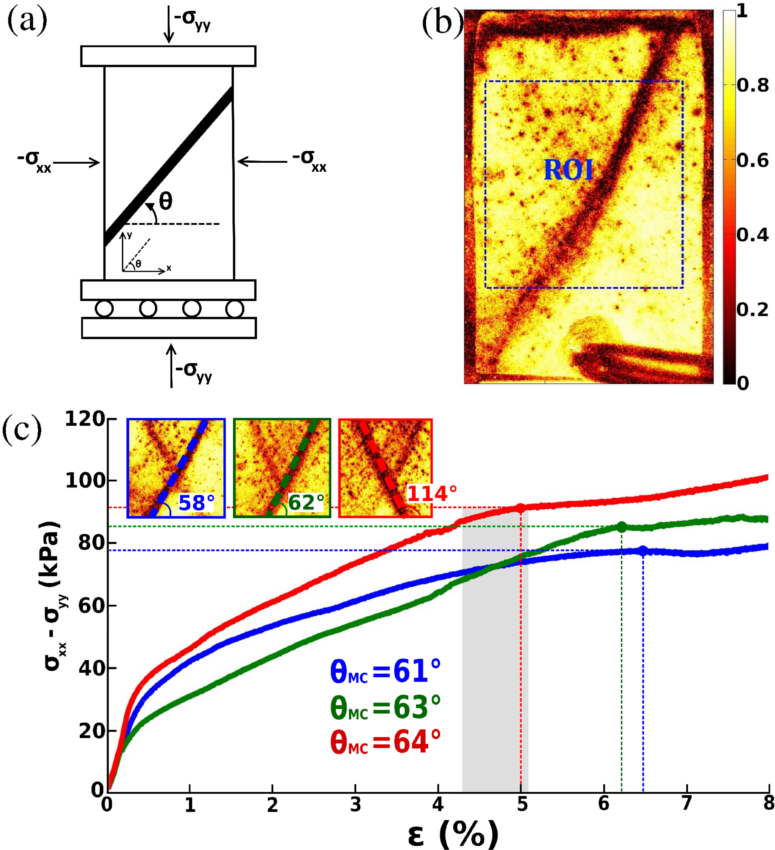
We use a full-field method based on dynamic light scattering for the quantification of the spatial repartition of the deformation. This method has been described in details in previous publications [22, 10]. A laser beam (532 nm) is expanded to illuminate the material. The light is multiply scattered inside the sample and we collect the backscattered light. The multiple light rays interfer to form a speckle pattern. The image of the front side of the sample is recorded by a 7360 4912 pixels camera. Images are subdivided in square zones of size 16 16 pixels. For each zone the correlation between two successive speckle patterns and is computed as:
| (1) |
where and are intensities of the pixels of two successive images and the averages are done over the 16 16 pixels of a zone. Each computed value gives a pixel in the final correlation map and corresponds to a volume of area in the front plane and depth of a few . An example of a map of correlation is shown in Fig. 1(b). The normalisation of the correlation function ensures that the correlation values are in the interval and the colorscale used in all the following is shown in Figure 1(b). The decorrelation of the scattered light comes from relative beads motions, i.e. combination of affine and nonaffine bead displacements and rotation of nonspherical beads. In the following, the axial deformation increment between the two images used to obtain a map is 3.2 .
3 Spatial repartition of the deformation
A movie of the successive correlation maps during the loading is in supplemental material. The general phenomelogy observed during the loading has been already described elsewhere [11, 12]. Strain repartition in the sample is inhomogeneous. Intermittent micro-bands are observed from the beginning of the loading until the final shear bands are established. This microstructure has been studied before and the orientation of the micro-bands differ from the orientation of the final shear bands[12]. The former corresponds to the orientation predicted by elasticity for stress released by local plastic rearrangements (Eshelby’s quadrupolar redistribution [23]) and does not depend of the frictional properties of the material. On the other hand distinct final shear bands are observed in all our experiments with an orientation in agreement with the Mohr-Coulomb angle deduce from the loading curves [21] as is shown in insets of Fig. 1(c).
The goal of the present letter is to study the process of formation of the final shear bands. For our purpose, we need to exhibit objective quantities from our deformation maps. To remove intermittent fluctuations, we average stacks of 50 consecutive maps to obtain a smooth strain field. We underline that no further image treatment is done on the images. In the following, we first present the image analysis tools we use to characterize the degree of localisation in the sample and the orientation of the observed large-scale structure. In a second part, we use those tools to study shear band formation.
3.1 Image analysis
To quantify the emergence of an oriented structure at a large scale and its degree of localization, we use two different tools that we call in the following anisotropy measurement for the first one and projection analysis for the second one. For those two methods we need that information encoded in the image (i.e. deformation) have the largest weight when the correlation is low. Consequently we define for each correlation map its invert image which we call activity image. The values of the pixels of those images are given by and all the subsequent analyses are done on the activity images.
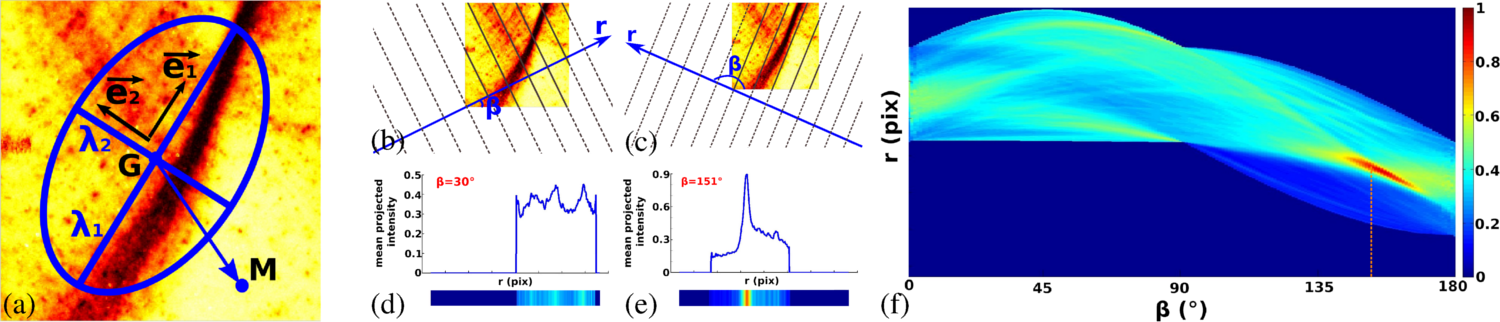
To characterize the degree of anisotropy in an image we use a method extensively described elsewhere [24]. Considering the value of each pixel of an activity image as a weight, we compute the center of mass of the image and the inertia tensor which quantify the spatial repartition of the weights around (see Fig. 2(a)):
| (2) |
This tensor has two positive eigenvalues noted . The eigenvector associated with the largest eigenvalue gives the principal direction of the anisotropy in the image and the anisotropy index gives a measurement of the degree of anisotropy between 0 (isotropic) and 1 (maximal anisotropy). A visualization of the tensor can be given by an ellipse of axis determined by the eigenvalues and eigenvectors of (see Fig. 2(a)).
The second method consists in projecting the intensity of the activity image on a line going through the origin and with an angle with the axis [25] (see Fig. 2(b) and (c)). Different values of provide different projection profiles of the same image as shown in Fig. 2(d) and (e) which are the profiles obtained for respectively Figure 2(b) and Figure 2(c). The aggregation of all the profiles obtained for all possible values of are shown in Figure 2(f). The line for which the profile present a maximum provides an orientation of the structure (orthogonal to the line) and the full width at half maximum (FWHM) of the profile provides a width of the structure. Note that this method is very close in spirit to the Hough transform [26].
3.2 Results
Figure 3(a) shows the anisotropy of the spatial distribution of the deformation as a function of the axial deformation for three different experiments (same color code as Fig. 1(c)). We observe a good reproducibility from one experiment to the other. The black curve is the mean anisotropy obtained by an average over the different experiments. At the very beginning of the loading (%), the settlement of the sample leads to spurious heterogeneous effects that leads to unrelevant large anisotropy values (see movie in supplemental material). For axial deformations between 1% and about 4.5% the anisotropy is low (about 0.1) and the spatial repartition of the strain can be considered as isotropical on average. From a value of the axial deformation of about 4.5%, the anisotropy increases steadily until it reaches a maximal value at about 6.8%. Beyond this value, depending on the experiment, the anisotropy stays for further loading roughly constant or decreases. Decreases are due to the emergence of a secondary shear band, conjugated to the initial one (see movie in supplemental material).
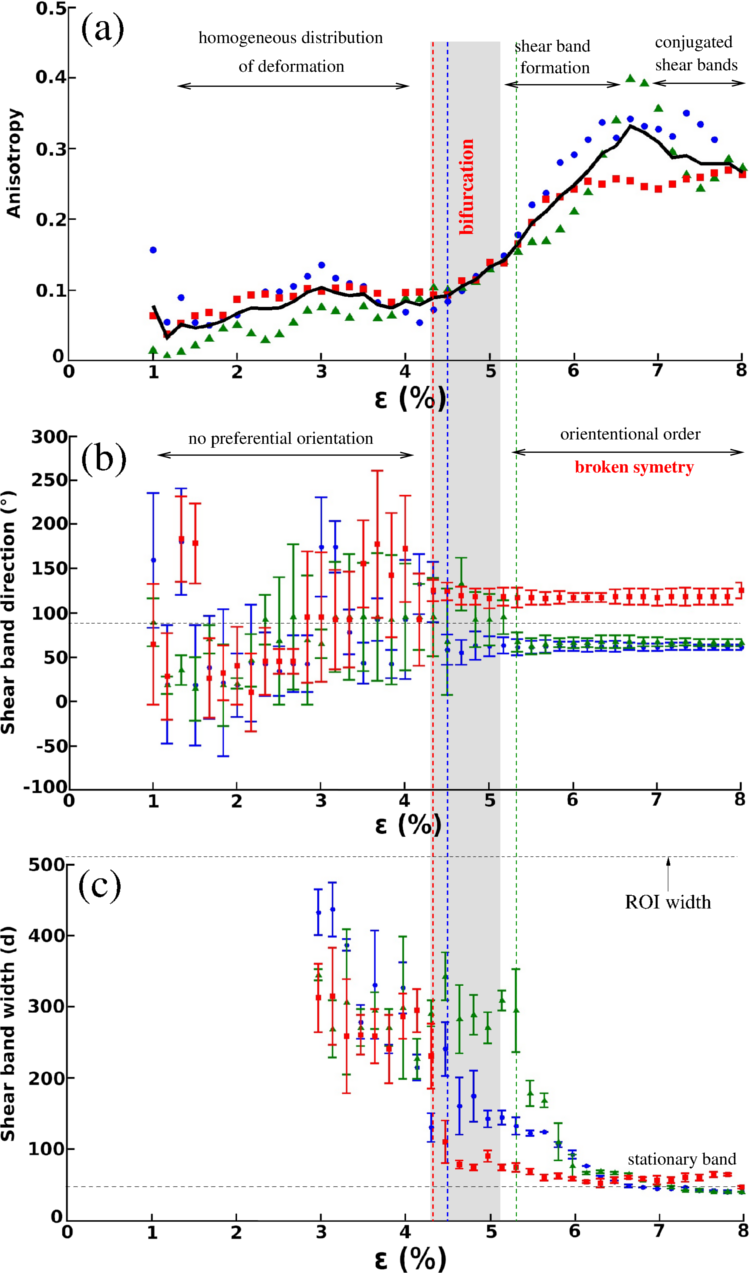
Figure 3(b) shows the principal orientation of the strain distribution (projection analysis). For an axial deformation smaller than 4.5%, the direction obtained are randomly distributed and the errors on the determination of the angles are large, indicating that no clear orientation can be defined in the images. Beyond %, each experiment displays a well-defined, constant, orientation. Depending on the experiment this direction is either about or , but the ensemble of orientations collected on all the experiments are symetrical compared to . There has been thus a symetry breaking between two possible directions. For one of the experiments (green triangles), the uncertainty on the angle stays large until %. Still, its anisotropy is increasing steadily from % showing that an orientation has emerged even if the band is less clearly defined compared to the other two experiments.
Figure 3(c) displays the evolution of the FWHM of the profile obtained along the principal orientation of the spatial distribution of the strain using the projection method. For values of the axial strain smaller than 4 %, the projected profiles are mainly flat with noise so that thickness measurements lead to noisy values of the order of size of the ROI. Thus, FWHM are clearly defined only when the orientation have been determined with small uncertainty. We have added an indication of the axial deformation for which the orientation is well-defined for each run (vertical dashed lines). We observe that for all the experiments, the width of the band is still very large (of the order of half the size of the ROI) even though the orientation is unambiguously established and that we are sure that the bifurcation has been crossed. For further loading, a decrease of the width is observed until a stationary value is reached. This stationary value is about 50 and stays roughly constant for further loading (i.e. above 8%).
4 Discussion and conclusion
The first result that emerges from Fig. 3 is that localization of deformation is indeed initiated by a bifurcation that occurs at an axial strain of about %. The observed bifurcation coins a breaking of symetry in the distribution of the strain (see Fig. 3(b)) simultaneous to an increase of the anisotropy of this strain distribution (see Fig. 3(a)). This bifurcation does not correspond to a sudden localization of the strain distribution in the form of a failure plane. On the contrary, the deformation is still largely diffuse in the sample at the bifurcation (see Fig. 3(c)). This bifurcation is thus supercritical: neither the anisotropy (Fig. 3(a)), nor the width of the band (Fig. 3(c)) present a discontinuity. This experimental observation confirms the prediction of several theories that the bifurcation corresponds to the emergence of a direction without any definition of a particular plane or a finite thickness. It is interesting to note that this supercritical feature is closely linked to the progressive organization of plasticity in the material and hence to the ductile nature of the failure.
The location of the bifurcation is reported in Fig. 1(c) as a shaded region. It can be seen that this bifurcation occurs well before the plateaus of the loading curves except for one of the experiment. It has to be noted that this particular experiment (red squares) is the one that localizes the first in Fig. 3(b) so that the bifurcation also happened before the maximum in this experiment. After the bifurcation, the finite direction that has emerged stays constant for further loading as can be seen in Fig. 3(b). Its value corresponds to the Mohr-Coulomb angle which can be deduced from the plateaus of each stress-strain curves. This result is surprising: the Mohr-Coulomb angle emerges in the material before the yield stress is reached and the internal friction manifests itself while the system cannot be represented as two blocks sliding one against the other as a rough picture of the Mohr-Coulomb model would suggest [21].
After the bifurcation, the band is progressively forming as can be characterized by the decrease of its thickness (see Fig. 3(c)). It reaches a stationary value at an axial strain of about %. The shear band thickness we measure () is significantly larger that the ones reported in the litterature [3, 7] by more direct measurements which are generally about . This is due to the high sensitivity in strain of our measurement method. Indeed, it is now well-established that the transition between the liquid-like and solid-like regions of a granular material are not well-defined [27] and that creeping flow with an exponential decay of the velocity can be detected even very far from a shear band (see e.g. [28] and references therein). In fact, recent experiments show that in presence of a shear band the whole material is flowing and no solid part can be properly defined [29, 30]. Because our method is able to detect deformation of order [11], the shear bands we observe in our correlation maps are larger than the ones obtained by more direct measurement.
Bifurcation theories that describe failure in soil mechanics [5, 3] rely on the assumption of the existence of discontinuous solutions of the strain rate field. As experimentally such discontinuities are not observed, those models are not fully satisfying to describe the behavior of the system. The need to describe the strain field during localization as a smooth inhomogeneous field calls for new models.
Nonlocal rheological models inspired by theoretical works on soft glassy materials have been proposed to describe the rheology of granular materials [31, 32]. Those models belong to continuum mechanics and introduce a new variable to describe the local state of the material, the fluidity. Spatial heterogeneities in the flow emerge because this fluidity obey to a partial differential equation (PDE) coupled to the constitutive law. This PDE describes the spatial dynamics of the fluidity by a diffusive term and introduces a lengthscale, the “cooperative length” which roughly represents the extension of the perturbation caused by a flowing zone (see reference [32] for a discussion of the differences between the models). Such models are able to describe heterogeneous dense flows in numerous configurations as well as slow flows far from the shear bands [33]. Still, they have been developed to describe steady flows, in particular they don’t consider any volume change, and it is unclear if they could describe the process of failure, which is, by nature, a transient. It could seem unlikely that a partial differential equation including a diffusive term for the ability to flow (Laplacian of the fluidity) could describe the spontaneous narrowing of the band after the bifurcation. In fact, dispersive effects can be cancelled by non-linear effects, leading to soliton-like solution as has been shown in a very recent theoretical work [34]. Shear bands could then be seen as localized solution in the dynamical systems meaning of the term. Nevertheless, a clear physical picture of the competing effects at play in the process is still missing, which points out the necessity of a clear understanding of what is hidding behind the fluidity state variable.
To conclude, we have shown experimentally that the failure of a granular material in uniaxial compression is linked to a supercritical bifurcation. This bifurcation coined the emergence of a definite orientation in the diffuse plasticity field. The orientation observed corresponds to the Mohr-Coulomb angle deduced from the plateau of the loading curve but its emergence preceeds this plateau. A strong narrowing of the band follows as the loading proceed until a stationary size is reached. In the present work, the fluctuations of the strain field have been removed by the averaging process that allows image analysis. Those fluctuations in the vicinity of the bifurcation are awaited to play a major role [16, 17] and are probably linked to the micro-bands observed at the earlier stages of the loading [12]. The study of those fluctuations is the subject of a future work.
Acknowledgements.
It is a pleasure to thank J. Crassous, S. McNamara and J. Weiss for fruitful discussions.References
- [1] Schall, P. and van Hecke, M. Annu. Rev. Fluid Mech. 42, 67–88 (2010).
- [2] Plasticity and geomechanics, Davis, R. O. and Selvadurai, A. P. S. (Cambridge University Press, 2002).
- [3] Bifurcation analysis in geomechanics. Vardoulakis, I. and Sulem, J. (Blackie Academic and Professional, Glasgow, England, 1995).
- [4] Desrues, J. and Viggiani, G. Int. J. Numer. Anal. Methods Geomech., 28, 279–321 (2004).
- [5] Rudnicki, J. W. and Rice, J. R. J. Mech. Phys. Solids, 23, 371 (1975).
- [6] Bardet, J.P. Computers and geotechnics 10, 163 (1990).
- [7] Rechenmacher, A. L. J. Mech. Phys. Solids 54 22 (2006).
- [8] Hall, S. et al. Géotechnique 60, 315 (2010).
- [9] Andó, E., Hall, S. A., Viggiani, G. and Desrues, J. Géotech. Lett. 3, 142 (2013).
- [10] Erpelding, M. et al. Strain 49, 167 (2013).
- [11] Le Bouil, A. et al. Gran. Matt. 16, 1 (2014).
- [12] Le Bouil, A., Amon, A., McNamara, S., and Crassous, J., Phys. Rev. Lett. 112, 246001 (2014).
- [13] Desrues, J. and Andó, E. C. R. Physique 16, 26 (2015).
- [14] Tordesillas, A. et al. EPL 110, 58005 (2015).
- [15] Barrat, J.-L. and Lemaître, A. in Dynamical heterogeneities in glasses, colloids, and granular media (eds Berthier, L. et al.) Ch. 8, 264–297 (Oxford University Press, 2011).
- [16] Gimbert, F., Amitrano, D., and Weiss, J., EPL 104, 46001 (2013).
- [17] Lin, J., Gueudré, T., Rosso, A., and Wyart, M., Phys. Rev. Lett. 115, 168001 (2015).
- [18] Dijksman, J. A., Wortel, G. H., van Dellen, L. T. H., Dauchot, O., and van Hecke, M., Phys. Rev. Lett. 107, 108303 (2011).
- [19] Chikkadi, V., Miedema, D. M., Dang, M. T., Nienhuis, B., and Schall, P., Phys. Rev. Lett. 113, 208301 (2014).
- [20] Jaiswal, P. K., Procaccia, I., Rainone, C., and Singh, M., Phys. Rev. Lett. 116, 085501 (2016).
- [21] Statics and Kinematics of Granular Materials, R. M. Nedderman (Cambridge University Press, 1992).
- [22] Erpelding, M., Amon, A., and Crassous, J. Phys. Rev. E 78, 046104 (2008).
- [23] Eshelby, J. D. Proc. R. Soc. A, 241, 376 (1957).
- [24] Lehoucq, R. et al. Front. Phys., 2, 84 (2015).
- [25] Welker, P., PhD Thesis, Universität Stuttgart (2011) http://dx.doi.org/10.18419/opus-5019.
- [26] Duda, R. O., and Hart, P. E., Comm ACM 15, 11 (1972).
- [27] Komatsu, T. S., Inagaki, S., Nakagawa, N., and Nasuno, S., Phys. Rev. Lett. 86, 1757 (2001).
- [28] Crassous, J., et al., J. Stat. Mech. Theory Exp. 3 P03009 (2008).
- [29] Nichol, K. et al., Phys. Rev. Lett. 104, 078302 (2010).
- [30] Reddy, K. A., Forterre, Y., and Pouliquen, O., Phys. Rev. Lett. 106 108301 (2011).
- [31] Kamrin, K., and Koval, G., Phys. Rev. Lett. 108, 178301 (2012).
- [32] Bouzid, M. et al., Eur. Phys. J. E 38, 125 (2015).
- [33] Henann, D. L., and Kamrin, K., Phys. Rev. Lett. 113, 178001 (2014).
- [34] Benzi, R. et al., Soft Matter 12, 514 (2016).