The TDE ASASSN-14li and its host resolved at parsec scales with the EVN
Abstract
We report European Very Long Baseline Interferometry Network (EVN) radio continuum observations of ASASSN-14li, one of the best studied tidal disruption events (TDEs) to date. At 1.7 GHz with mas resolution, the emission is unresolved. At 5.0 GHz with mas resolution, the radio emission shows an extended structure that can be modeled with two components: a core-like component and a fainter, possibly elongated source 4.3 mas ( pc) away. Our observations are not conclusive as to the nature of the components, but three scenarios are discussed. One possibility is a core-jet/outflow morphology, thus making of ASASSN-14li the first TDE jet/outflow directly imaged. For this case, the projected separation between the two components can only be explained by superluminal motion, rather than the lower velocities inferred from low-resolution radio observations. However, typical fast moving jets have brightness temperatures orders of magnitude higher than we find, thus making this scenario less likely. The second possibility is that we are imaging a non-relativistic jet from past AGN/TDE activity. In this case a past TDE is preferred given that the spatial extension and radio luminosity of the elongated component are consistent with the theoretical predictions for a TDE outflow. Alternatively, the two sources could indicate the presence of a binary black hole, which would then naturally explain the enhanced TDE rates of post-starburst galaxies. Future EVN observations will help us to distinguish between these scenarios.
1 Introduction
Supermassive black holes (SMBHs) have masses between – and they can be as luminous as an entire galaxy ( erg s-1; Kormendy & Ho, 2013). Their luminosity is regulated by the accretion of surrounding material. It has long been recognized that accretion onto an SMBH could operate in two modes: steadily or intermittently (Shields & Wheeler, 1978). Steady accretion can be sustained by hot gas from the host halo, stellar winds in the galactic nucleus, etc. (Shull, 1983). Sudden/intermitent accretion can occur when the SMBH swallows clouds of cold gas (Tremblay et al., 2016) or orbiting stars in their vicinity (Hills, 1975; Rees, 1988; Evans & Kochanek, 1989). In the latter of these feeding possibilities, the so-called tidal disruption events (TDEs), the total or partial disruption of the star provides fuel that is promptly fed to the accretion disk.
TDEs have been identified at optical, UV and X-ray wavelengths, but little is known about their radio emission (see the review by Komossa, 2015). It seems likely that only a small fraction of TDEs produce significant radio emission (see, e.g., Generozov et al., 2017). Either most TDEs do not launch jets, or their opening angles are so small that they easily go undetected (Bower et al., 2013; van Velzen et al., 2013; Generozov et al., 2017). High-resolution observations of NGC 4845, the nearest TDE host, will likely provide valuable constraints on the TDE production of radio jets (Irwin et al., 2015).
Swift J is a particularly interesting case as radio and X-ray observations provided strong evidence of relativistic outflows from a TDE for the first time (Bloom et al., 2011; Burrows et al., 2011; Levan et al., 2011; Zauderer et al., 2011). However, Swift J was observed using Very Long Baseline Interferometry (VLBI) repeatedly during 2011 (Berger et al., 2012) and the radio source remained unresolved at a resolution of 0.2 mas, implying an upper limit on the expansion velocity of . Continued monitoring with the European VLBI Network (EVN) from 2011 to 2015 has shown that the radio source is still compact, and the measurements are in agreement with either a rapidly decelerating source (average ) or a very small viewing angle (Yang et al., 2016).
A very important discovery was made with ASASSN-14li. Initially identified in the optical, this is one of the few TDEs to show evidence of both thermal and non-thermal components. ASASSN-14li was discovered by the All-Sky Automated Survey for Supernovae (ASAS-SN; Shappee et al., 2014) on 2014 November 22 at the center of the nearby (, Mpc) post-starburst galaxy PGC 043234 (Holoien et al., 2016). PGC 043234 appears to be the remnant of a recent merger that likely hosted a low-luminosity Type II AGN prior to the TDE (Prieto et al., 2016). Holoien et al. (2016) present the optical, UV and X-ray properties of the event, followed by additional X-ray (Miller et al., 2015; Brown et al., 2016), UV (Cenko et al., 2016), radio (Alexander et al., 2016; van Velzen et al., 2016, and this work), and mid-IR (Jiang et al., 2016) studies.
The radio observations by Alexander et al. (2016) pointed to a non-relativistic outflow that would have been ejected between 2014 August 11 and 25 August with an apparent velocity of –. The high-frequency radio observations by van Velzen et al. (2016) also favored a non-relativistic jet interpretation. Krolik et al. (2016) argue that the radio emission was produced by the ejected, unbound tidal debris.
2 Observations and data analysis
ASASSN-14li was observed with the EVN in 2015 under program EP096 (PI: J. L. Prieto). The observations consisted of three observing segments (see Table 1). Segment A was used to confirm the detection of compact radio emission. Subsequent dual-frequency observations (segments B and C) were made quasi-simultaneously to obtain an accurate spectral slope. Segment A lasted a total of 7 hr and segments B and C lasted 5 hr. Our observing setup resulted in an aggregate bit rate of 1024 Mbps at 2 bit sampling. We used an integration time of 2 s and 8 sub-bands of 16 MHz each with full polarization. OQ208 and J11592914 were used as fringe finders. J12501621 was used as a phase calibrator. This is a compact source at a projected distance of 15 from ASASSN-14li, thus well below the maximum calibrator-to-target separation of 5° recommended for VLBI observations (e.g., Fomalont, 2005; Martí-Vidal et al., 2010). J11592914 remained constant at a 1 level in both time and frequency, and had a flux density of 0.190.01 Jy in segment B.
| Segment | Observing | Time on | EVN stationsaaLocations and diameters are found at http://www.evlbi.org/user_guide/EVNstatus.txt | |
|---|---|---|---|---|
| date | (GHz) | source (hr) | ||
| A | 2015 Apr 14 | 1.7 | 3.7 | Ef, Jb1, On, Hh, Sh, Wb, Tr, Jd, T6 |
| B | 2015 Jun 10 | 5.0 | 3.3 | Ef, Jb2, On, Hh, Sh, Wb, Tr, Mc, Sv, Zc, Bd, Nt, Ys |
| C | 2015 Jun 12 | 1.7 | 3.2 | Ef, Jb1, On, Hh, Sh, Wb, Tr, Mc, Sv, Zc, Bd |
We reduced the data within the National Radio Astronomy Observatory (NRAO) Astronomical Image Processing System (aips). The calibration products from the EVN pipeline were used to inspect the quality of the data. We took into account ionospheric corrections and radio frequency interference to improve the calibration. Images of the calibrators revealed compact morphologies, so there was no need to add a model for fringe fitting.
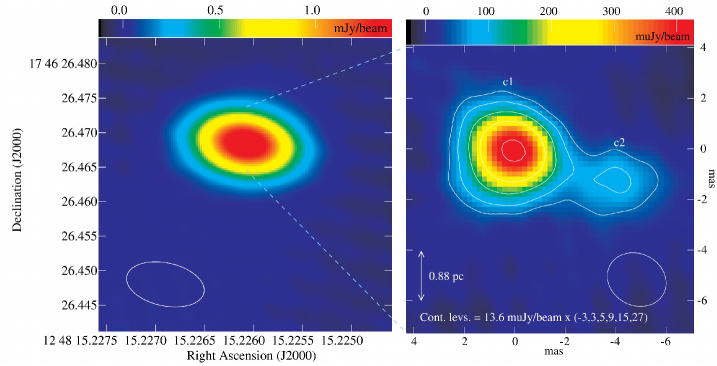
Figure 1 shows a color image of the naturally weighted maps from the 2015 June observations at the two bands, and Table 2 reports the source model parameters for all the maps. The uncertainties in peak intensity and flux density are obtained by adding in quadrature the noise (rms) in each map to a 5% uncertainty in the point-source calibration. For the flux density uncertainties, the noise term includes a factor equal to the number of beams covering the emitting region.
The images at 1.7 GHz show an unresolved source regardless of the weighting scheme used for imaging in both segments A and C. For the observations in 2015 June, we made a 5.0 GHz map using the same convolving beam as the one obtained at 1.7 GHz with natural weighting, thus effectively degrading its resolution. This allowed us to obtain a global spectral index () of (defined as ).
The natural weighted map at 5.0 GHz (Figure 1, right panel) shows an extended structure that can be modeled with two components: a core-like one, and a possibly elongated one with a peak. Their ICRF2 J2000 peak positions are , and , , where the subscripts correspond to the labels in Table 2 and Figure 1. The position uncertainty is less than 1 mas, even after taking into account the random errors in the position of the phase reference calibrator. The peak of the elongated component (c2) is at a projected distance of 4.3 mas or 1.9 pc ( cm) from the peak of component c1.
In the process of phase-referencing, solving for residual phase errors determined for the calibrator source at a slightly different sky position and at slightly different times than the target observations, some random and/or systematic phase errors may have been left uncalibrated. As a result, spurious, low-level structures may appear in the maps. ASASSN-14li was too weak to apply self-calibration in phase and account for such errors. This problem can also be alleviated with the use of an additional source brighter than the target and observed in the same way, as done by Yang et al. (2016) in their observations of Swift J. If the same structure is observed toward both the target and the check source, then the common structure can be attributed to errors in the phase calibration. In this case, our observations did not include such source, and only future observations can verify the morphology of the target. However, we did thoroughly test the reliability of the structures we find. We experimented with different weighting regimes while imaging to test whether the observed structure could be an artifact. There are, for example, no correlations between the sidelobes and the emitting components. We made images both with aips and the Caltech imaging program difmap (Shepherd et al., 1995), and consistently find the same source structures and intensities in all our imaging trials in both packages.
| Segment | FWHM | rms | Deconvolved | log10 | |||
|---|---|---|---|---|---|---|---|
| (mas2, deg) | ( ) | ( ) | ( ) | ( ) | size (mas2, deg) | (K) | |
| A | , 83 | 34.4 | , 105.3 | ||||
| B | , 78 | 14.5 | , 67.6 | ||||
| C | , 78 | 40.0 | , 144.6 | ||||
| Bc1c1 Core-like component | , 111.2 | ||||||
| , 71 | 13.6 | ||||||
| Bc2c2 Elongated component | , 89.1 |
Note. — Col. 1 – major and minor synthesized beam fitted FWHM of each map. Col. 2 – rms value. Col. 3 – peak intensity. Col. 4 – flux density. Col. 5 – luminosity at the central frequency. Col. 6 – deconvolved size. Col. 7 – brightness temperature.
3 The nature of the radio emission
Alexander et al. (2016) reported Very Large Array (VLA) observations of ASASSN-14li at similar dates and frequencies to those we report here. The fluxes they find on 2015 April 21 ( at 1.8 GHz) and 2015 June 17 ( at 1.8 GHz and at 5.0 GHz) are significantly higher than we found, although the implied spectral index of is similar. Effectively, the flux density at 1.8 GHz from the VLA observations can be considered as constant within the uncertainties. In the case of the EVN measurements we observe an increase of % at a similar frequency, although the significance of this apparent increase is low ( times the standard error of the mean). For all observations, the flux density at 5.0 GHz is always lower than the corresponding flux at 1.7 GHz (or 1.8 GHz) in the same epoch.
It is known that the flux density recovered in phase-referenced VLBI experiments decreases with increasing observed frequency and calibrator-to-target separation (e.g., Martí-Vidal et al., 2010). For the frequencies we observed here and given the small separation between ASASSN-14li and J12501621, the loss in flux density should be of only a few percent, and thus not significant to explain the drop in flux density in the EVN measurements with respect to the VLA ones. Instead, we assume that there must be a significant amount of diffuse, extended emission recovered by the VLA B/BnA configuration beam (). This could also explain the slightly higher flux ( ) we measure in the FWHM map from the Faint Images of the Radio Sky at Twenty-cm survey (FIRST; Becker et al., 1995), and the apparently even higher flux density ( ) we measure in the FWHM map of the NRAO VLA Sky Survey (NVSS; Condon et al., 1998). The 1.4 GHz observations reported by van Velzen et al. (2016) at a resolution of 11″–13″, are consistent with the flux densities measured in both the NVSS and FIRST images within the uncertainties. Given the different beam sizes, there is no strong evidence for missing flux when comparing pre- and post-TDE measurements. The diffuse emission we are resolving out with the EVN at both 1.7 and 5.0 GHz, is likely related with the pre-TDE steady source, a putative AGN, as proposed by Alexander et al. (2016) and van Velzen et al. (2016).
Prieto et al. (2016) present evidence for a pre-existing AGN in PGC 043234 based on the emission line ratios of diffuse gas near the galaxy. As noted above, Alexander et al. (2016) argue that there must be a steady source within the radio emission measured with the VLA whose flux density follows . Such a steep power-law for the flux density implies large radiative losses and an old radiative age for the putative AGN (older than a few times yr, e.g., Murgia et al., 2011). The optically-thin spectral behavior is consistent with the non-thermal ( K) core-like component observed with the EVN. The spectral index is probably less steep than as we infer from our EVN observations, where the spectral index is dominated by the core-like component, given that the elongated, fainter one represents only % of the total flux density.
Holoien et al. (2016) obtained a pre-TDE ROSAT X-ray flux limit for the AGN in the host. The corresponding hard X-ray (2–10 keV) luminosity is erg s-1, obtained using the Mission Count Rate Simulator at http://heasarc.gsfc.nasa.gov/cgi-bin/Tools/w3pimms/w3pimms.pl with an input photon index of 2 fitted in the 0.08–2.9 keV energy range (Holoien et al., 2016). Considering the 2–10 keV luminosity and the 5 GHz luminosity of the steady component described by Alexander et al. (2016), we obtain for the radio to hard X-ray luminosity ratio (as described by Terashima & Wilson, 2003). The AGN thus lies in the region dominated by low-luminosity AGNs and hard-state Seyferts (in agreement with Prieto et al., 2016), and we infer that the pre-TDE AGN was not very active, likely due to starvation (Ho, 2002).
The origin of the possibly elongated component is less clear. The projected distance between the peak positions of the components is 1.9 pc. If the elongated component is an outflow or a jet related to ASASSN-14li, and was ejected on 2014 August 11–25 (Alexander et al., 2016), then its apparent velocity is () is –. Such superluminal motion disagrees with the interpretation of ASASSN-14li as a non-relativistic outflow/jet or unbound debris (Alexander et al., 2016; van Velzen et al., 2016; Krolik et al., 2016). Following Boettcher et al. (2012), we calculate a lower limit for the bulk Lorentz factor, , of 7.5–7.8, and a maximum viewing angle of 147–154 at which can be achieved. Given that , the maximum viewing angle should be close to the critical angle, which in this case is within the lower-end of the values typically found for steep-spectrum radio quasars and the upper end of the values for flat-spectrum radio quasars (Urry & Padovani, 1995; Padovani, 2007). We note, however, that the typical brightness temperature for jet features observed with VLBI is usually a few times K (Kellermann et al., 2007). Those authors also found that there are no low-luminosity sources (as we find here) with fast apparent velocities. This makes the relativistic jet/outflow scenario less plausible.
If the elongated component is a non- or mildly-relativistic outflow or jet from a past AGN flare or a previous TDE, then it would have been ejected before 2009, for an apparent velocity of . In particular, if it is the unbound debris ejected from a past TDE, theoretical models predict that the typical velocity would be (Chen et al., 2016; Guillochon et al., 2016). With such a velocity, the unbound debris stream could traverse typically a distance of pc before being completely stalled by the interstellar medium (ISM; Guillochon et al., 2016). Therefore, the elongated component which we detected at a distance of about 2 pc from the core can be interpreted as an unbound debris stream still evolving in the free-expansion phase. Given the theoretical velocity and the projected distance between components c1 and c2, we also infer that the past TDE happened about 150 years ago and the TDE rate in this post-starburst galaxy is about yr-1. Such a high event rate is not unusual for systems containing binary SMBHs (Chen et al., 2009, 2011) and has been inferred for TDEs hosted in post-starburst galaxies (Arcavi et al., 2014; French et al., 2016). Given this rate, we calculate the luminosity at 5 GHz using our model of shock heating and synchrotron cooling of unbound debris assuming an ISM similar to that in the Galactic Center, and we find – erg s-1 (figure 9 in Guillochon et al., 2016). This luminosity is also consistent with what we derived for the elongated component in Table 2.
The host of ASASSN-14li is a post-starburst galaxy and has a morphology suggestive of previous merger activity (Prieto et al., 2016), where the presence of a binary BH would be expected. Thus, if components c1 and c2 are truly separate components, an alternative scenario for their origin would be a binary BH system. For a primary BH mass within – , the sphere of gravitational influence is on the order of – cm. This is comparable to the observed separation and is on these scales where the TDE rate enhancement is expected to be significant (e.g., Chen et al., 2009, 2011; Liu & Chen, 2013).
4 Conclusions
Milliarcsec resolution observations of ASASSN-14li and its host have allowed us to resolve the radio emission into two components connected by a bridge of diffuse emission. Due to their morphology, one of the sources could represent a putative AGN, whilst the possibly elongated source could correspond to a jet/outflow knot related to ASASSN-14li. If the proper motion of the elongated component is sustained at a rate of 5.2–5.4 mas yr-1, our future EVN observations (project ER045) should easily detect these changes. This scenario will favor the interpretation of ASASSN-14li as the first superluminal TDE jet ever resolved, although we note that superluminous jets are much brighter than what we find here. If no proper motion is noticeable in the new observations, this would imply that the elongated component moves indeed at subluminal speeds, hence favoring its interpretation as a past AGN/TDE flare. However, observations with a better uv-sampling are needed in order to corroborate the morphology of the fainter source (elongated vs. compact). If it turns out to be compact, then there would be a higher possibility that this system is a binary BH, the one with the smallest separation ever found.
References
- Alexander et al. (2016) Alexander, K. D., Berger, E., Guillochon, J., Zauderer, B. A., & Williams, P. K. G. 2016, ApJ, 819, L25
- Arcavi et al. (2014) Arcavi, I., Gal-Yam, A., Sullivan, M., et al. 2014, ApJ, 793, 38
- Becker et al. (1995) Becker, R. H., White, R. L., & Helfand, D. J. 1995, ApJ, 450, 559
- Berger et al. (2012) Berger, E., Zauderer, A., Pooley, G. G., et al. 2012, ApJ, 748, 36
- Bloom et al. (2011) Bloom, J. S., Giannios, D., Metzger, B. D., et al. 2011, Science, 333, 203
- Boettcher et al. (2012) Boettcher, M., Harris, D. E., & Krawczynski, H. 2012, Relativistic Jets from Active Galactic Nuclei, by M. Boettcher, D.E. Harris, ahd H. Krawczynski, 425 pages. Berlin: Wiley, 2012,
- Bower et al. (2013) Bower, G. C., Metzger, B. D., Cenko, S. B., Silverman, J. M., & Bloom, J. S. 2013, ApJ, 763, 84
- Brown et al. (2016) Brown, J. S., W.-S Holoien, T., Auchettl, K., et al. 2016, arXiv:1609.04403
- Burrows et al. (2011) Burrows, D. N., Kennea, J. A., Ghisellini, G., et al. 2011, Nature, 476, 421
- Cenko et al. (2016) Cenko, S. B., Cucchiara, A., Roth, N., et al. 2016, ApJ, 818, L32
- Chen et al. (2009) Chen, X., Madau, P., Sesana, A., & Liu, F. K. 2009, ApJ, 697, L149
- Chen et al. (2011) Chen, X., Sesana, A., Madau, P., & Liu, F. K. 2011, ApJ, 729, 13
- Chen et al. (2016) Chen, X., Gómez-Vargas, G. A., & Guillochon, J. 2016, MNRAS, 458, 3314
- Condon et al. (1998) Condon, J. J., Cotton, W. D., Greisen, E. W., et al. 1998, AJ, 115, 1693
- Evans & Kochanek (1989) Evans, C. R., & Kochanek, C. S. 1989, ApJ, 346, L13
- Fomalont (2005) Fomalont, E. B. 2005, Astrometry in the Age of the Next Generation of Large Telescopes, 338, 335
- French et al. (2016) French, K. D., Arcavi, I., & Zabludoff, A. 2016, ApJ, 818, L21
- Generozov et al. (2017) Generozov, A., Mimica, P., Metzger, B. D., et al. 2017, MNRAS, 464, 2481
- Guillochon et al. (2016) Guillochon, J., McCourt, M., Chen, X., Johnson, M. D., & Berger, E. 2016, ApJ, 822, 48
- Hills (1975) Hills, J. G. 1975, Nature, 254, 295
- Holoien et al. (2016) Holoien, T. W.-S., Kochanek, C. S., Prieto, J. L., et al. 2016, MNRAS, 455, 2918
- Ho (2002) Ho, L. C. 2002, ApJ, 564, 120
- Irwin et al. (2015) Irwin, J. A., Henriksen, R. N., Krause, M., et al. 2015, ApJ, 809, 172
- Jiang et al. (2016) Jiang, N., Dou, L., Wang, T., et al. 2016, ApJ, 828, L14
- Kellermann et al. (2007) Kellermann, K. I., Kovalev, Y. Y., Lister, M. L., et al. 2007, Ap&SS, 311, 231
- Komossa (2015) Komossa, S. 2015, Journal of High Energy Astrophysics, 7, 148
- Kormendy & Ho (2013) Kormendy, J., & Ho, L. C. 2013, ARA&A, 51, 511
- Krolik et al. (2016) Krolik, J., Piran, T., Svirski, G., & Cheng, R. M. 2016, ApJ, 827, 127
- Levan et al. (2011) Levan, A. J., Tanvir, N. R., Cenko, S. B., et al. 2011, Science, 333, 199
- Liu & Chen (2013) Liu, F. K., & Chen, X. 2013, ApJ, 767, 18
- Martí-Vidal et al. (2010) Martí-Vidal, I., Ros, E., Pérez-Torres, M. A., et al. 2010, A&A, 515, A53
- Miller et al. (2015) Miller, J. M., Kaastra, J. S., Miller, M. C., et al. 2015, Nature, 526, 542
- Murgia et al. (2011) Murgia, M., Parma, P., Mack, K.-H., et al. 2011, A&A, 526, A148
- Padovani (2007) Padovani, P. 2007, The First GLAST Symposium, 921, 19
- Prieto et al. (2016) Prieto, J. L., Krühler, T., Anderson, J. P., et al. 2016, ApJ, 830, L32
- Rees (1988) Rees, M. J. 1988, Nature, 333, 523
- Shappee et al. (2014) Shappee, B. J., Prieto, J. L., Grupe, D., et al. 2014, ApJ, 788, 48
- Shepherd et al. (1995) Shepherd, M. C., Pearson, T. J., & Taylor, G. B. 1995, BAAS, 27, 903
- Shields & Wheeler (1978) Shields, G. A., & Wheeler, J. C. 1978, ApJ, 222, 667
- Shull (1983) Shull, J. M. 1983, ApJ, 264, 446
- Tremblay et al. (2016) Tremblay, G. R., Oonk, J. B. R., Combes, F., et al. 2016, Nature, 534, 218
- van Velzen et al. (2013) van Velzen, S., Frail, D. A., Körding, E., & Falcke, H. 2013, A&A, 552, A5
- van Velzen et al. (2016) van Velzen, S., Anderson, G. E., Stone, N. C., et al. 2016, Science, 351, 62
- Terashima & Wilson (2003) Terashima, Y., & Wilson, A. S. 2003, ApJ, 583, 145
- Urry & Padovani (1995) Urry, C. M., & Padovani, P. 1995, PASP, 107, 803
- Yang et al. (2016) Yang, J., Paragi, Z., van der Horst, A. J., et al. 2016, MNRAS, 462, L66
- Zauderer et al. (2011) Zauderer, B. A., Berger, E., Soderberg, A. M., et al. 2011, Nature, 476, 425