iint \restoresymbolTXFiint
ALFALFA and WSRT Imaging of Extended H i Features in the Leo Cloud of Galaxies
Abstract
We present ALFALFA H i observations of a well studied region of the Leo Cloud, which includes the NGC 3227 group and the NGC 3190 group. We detect optically dark H i tails and plumes with extents potentially exceeding 600 kpc, well beyond the field of view of previous observations. These H i features contain 40% of the total H i mass in the NGC 3227 group and 10% in the NGC 3190 group. We also present WSRT maps which show the complex morphology of the extended emission in the NGC 3227 group. We comment on previously proposed models of the interactions in these groups, and the implications for the scale of group processing through interactions. Motivated by the extent of the H i plumes, we place the H i observations in the context of the larger loose group, demonstrating the need for future sensitive, wide field H i surveys to understand the role of group processing in galaxy evolution.
keywords:
galaxies: evolution - - galaxies: groups: individual: (NGC 3190, NGC 3227, HCG 44) - - radio lines: galaxies1 Introduction
Most galaxies at z0 can be found in group environments (e.g. Tago et al., 2008), where evidence of tidal interactions and gas stripping are particularly prevalent (e.g. Hibbard et al., 2001a; Hibbard et al., 2001b). These observations of ongoing tidal interactions suggest that galaxies can undergo significant morphological evolution in the group environment, possibly playing a major role in the morphology-density relation (e.g. Postman & Geller, 1984; Bekki & Couch, 2011; Hess & Wilcots, 2013).
H i observations can give direct evidence to the fundamental role of group processing in galaxy evolution, tracing the recent interaction history of group galaxies (e.g. Yun et al., 1994). However, while the inner interactions of merging galaxies have been observed in detail, (e.g. Rand, 1994), H i studies covering the full extent of interactions in groups are difficult to execute due to the need for high sensitivity over wide fields; wide field H i surveys have been limited in resolution and sensitivity, and interferometric studies have been limited to the field of their primary beam.
Still, H i mapping on the group scale is important for understanding the ubiquity of these interactions, the fraction of gas involved, and the interaction time scales (e.g., Serra et al., 2015), which in turn constrain the impact of tidal processing in groups on galactic evolution, relative to other processes, like the decrease in cold gas accretion (Sancisi et al., 2008).
The Arecibo Legacy Fast ALFA (Arecibo L-band Feed Array) survey (ALFALFA; Giovanelli et al., 2005) provides high sensitivity, unbiased, wide field maps of H i in the local volume, and has traced the atomic gas distribution in a variety of local groups ( Stierwalt et al., 2009; Lee-Waddell et al., 2012; Lee-Waddell et al., 2014).
Here we present the ALFALFA data on a well studied loose group in the Leo Cloud, known to show significant evidence of interaction. The ALFALFA data are not limited to an arbitrary region on the sky, allowing us to search for additional structures and constrain the cold gas fraction outside stellar disks over the full 9 Mpc2 physical region. These data reveal substantial intragroup cold gas, demonstrating the power of sensitive, wide field H i mapping.
2 Placement in the Cosmic Web
2.1 The NBG 21-6 Region
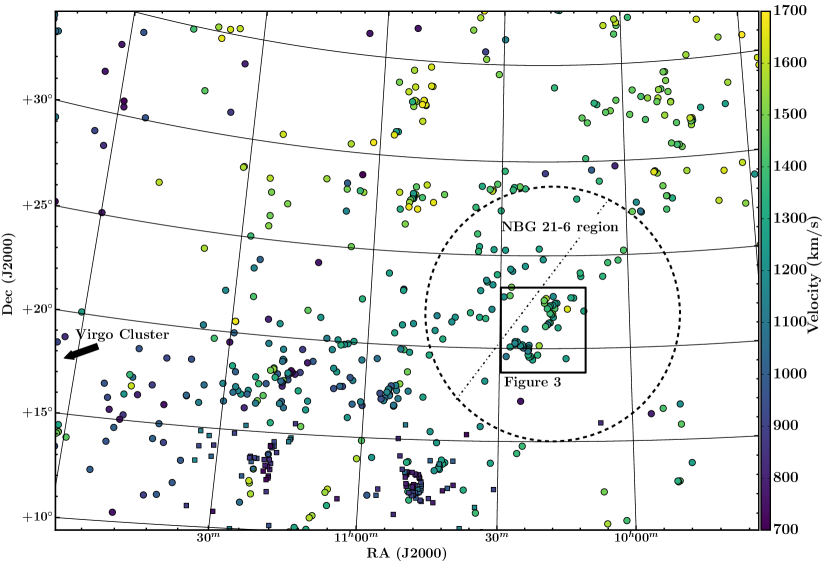
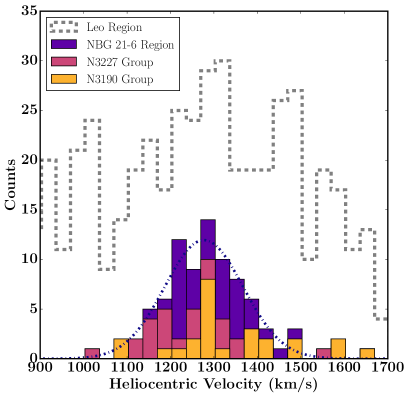
Figure 1111Data are taken from the Arecibo General Catalog (AGC), a private database maintained over the years by MPH and RG; it contains all bright galaxies and ones of known redshift as available in NED with cz 18000 km s-1 in the ALFALFA volume, additional unpublished H i results as they are acquired, and bright galaxies in other regions of the sky. shows the distribution of galaxies in the constellation Leo, between heliocentric recessional velocities of vh=700 km s-1 and 1700 km s-1. The primary structure in this velocity range is the Leo Cloud,222Analysis of the Leo Cloud is complicated by the superposition of the foreground Leo Spur at 10 Mpc, which is poorly discriminated in velocity space due to infall toward the Virgo Cluster (e.g., Tully, 1987; Karachentsev et al., 2015b). ALFALFA results for the southern part of the Leo Cloud were presented in Stierwalt et al. (2009), but the coverage there only extended to . a loose collection of groups stretching 50∘ across the plane of the sky at a distance of 20-30 Mpc, from the edge of the Virgo Cluster around 12h+15∘ (the lower left corner of Figure 1), to around 9h30m+35∘ (the upper right corner). A region of particular interest for H i studies (see section 2.3) is a loose association of galaxies spanning 6 Mpc in the NW part of the Leo Cloud (indicated with a dashed circle in Figure 1). Figure 2 shows the velocity distribution of H i sources in this region, which is approximately Gaussian, with an average heliocentric recessional velocity of 1304 km s-1, and a dispersion of 115 km s-1, in contrast with the more uniform distribution of the Leo Cloud at large.
Yet, the group relationships of galaxies in this region is unclear. Several studies assign the galaxies in this region to a single group (e.g., Huchra & Geller, 1982; Garcia, 1993), which we will refer to as NBG 21-6 following the nomenclature of the Nearby Galaxies Catalog (Tully, 1987). However, depending on the length scale chosen to link the galaxies, other authors have divided this region into two subgroups (e.g., Turner & Gott, 1976; Geller & Huchra, 1983), as indicated by the dash-dotted line in Figure 1, and still others further divide the SW subgroup (pictured in Figure 3) into the NGC 3227 group, and the NGC 3190 group (e.g., Makarov & Karachentsev, 2011).
Figure 2 also shows the velocity distributions of the component NGC 3190 and NGC 3227 groups, which have mean recessional velocities (dispersions) of 1220 (99) and 1353 (150) km s-1 respectively, in contrast with the distribution for the full NBG 21-6 region. Groups were assigned by selecting all sources within the boxed regions in Figure 3 (described in Section 4) within the stated velocity range. Tables 1 and 2 list the basic properties of the galaxies assigned to each group by this simplistic method (sources assigned to different groups by a more sophisticated algorithm (Makarov & Karachentsev, 2011) are noted with a star). Both the shape and narrowness of the velocity distribution suggest a relationship between the sources in the NBG 21-6, even while the precise nature of that relationship is uncertain.
2.2 Distances in the NBG 21-6 Region
Distance determinations to member galaxies compound the problem of group membership. Standard Hubble flow would give distances between 15 and 22 Mpc, but the entire region is falling into Virgo at 200 km s-1 (Karachentsev et al., 2015a), and individual galaxies are falling into the local filament and groups (see section 5.3). More, redshift-independent distance measurements for this group are both complicated and confusing. There are three sources with measured primary distances: NGC 3226 (23.6 Mpc) and NGC 3193 (34 Mpc) via surface brightness fluctuations (Tonry et al., 2001) and NGC 3190, which contains two type Ia supernovae that give distance estimates ranging from 18 (Amanullah et al., 2010) to 31 Mpc (Szabó et al., 2003) depending on calibration. However, given the strong interactions in this region, the primary distances to each of these objects may be strongly effected by systematic errors (see Serra et al., 2013 for a brief discussion). Other redshift-independent distances are little help, as estimates based on scaling relations are complicated by interactions; for example, estimates of distances to the merging pair NGC 3226/ NGC 3227 range from 14.5 Mpc (Yoshii et al., 2014) to 43.5 Mpc (Blakeslee et al., 2001).
Thus, observations that bridge the gap between individual galaxies and the group structure are important for disentangling the complex relationships in this region. In section 5 we argue that the sources in this region are gravitationally interacting, and likely to be at a similar distance. Using the corrections given in the NASA Extragalactic Database, based on the local velocity field model from Mould et al. (2000), we estimate a distance of 24.3 Mpc from the average velocity of the NBG 21-6 group. We thus choose to follow Serra et al. (2013) and assume a distance of 25 Mpc for all galaxies in the region for the remainder of this paper. We further defend this choice in section 5.3.
2.3 Interactions in the NBG 21-6 Region
Previous studies have found significant evidence of interactions between group members in the NBG 21-6 region. The NGC 3190 group centers around Hickson Compact Group 44 (HCG 44), a compact group of four galaxies of similar optical brightness. Several studies have found that the galaxies in HCG 44 appear to be H i deficient (see section 5.1), and NGC 3187 and NGC 3190 show strong morphological evidence of tidal interactions. Moreover, Serra et al. (2013) report the discovery of a large 300 kpc H i tail extending to the north and west of the group.
Similarly, Mundell et al. (1995) found two tails stretching 7′ north and 16′ south (51 and 116 kpc at D=25 Mpc) of the interacting pair NGC 3226 and NGC 3227 (also called Arp 94) in deep C and D array VLA imaging. Optical imaging shows a complex set of faint stellar filaments, arcs, and loops, and Appleton et al. (2014) suggest a complex interaction history based on a plethora of multi-wavelength data.
While previous observations have been sufficient to reveal the complex nature of both the NGC 3227 and NGC 3190 groups, they have been limited by the field of view of their observations. Here we present the the first high sensitivity, complete H i maps of then entire region, corroborating and extending these results (see sections 4.1 and 4.2 for the NGC 3227 and NGC 3190 subgroups respectively), and painting a global picture of H i in the region.
3 Observations and Data
3.1 H i Data from the ALFALFA Survey
The ALFALFA observations and data processing are described in detail in previous papers (Giovanelli et al., 2005; Saintonge, 2007; Martin et al., 2009; Haynes et al., 2011). In brief, ALFALFA employs a two-pass, fixed azimuth drift scan strategy, with a bandwidth of 100 MHz and a spectral resolution of 24.4kHz (5.3 km s-1 at z=0) before Hanning smoothing. The data are bandpass subtracted, calibrated, and then flagged interactively for radio frequency interference (RFI). Once this “level 1" processing is complete, the data are gridded into cubes 2.4∘ on a side and spanning the full spectral bandwidth from -2000 to 18,000 km s-1 (though the cubes are split into four subcubes of 1024 spectral channels each for easy processing). Each cube was flatfielded and rebaselined, and corrected for residual telescope pointing errors. Sources are extracted using the methods of Saintonge (2007), and then each grid is examined by eye to improve on the automatic detection algorithm at lower signal to noise ratios (SNRs) and to identify optical counterparts in Sloan Digital Sky Survey (SDSS) and Digitized Sky Survey 2 (DSS2) images; final source parameters are measured and catalogued interactively. The public 70% ALFALFA catalogue has 25,000 high SNR extragalactic detections (Jones et al., 2016).
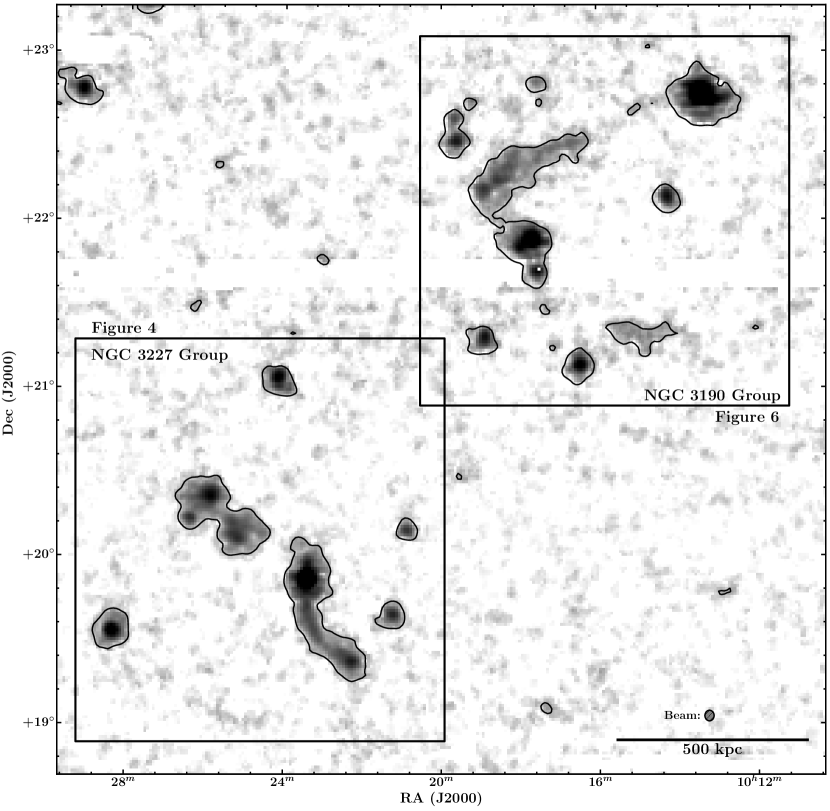
Due to their large angular extent, the structures discussed in this paper were originally split across multiple cubes. Thus, to better study the region on physically relevant scales, the ALFALFA data were regridded into a single 50 square degree cube centered at 10h20m +21∘. The moment 0 map of the central portion of this region is shown in Figure 3. This map was created by first smoothing to 2x the beam size and then masking pixels below 2.5. Actual telescope scheduling, gain differences between the ALFA beams, and significant flagging due to RFI resulted in uneven integration times and rms values across the cube. To correct for this we used a weights map of effective integration time after flagging to create an rms cube which allowed us to determine the appropriate threshold for masking. One strip in particular, 21d38m, was strongly affected by low level RFI and required additional masking. The mask was then applied to the unsmoothed cube, which was then summed over velocity channels from 911 to 1722 km s-1, encompassing the full velocity range of the sources in the group.
Total H i fluxes for all sources in the region were extracted manually using the standard ALFALFA software (see Haynes et al., 2011). However, the ALFALFA algorithm is optimized for point sources rather than highly extended and asymmetric sources like the features discussed below. Thus, all sources were remeasured by a modified version of the software which spatially integrates the spectrum over any arbitrary shaped area, and then divides by the summed value of the normalized beam over the same set of image pixels (e.g., Shostak & Allen, 1980). This method gives consistent measurements with the standard software on point sources, and recovers up to 20% more flux for the extended sources in this field.
3.2 H i Synthesis Imaging with WSRT
Three sources in the vicinity of NGC 3226/7 were included in an exploratory sample of synthesis observations studying extreme H i sources without optical counterparts in ALFALFA (see Cannon et al., 2015 and Janowiecki et al., 2015 for more details). The connection to NGC 3226/7 was noted, but the nature of the dark H i knots, given their large separations from the merging pair, was unclear.
We observed these three sources with 4x12h pointings with WSRT, 2 centered at 10h25m21.0s +20∘10′05″, one centered at 10h22m26.2s +19∘23′17″ and one at 10h25m55.0s +20∘20′33″. The primary beams of the three pointing centers are 35′ wide. We centered observations on the H i line in one band of 10 MHz bandwidth and 1024 channels in two polarizations. This resulted in a broad range of line free channels for continuum subtraction and a velocity resolution of 4.1 km s-1 (FWHM) after Hanning smoothing.
We reduced the data using the same automated pipeline as applied in Wang et al. (2013), originally used by Serra et al. (2012), as described in Janowiecki et al. (2015). The pipeline uses the data reduction software Miriad (Sault et al., 1995) wrapped into a Python script. In brief, the pipeline automatically flags the data for RFI using a clipping method after filtering the data in both the frequency and time domain. After primary bandpass calibration, it iteratively deconvolves the data with the CLEAN algorithm in order to apply a self-calibration, using CLEAN masks determined on the cube with decreasing clip levels. We then subtract the continuum in the visibility domain and apply the calibration solution to the visibilities to then invert the data after Hanning smoothing. We then iteratively clean the data cubes down to the rms noise in the cubes, using CLEAN masks determined by filtering the data cubes with Gaussian kernels and applying a clip level. We used a Robust weighting of r=0.4, and binned the data to a velocity resolution of 12.3 km s-1(FWHM; 6.0km s-1 channels) after Hanning smoothing.
For each cube we then created H i total flux maps by smoothing the images to 2x the beam size, masking any pixel below 3, applying the mask to the unsmoothed cubes, and then summing along the velocity axis. We calculate H i column densities assuming optically thin H i gas that fills the WSRT beam, and also produce H i moment 1 velocity maps from cubes masked at 3. We measure the H i flux by applying a mask based on the smoothed moment 0 map to cubes corrected for primary beam attenuation, and then extracting and fitting 1D spatially integrated H i profiles. These fluxes are reported in Table 1.
4 Results
Figure 3 shows the ALFALFA moment 0 map of the central 20 deg2 of the regridded cube. At 25 Mpc, this image covers 2x2 Mpc on the sky. The NGC 3227 and NGC 3190 groups are visible to the southeast and northwest of the center of the image, and are shown in greater detail in Figures 4 and 6 respectively. The H i plumes associated with NGC 3227 and the large feature in the NGC 3190 group extend to similar scales as the groups themselves. Indeed, Makarov & Karachentsev (2011) estimate the harmonic radii of the NGC 3227 and NGC 3190 groups to be 125 kpc and 276 kpc respectively (at D=25 Mpc), significantly less than the projected length of the structures discussed below. The large extent of these H i features is the main result of this paper. Here we describe the properties and extent of the features in the NGC 3227 and NGC 3190 groups in sections 4.1 and 4.2, and then discuss the mass of cold intragroup gas in section 4.3.
4.1 Extended Tails in the NGC 3227 Group
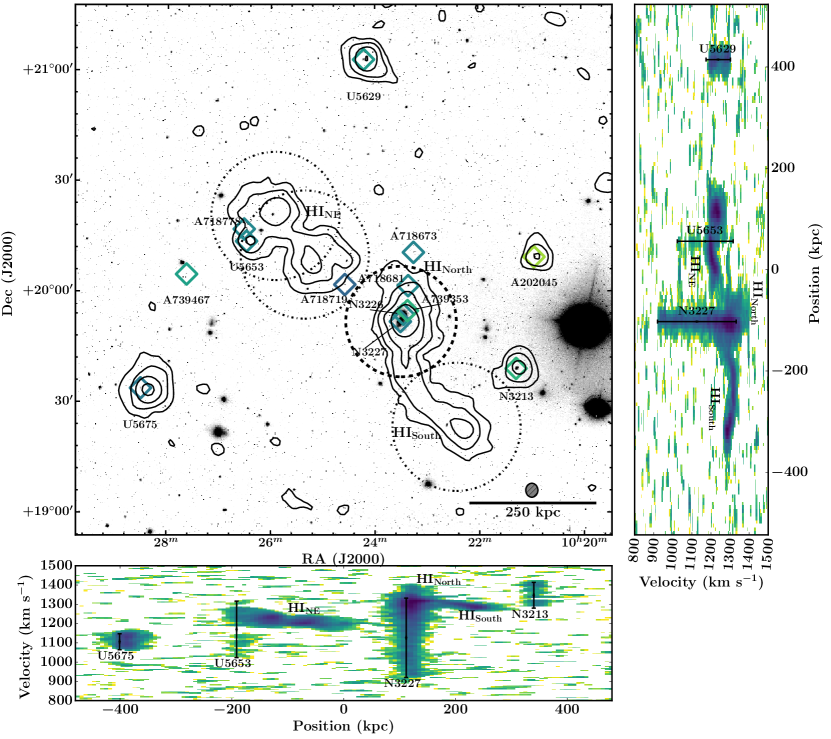
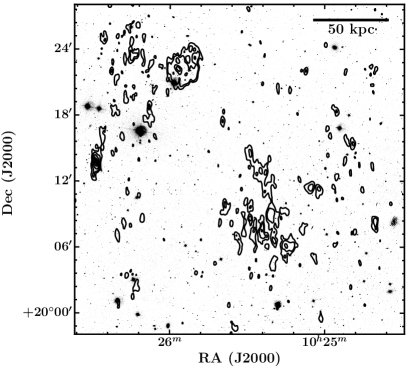
Figure 4 shows the ALFALFA data for the NGC 3227 Group, overlaid on an SDSS r-band image created with Montage. The bottom and side panels show RA-velocity and Dec-velocity views of the group, with black vertical and horizontal bars indicate the ALFALFA velocity width at the 50% flux level for detected galaxies. A dashed thick black circle indicates the region imaged by Mundell et al. (1995), who report the detection of two H i plumes (labelled HINorth and HISouth in Figure 4) extending 51 and 116 kpc to the north and south of NGC 3227 in the center of the NGC 3227 group. However, the primary beam of the VLA at 1420 MHz (the effective field of view of the interferometer) is only 35′. Thus, while, the ALFALFA data confirm the plumes detected in the high resolution VLA maps, they find that the plumes extend far beyond the VLA primary beam to 10 and 40 arcminutes (73 and 291 kpc at 25 Mpc). They also reveal the presence of a previously unreported feature stretching 0.9 degrees to the NE (labelled HINE in Figure 4), distinct from the other plumes.
All three H i appendages appear to have no detectable stellar counterparts at the surface brightness limit of SDSS (25 mags asec-2); optically detected galaxies of known redshift (i.e. of m17.7) are indicated with open diamonds, color coded by their velocity to match the scale in Figure 1. While there are several reasonably bright optical sources in this region, none of them are clearly associated with the H i features.
4.1.1 The Southern H i Plume (HISouth)
The H i plume extending to the south of NGC 3227 shows excellent agreement with the Mundell et al. (1995) maps within the region imaged by the VLA. Both data sets show that the plume (which we will refer to as HISouth) rises steeply in velocity from 1200 km s-1 to 1300 km s-1 moving south away from NGC 3227. However, the feature extends 28′ beyond the region covered by the VLA, continuing to rise in velocity, and decrease in projected column density. 17′ from NGC3226/7, it bends west and begins to decrease in velocity from 1320 to 1270 km s-1. As shown in the PV panels in Figure 4, the end of the plume shows a marked increase in projected column density, and the velocity dispersion of the tail appears to decrease significantly moving south from NGC 3227. However, the significantly higher resolution WSRT observations of the end of the plume, shown in panels c and d of Figure 5, show a messy, extended distribution, inconsistent with any suggestion of a “dark" or tidal dwarf galaxy (TDG). Indeed, the higher column density emission traces the ALFALFA data well, and has clear elongated, tail like morphology. The column density peaks at 2.3 atoms cm-2 (for a beam of 14″ 47″), but there is no associated stellar emission at the detection limits of SDSS. There is a low surface brightness galaxy at 10h22m53.2s +19∘34′36″ without a measured redshift, but there is no associated H i in the higher resolution WSRT images. The bright elliptical galaxy at 10h22m37.7s +19∘23′49″ has a measured redshift of 11,792 km s-1.
We note that NGC 3213 is 22′ (160 kpc) from the end of HISouth, has a similar recessional velocity (see the RA-velocity plot in Figure 4), and appears to show some extended H i emission at low SNR; however, our data do not have the sensitivity to determine if it is related to this southern plume. Thus, the H i distribution mapped here is consistent with the properties of a tidal tail associated with the merging pair NGC 3226/7, but we cannot completely rule out the rather unlikely possibility that HISouth is instead an H i bridge.
4.1.2 The Northern H i Plume (HINorth)
The northern plume reported in Mundell et al. (1995) also is consistent with the ALFALFA data, but is blended with the emission from the TDG identified in Mundell et al. (2004) and NGC 3227, in Figure 4. While it appears to spatially connect with the northeastern feature (HINE, discussed below), the two tails are well separated in velocity space, as demonstrated in the PV diagrams in Figure 4. The northern structure increases in velocity from 1300 to 1400 km s-1, as one moves away from NGC 3226/7 to a projected linear separation of 15′ (compared with HINE (section 4.1.3), which approaches NGC 3226/7 at a recessional velocity of 1240 km s-1).
Appleton et al. (2014) use Spitzer IRAC observations together with the VLA H i data to connect this northern structure to the elliptical galaxy NGC 3226, suggesting that the gas is infalling onto NGC 3226. We note that it shows a significantly wider velocity dispersion (50 km s-1), and steeper velocity gradient than HISouth, and that there are suggestions of significant substructure at lower SNR. There are two blue, fuzzy galaxies of moderate magnitude (AGC 718681 with Mr = -17.3 and AGC 718673 with Mr = -16.1 at 25 Mpc) that fall within this plume’s H i contours, but both objects have recessional velocities that fall below that of the detected H i (1151 km s-1 and 1166 km s-1 respectively). The compact dwarf AGC 739353 near NGC 3226 has a recessional velocity of 1338 km s-1, somewhat higher than HINorth. Further modelling will be necessary to confirm the origins of this feature (and if, in fact it is a tidal tail, a tidal bridge, or something else).
a b
c d
4.1.3 The Northeastern Feature (HINE)
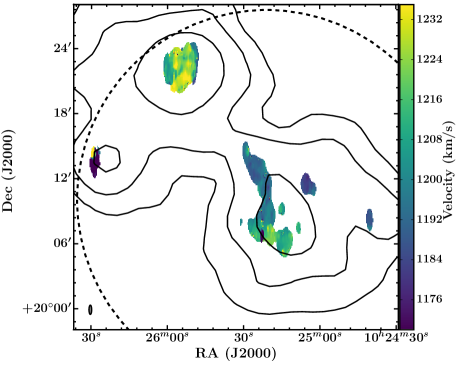
Figure 4 also shows a bright H i feature extending 0.9 degrees to the northeast of NGC 3226/7. The feature is somewhat more massive than HISouth, but has a clumpier gas distribution, higher velocity dispersion, and more complicated velocity field. The nature of the feature’s connection to NGC 3226/7 was not immediately clear, since it is not connected at the column density sensitivity of our data. However, emission detected at 2.5 in at least 3 neighbouring beams leads away from NGC 3226/7 at around 1230 km s-1 (most easily seen in the PV diagrams), forming a smooth arc with the rest of the NE tail. This feature shows two primary projected density peaks in the ALFALFA data, one roughly associated with the velocity minimum, and the other near the end of the tail. The WSRT observations, shown in Figure 5, resolve these peaks into several clumps, revealing complicated structure in the high column density emission. The SW clump appears messy with two or more density peaks, and the velocity field suggests it may contain significant substructure. Some of the emission extends in the NE-SW direction, while the emission at higher velocity is elongated in the EW direction. The NE structure appears as a single clump with a peak column density of 3.9 cm-2 in the WSRT data (assuming the flux fills the 13″41″ beam integrated over the width of the source), but does not appear to show coherent velocity structure.
The disordered morphology at high column density, and the smooth, correlated nature of the structures in the ALFALFA data point to a tidal connection between NGC3226/7 and this NE structure. However, detailed modelling will be required to understand the full history of this feature, which may be the product of several interactions within the group.
The entire structure shows no stellar emission in SDSS imaging. There are 3 optical galaxies with measured redshifts in the nearby vicinity. AGC 718719 is fairly small and blue, and appears in projection near NGC 3226/7. However, with a recessional velocity of 1028 km s-1 it appears to be unrelated to the details of the tail. AGC 718778 (vhelio=1163 km s-1) is a low surface brightness dwarf located near the northeastern end of the tail, and at a more similar velocity to the tail, but is still at a lower recessional velocity than the detected gas. UGC 5653 is an edge on spiral with a clear dust lane located in the vicinity, but to the south of HINE. While some of the emission from UGC 5653 is blended with HINE, its central recessional velocity is lower than bulk of the nearby emission from HINE (1170 km s-1 when separated from the other emission). It is possible that HINE is, in fact, a bridge between UGC 5653 and NGC 3227, however the WSRT observations do not indicate a clear connection between the H i in UGC 5653 and HINE, and the geometry seems rather unfavourable. Further, without measured primary distances, velocity crowding from infall requires that these sources be interpreted with caution since there is a small chance that they are simply projected to a similar region of phase space. However, we do note that the 6 objects detected without any H i in this subgroup (besides NGC 3226; listed in the bottom of Table 1) are all in close proximity to HINE or HINorth discussed above, and have somewhat similar optical colours and morphologies. All other objects brighter than mg=17.7 have detected H i in ALFALFA.
The moment 0 map also reveals suggestive tidal features at low SNR extending to the southwest of the NE plume toward the low surface brightness dwarf galaxy UGC 5675. However, deeper observations would be necessary to put this low SNR suggestion on firmer footing. Understanding the origins of the three main features detected here will require detailed dynamical modelling.
4.2 Extended Tails in the NGC 3190 Group
Located approximately 1 Mpc to the NW of the NGC 3227 group, the NGC 3190 group is the other primary overdensity in the NBG 21-6 region. Like the NGC 3227 group, the NGC 3190 group is know to exhibit extended H i without apparent associated stellar emission. Specifically, using a deep 6x12h pointing with WSRT, Serra et al. (2013) reported the detection of a large H i feature (which they refer to as the northern tail, TN) near the center of the group, extending 20′ (220 kpc) to the northwest of HCG 44, and optically dark down to = 28.5 mags asec-2 (in deep CFHT imaging). They further note the detection of HIPASS emission beyond the edge of the WSRT primary beam, which might extend the tail to 300 kpc, and the detection of a small cloud (CS) to the east of HCG 44 and the south of the main H i feature. They suggest that the large H i feature originated due to tidal stripping, and suggest that it may have originated from an interaction between NGC 3190 and NGC 3187, or from an interaction between NGC 3162 and the members of the compact group during a close flyby.
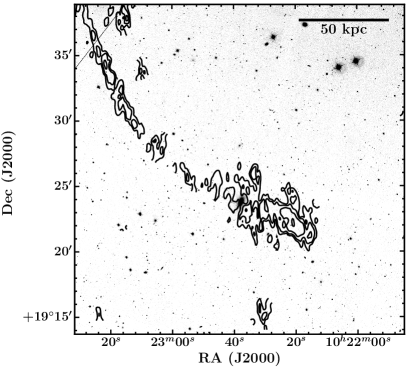
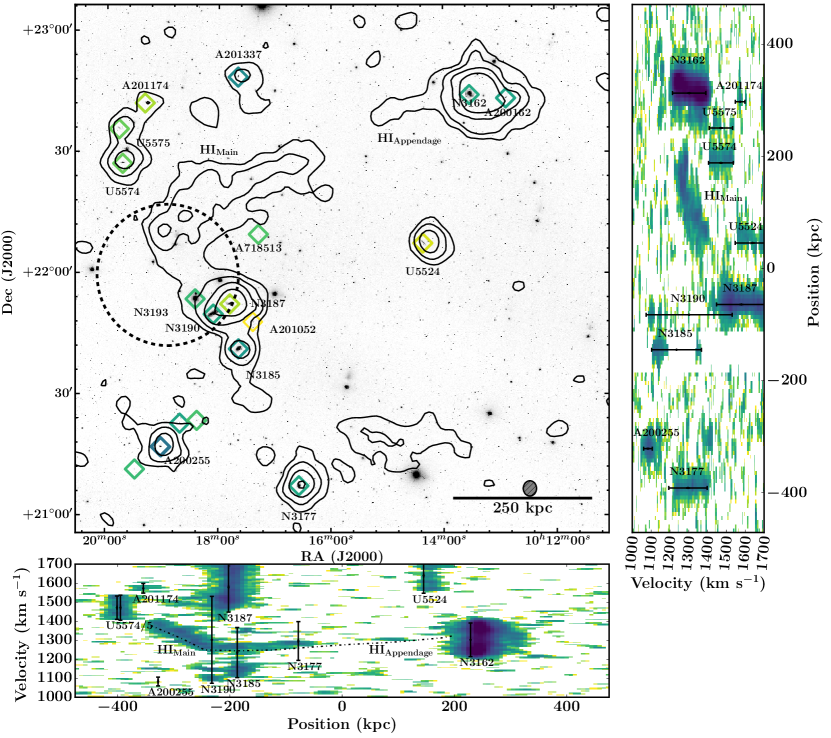
Like in the NGC 3227 group, ALFALFA finds that this previously detected H i feature extends to the group scale, well beyond the region previously studied, and finds evidence of additional extended H i structures. Figure 6 shows ALFALFA H i column density contours overlaid on a Montage SDSS g-band mosaic of the NGC 3190 group. The primary beam from Serra et al. (2013) is shown as a black dashed circle. The ALFALFA observations, which have an effective integration time of 40 seconds per beam, are sensitive to low column density structure across the entire group, and show that full extent of the primary H i structure. This feature, which we will refer to as HIMain hereafter, contains all of TN and the suggestive HIPASS emission, and more, covering 45′ (330 kpc) across the sky. The feature shows significant substructure, which is confirmed in a recent, deep pointing with KAT-7, and discussed in detail in Hess et al., submitted.
The ALFALFA data further show a low column density extension stretching SE from NGC 3162 in the direction of HIMain. This appendage (HIAppendage) is relatively low signal to noise, but is detected at 2.5 in 6 contiguous beams, and has a narrow (W50=31 km s-1), but coherent structure in velocity space. Moreover, it is not simply a sidelobe of NGC 3162, since it extends 30′ from the center of NGC 3162 (the peak of the first ALFA sidelobe is at 5′). The emission from the NGC 3162 extension does not connect directly to HIMain at the sensitivity of the ALFALFA data, however, Figure 6 demonstrates that they are well aligned both spatially and in velocity space, strongly suggesting that HIMain is, in fact connected to NGC 3162. The apparent connection of the H i features means that the entire structure is nearly 1.4 degrees (610 kpc) long.
Several other weaker pieces of evidence fit with the interpretation that HIMain is associated with NGC 3162. The mass budget, presented below in section 4.3, argues for the reality of the connection to NGC 3162, since the tail contains 20% of the H i mass of NGC 3162, but at least 40% of the H i mass of any of the sources in HCG 44. Additionally, NGC 3162 shows some sign of the presence of a forward tail encompassing the smaller spiral AGC 200162, and the gas in the full H i structure appears to spread out spatially as it moves away from NGC 3162, possibly consistent with gas spreading as a function of time after leaving NGC 3162. However, we note that the velocity dispersion smoothly increases from 20 km s-1 to 60 km s-1 moving away from NGC 3162, which seems to suggest energy input from HCG 44.
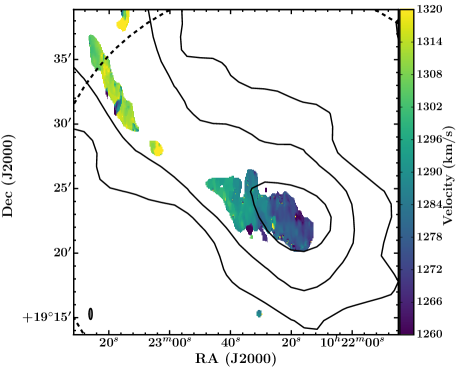
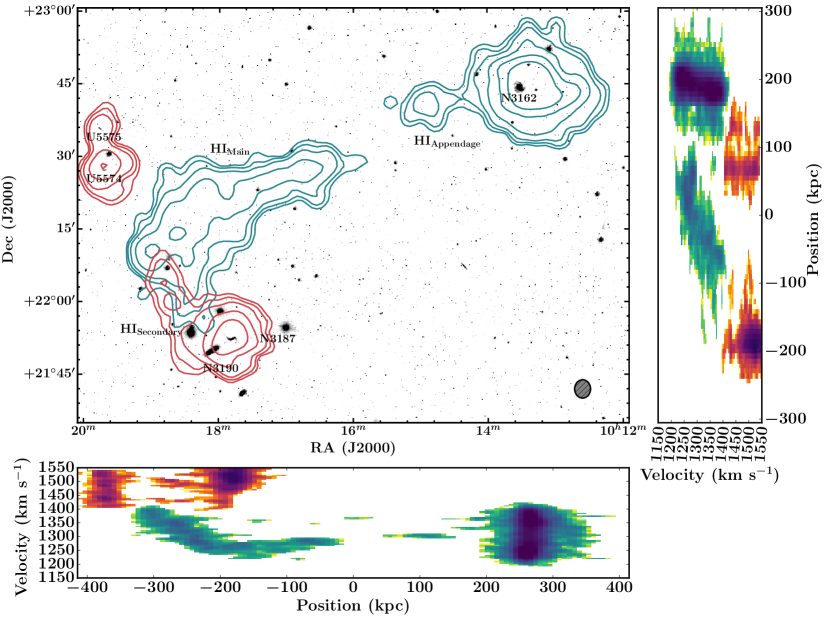
Indeed, since HIMain lies within the disk velocities of both NGC 3162 and NGC 3190, it is reasonable to assume that the feature is related to both sources. However, The connection between the giant H i feature and the galaxies of HCG 44 is less clear. The moment 0 contours in Figure 6 show a low column density bridge between the brightest parts of the tail and HCG 44. However, when examined in velocity space, the ALFALFA data hint that the extended H i may be composed of at least two superimposed kinematic features. Figure 7 presents the region surrounding HIMain, masked to contain just the emission clearly associated with the extended H i structures. The blue-green contours show the H i emission associated with HIMain and HIAppendage demonstrating that together they extend nearly continuously from NGC 3162 toward a point 20′ north of HCG 44, bending through velocity space from 1300 km s-1 near NGC 3162 down to 1250 km s-1, and then receding to 1400 km s-1. Near the SE end of HIMain the H i appears to reach south from the main feature toward NGC 3190, potentially suggesting a connection between HIMain and the compact group. However, combination of the ALFALFA data with the WSRT data from Serra et al. (2013) and with recently obtained KAT-7 data (Hess et al., submitted) shows no strong evidence that HIMain is connected to HCG 44 in the deeper cube.
The red contours in Figure 7 show H i emission summed over velocities above 1400 km s-1. These reveal a potential second, low column density, low signal to noise structure, hereafter HISecondary, visible at higher velocities (1500 km s-1). The structure extends east from NGC 3187 to encompass the cloud dubbed CS in Serra et al. (2013), and then north toward UGC 5574, UGC 5575, and AGC 201174, at matching recessional velocities. This suggestion, however, is tentative, since the structure is detected at low significance (the significance of this structure in Figure 7 is potentially exaggerated by the superposition of signal from multiple low significance features). The combined ALFALFA, WSRT, and KAT-7 data (Hess et al., submitted) also shows a compact H i cloud at the location of the northern peak in the red contours in Figure 7, but do not show clear emission connecting it to CS or NGC 3187. Thus, much of the extent of this structure is likely a result of beam smearing and artefacts in the ALFALFA data.
Figure 6 also shows the apparent detection of an extended feature around 10h15m +21∘20′. Analysis of the ALFALFA spectrum at this position shows significant baseline fluctuations, consistent with low level RFI not masked by our other algorithms. Similarly, Figure 6 also shows the suggestion of a southern extension off NGC 3185, however, this extension is in the region of the cube with low weights due to significant RFI. Thus, further observations of these regions will be necessary to know if there is any real H i emission to the south and southeast of HCG 44.
4.3 The H i mass budget in the NGC 3190 and NGC 3227 intragroup medium
The extended features in both the NGC 3190 and NGC 3227 groups contain a significant fraction of the total H i in the group. Tables 1 and 2 list the fluxes and H i masses for all sources detected by ALFALFA in the NGC 3227 and NGC 3190 groups respectively, assuming a common distance of 25 Mpc (note that under this assumption, the NGC 3190 group contains 1.5 the H i mass of NGC 3227 group). Column 10 gives the full breakdown of H i in each group, listing the percentage of H i in each feature relative to the sum of each subgroup. The dark plumes in the NGC 3227 group (HINorth, HISouth, and HINE) have a combined log H i mass of 9.47, 40% of the total H i in the group, and 53% of the gas associated with NGC 3226/7. Only slightly less massive, HIMain in the NGC 3190 group has a log H i mass of 9.05, making up 10% of the total group H i mass. However, 40% of the H i mass of the NGC 3190 group is contained in NGC 3162; HIMain is nearly 30% of the combined H i mass of the galaxies in HCG 44. For comparison, the Leo Ring makes up 24% of the in the M96 group, and tidal plumes in the Leo Triplet constitute 14% of the H i mass in the M66 group (Stierwalt et al., 2009).
Comparisons to synthesis imaging can give a sense of the amount of low surface density gas in these intragroup features, but direct comparison is difficult due to significant differences in the data and the subsequent analysis. Tables 1 and 2 give synthesis measurements where available. WSRT observations recover 94% of the flux in HINE, and 74% of the flux in HISouth in the NGC 3227 group. However, the large extent of the dark H i features necessitates large primary beam corrections for the portions of the sources near the edge of the beam, which means these results should not be over interpreted. For example, WSRT measures the flux of HISouth to be 5.10.2 Jy km s-1. However, if one only measures the flux outside the Mundell et al. (1995) observation, and combines it with the Mundell et al. (1995) VLA flux of 2.42 Jy km s-1, the summed synthesis observations give a flux of 6.0 Jy km s-1. It is also worth noting that Mundell et al. (1995) measured a larger flux for HINorth than ALFALFA. However, the flux for HINorth is significantly blended with that of NGC 3227 in the ALFALFA data, so the artificially low flux of HINorth is likely due to conservative deblending. A reasonable deduction from these data is that a significant portion of the flux in the NGC 3227 subgroup is coming from the higher column density gas detected in synthesis observations.
ALFALFA detects fluxes significantly higher than those reported from WSRT in Serra et al. (2013), with the WSRT observations recovering between 43% and 88% of the ALFALFA flux for galaxies in HCG 44. However, it is worth noting that the ALFALFA fluxes for NGC 3187 and NGC 3190 individually contain significant uncertainty, since their emission is blended in the ALFALFA cubes. It is also important to note that the flux of NGC 3185 is likely significantly affected by RFI, in spite of care during source parameter extraction to mitigate this effect. The range in recovered fluxes may suggest that HCG 44 is surrounded by significant lower column density gas.
Notably, ALFALFA detects the entirety of the H i tail reported in Serra et al. (2013), and is unaffected by beam attenuation. Serra et al. (2013) report a total tail log H i mass of 8.71 after including HIPASS emission detected in re-reduced cubes. ALFALFA measures a total log H i tail mass of 9.050.03, 2.2 higher than the WSRT+HIPASS measurement, significantly more than their stated typical flux uncertainties of 10-20%.
5 Discussion
The ALFALFA maps of the NBG 21-6 region underscore the need for sensitive, wide field surveys to obtain a complete understanding of ongoing galaxy evolution in groups. Specifically, the detection of H i tails and bridges on scales larger than the group virial radius suggests strong ties between the evolution of galaxies in this region, and their group environment. Here we discuss the regional context of the sources presented above as evidence of ongoing hierarchical galaxy assembly.
5.1 HCG 44 in the Context of the NGC 3190 Group
Previous studies of the H i in the NGC 3190 group have focused on understanding the evolutionary state of HCG 44 in the context of of other compact groups. Verdes-Montenegro et al. (2001) propose an evolutionary sequence where a compact group’s H i deficiency (Haynes et al., 1984) increases with time due to multiple tidal interactions, and find the the H i deficiency of the members of HCG 44 to be high relative to other compact groups.111Verdes-Montenegro et al. (2001) measure the H i deficiency of NGC 3185 and 3190 to be +1.0 (10% of the expected gas), and the H i deficiency of NGC 3187 to be +0.4 (40% of the expected gas). Serra et al. (2013) get values a factor of 2 more deficient using the relations of Toribio et al. (2011), but we note that this difference can be explained by a typo swapping radius and diameter in the Toribio et al. (2011) relations. Similarly, Borthakur et al. (2010) and Borthakur et al. (2015) use the Green Bank Telescope to find evidence of diffuse H i in compact groups, but find that most of the gas in a 180180 kpc (25′25′) region surrounding the central galaxies of HCG 44 originates in high column density, disk-like structures. However, the apparent connection between NGC 3162 and HCG 44 in the ALFALFA data suggests that HCG 44 is best understood in the context of the entire NGC 3190 group.
Using H i synthesis maps, Serra et al. (2013) propose that the large H i feature originated due to tidal stripping, and suggest two specific origins: 1) within the compact group due to an interaction between NGC 3190 and NGC 3187, or 2) from an interaction between NGC 3162 and the members of the compact group during a close flyby. In the context of the entire group, the ALFALFA data strongly favour the second hypothesis.
Serra et al. (2013) suggest that if the H i feature originated in HCG 44, it could at least partially explain the observed H i deficiency. However, NGC 3162 dominates the H i mass budget of the NGC 3190 group, with more than 150% of the H i mass contained in NGC 3185, NGC 3187, and NGC 3190 combined. While a highly disruptive event could remove 50% of the gas from e.g., NGC 3187, tidal forces should more easily remove 20% of the gas from the outskirts of an H i-rich source like NGC 3162. Moreover, even after including the entire mass of HIMain, HCG 44 is still H i deficient by more than a factor of six. This, suggests the members of HCG 44 were likely gas poor prior to an interaction with NGC 3162, which would make it even more difficult to remove the remaining, more tightly bound gas. Indeed, the potential detection of separate H i features like HISecondary is consistent with the idea that the group has experienced other tidal interactions. Thus, the group context suggests a scenario where the interaction with NGC 3162 is only one of the interactions responsible for the removal of gas from the members of HCG 44, and that NGC 3162 is the primary source of the gas in the H i feature, potentially delivered on a first infall to the group.
Further, the scale of the interactions surrounding HCG 44 suggests interesting questions for studies of other compact groups. Since not all tidal interactions favour the creation of massive tidal tails, the existence of a 600 kpc tail suggests that groups with less fortuitously aligned interactions on similar scales should exist. Studies like Walker et al. (2016) have found only weak correlations between the total H i in compact groups (as observed with GBT) and the properties of individual galaxies. However, the GBT has a 9′ beam per pointing, and thus may miss significant group flux. In the case of HCG 44 (log = 9.45), the entire compact group fits within just a couple of GBT beam pointings, but neither the large H i tail (log = 9.05) nor NGC 3162 (log = 9.65) would be detected.
Thus, future wide-field surveys will be important for understanding the regions surrounding compact groups. While HCG 44 may be an extreme example, it presents a cautionary note that a full understanding of compact group scaling relations will likely require careful consideration of the surrounding 1 Mpc via deep, wide field H i surveys.
5.2 Interactions in their Group Context
As discussed in section 4.1, the H i features in the NGC 3227 group suggest potential associations between NGC 3227 and other group members, including NGC 3213, UGC 5653, and the dwarf galaxies in close spatial proximity to the plumes. Similarly, the apparent connection between NGC 3162 and NGC 3190 makes it highly probable that they are at the same distance. In regions of the local universe with limited distance information, upcoming H i surveys will be an important tool for connecting sources with large distance uncertainties to those with primary distances. For example, a common way of determining group distances is to examine the Tully-Fisher relationship for the sources in the region (e.g. Figure 9 and the corresponding discussion in Section 5.3). However, stringent selection of galaxies for accurate distance determination (e.g. mostly edge on, similar Hubble types, etc.) often leaves too few sources for reliable distance determination, especially in compact groups where interactions may contribute to increased scatter in the relation. In these groups H i mapping coupled with stellar distance estimates from JWST will be an important source of reliable distances.
The potential tidal connection between sources separated by kpc has potential consequences for searches for tidal dwarf galaxies. Mundell et al. (2004) report a potential TDG candidate in close proximity to NGC 3226/7. While the plumes in the NGC 3227 group do not show clear evidence of TDGs further out at our current resolution, they do indicate that searches for tidal dwarf galaxies may require imaging at significant separations from their parent galaxies. For example, Lelli et al. (2015) analyse VLA observations of 6 merging systems containing TDGs at cz5000 km s-1. The edges of the extended H i emission in the NGC 3227 group would still extend just beyond the VLA primary beam if it were at D=70 Mpc (5000 km s-1). More, numerical simulations predict differing numbers of potential tidal substrates per system (e.g. Bournaud & Duc, 2006; Yang et al., 2014), so understanding the full scale of each interaction will be important in validating these predictions.
5.3 Hierarchical Structure Formation in the NBG 21-6 Region
The assembly of structures via mergers at all scales is a key prediction of hierarchical structure formation models. Thus, the discovery of two large tidal systems in relatively close proximity (1 Mpc) motivates an examination of the surrounding region as a potential example of galaxy evolution on multiple scales.
As discussed in section 2, the grouping of galaxies in the NBG 21-6 region depends on the scale used in the grouping algorithm. However, the histogram in Figure 2 suggests a potential connection between galaxies in the broader region. Figure 8 plots the recessional velocities from Figure 2 as a function of angular separation from the center of HCG 44 (HCG 44 was selected as the dynamical center since it has the largest velocity dispersion of the region). The narrow velocity structure (115 km s-1) over large angular scales suggests the region may be experiencing significant infall onto a larger, filamentary dark matter structure, though there are currently too few distance measurements to confirm this suggestion.
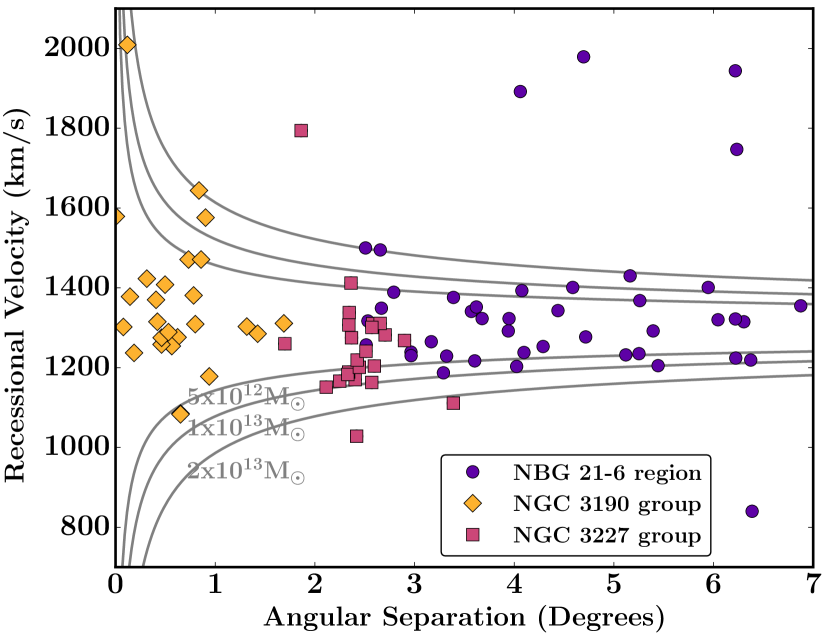
As a rough diagnostic tool, Figure 8 also shows simple caustic curves calculated using and assuming all sources are at a distance of 25 Mpc. The distribution of sources in the region approximately match the velocity distribution expected for a sources moving in a potential of M = 2. Given the assumption of uniform distance and that this system is likely far out of equilibrium, these curves are at best suggestive. However, simple calculations of the dynamical mass of the NGC 3190 and and NGC 3227 groups using the median mass calculation defined in Heisler et al. (1985) estimate masses of 8.5 and 3.3 respectively. We speculate that these estimates are consistent with a picture of the NGC 3190 and NGC 3227 groups as part of larger structure, falling toward the center of a larger common potential. Indeed, under the assumption that the two groups are moving toward each other, each with a velocity /( Mpc)) 200 km s-1, the two systems will merge in 3-4 Gyr.
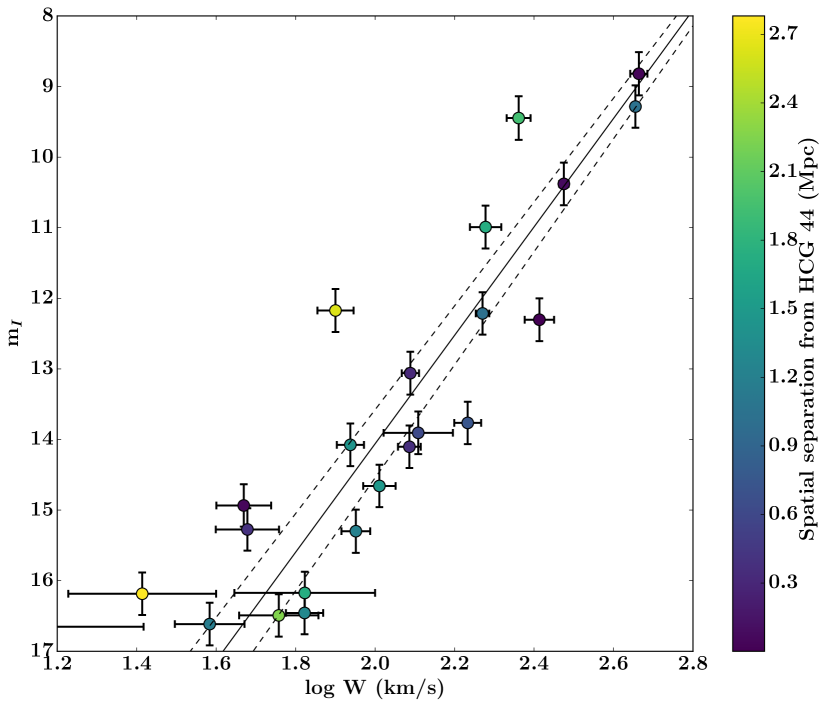
If all the galaxies in the region are actually part of the same structure and at a similar distance, we would expect them to follow the Tully-Fisher relation between their apparent magnitude and their H i velocity widths. Figure 9 shows the Tully-Fisher relation for sources contained within by the 2 caustics in this 6 Mpc diameter region. Optical magnitudes were taken from the NASA-Sloan Atlas111http://www.nsatlas.org/ where available, since the NSA compensates for significant shredding issues in the SDSS pipeline magnitudes. They were converted to I-band magnitudes using the Lupton (2005) relations from the SDSS website, and corrected for internal and galactic extinction following Giovanelli et al. (1997a). NSA inclinations were checked by eyeball measurements, and any sources with (b/a)NSA-(b/a) were removed. H i velocity widths from ALFALFA were converted to total widths following Giovanelli et al. (1997a), and all sources with i40 were removed from the sample. Assuming all sources are the same distance and follow the Tully-Fisher relation from Giovanelli et al. (1997a), we estimate the best fit distance to be 24.71.1 Mpc using a single parameter orthogonal distance regression fit to the data.
The black line shows the I-band Tully-Fisher relation and error budget from Giovanelli et al. (1997a) and Giovanelli et al. (1997b), for a distance of 25 Mpc. The scatter around the relation is consistent with all sources at the same distance for the small number of sources available. However, while this result is consistent with the interpretation of (almost) all of the sources in the region being at the same distance, the lack of sources makes it impossible to strongly differentiate between that and significant distance scatter, since a source with W = 160 km s-1 in the background by 5 Mpc, would only lie 1 off the relation. Thus, this calculation demonstrates the difficulty of using secondary relations to determine group distance. Significant source statistics to perform this kind of analysis will have to await next generation deep H i and optical surveys, and improved understanding of the faint end of the baryonic Tully Fisher relation.
The collective optical properties of galaxies in the NBG 21-6 region are consistent with expectations for galaxies experiencing significant large scale infall in a hierarchical formation model. Most of the sources in the NBG 21-6 region are dwarfs with a r-band absolute magnitude of Mr-18. Most sources in the region are H i rich (ALFALFA detects 73% of the galaxies with measured redshifts in NBG 21-6), and significantly bluer than the average SDSS population. Moreover, sources within the NGC 3190 and NGC 3227 groups may be slightly more processed than the other galaxies in the region. ALFALFA detects 81% of the 43 galaxies outside the two group, compared with 63% of the 36 galaxies inside the groups, while examination of the colour distribution hints of that galaxies in the two groups appear to be somewhat redder than the other sources in the region (though this result is only marginally significant: a KS test on the two colour distributions gives ). The largest galaxies near the centers of the NGC 3190 and NGC 3227 groups appear to be the reddest sources in the region, and indeed, Appleton et al. (2014) discuss the importance of the green valley colour of NGC 3226, demonstrating that the colour cannot be explained by a recent resurgence of star formation, but rather must result from quenching of fairly recent star formation.
These observations together paint an observational picture that mirrors recent simulations of group and cluster formation in a hierarchical context. HCG 44, which shows the largest velocity spread in the region (NGC 3185 and NGC 3187 are separated by 360 km s-1), sits at the bottom of a larger potential well, with the other members of NGC 3190 delivering gas as they fall in. The merging pair NGC 3226/3227 rests near the bottom of a smaller potential that is falling toward the NGC 3190 well. Currently out of equilibrium, the region will continue to group and virialize as it makes its journey toward the Virgo cluster.
The lack of primary distance information and the poorly populated nature of these groups cautions against over-interpretation of the current data, since without accurate distance measurements, the possibility remains that velocity crowding gives the appearance of connection between unrelated sources. Further, in a hierarchical model, it is possible that interactions play a significant role in increasing the velocity dispersion of the NGC 3190 and NGC 3227 groups, effecting mass estimates. However, this caution suggests important synergies between upcoming optical surveys (which can deliver more and better understood primary distance measurements), and upcoming sensitive, wide field H i surveys in understanding this fortuitously aligned group, and others like it.
6 Conclusions
In this paper we presented sensitive, wide-field H i imaging of the NBG 21-6 region of the Leo Cloud of galaxies, observed as part of the ALFALFA H i survey, and follow up imaging of several regions using WSRT. We detect intra-group plumes that each extend over 2 degrees (600 kpc), far beyond the primary beams of current synthesis telescopes. These features reveal interactions on larger scales than initially anticipated, providing an important tool for future modeling the recent history of these systems.
Specifically, the main conclusions of this paper are:
-
1.
The detection of multiple 300 kpc H i appendages in a 2x2 Mpc area of the sky mapped by ALFALFA. We find that the large gas tail to the north of HCG 44 detected in Serra et al. (2013) is likely associated with NGC 3162, as speculated by those authors, and find a tentative detection of a second, superimposed tail associated with NGC 3187 and UGC 5574. We additionally find the H i plumes in the NGC 3227 group presented in Mundell et al. (1995) extend far beyond the observed primary beam, and report the detection of a third, clumpier feature to the NE of the system, which displays a prominent kink in WSRT observations, suggestive of additional interactions.
-
2.
H i features without associated stellar counterparts make up a significant component of the group gas content in the groups considered here. The intra-group gas makes up 10% of the NGC 3190 group and 40% of the NGC 3227 group.
-
3.
The NGC 3190 group (containing HCG 44) and the NGC 3227 group may be part of a larger, dynamically young region experiencing active infall, and may merge in 3-4 Gyr. Examination of the broader group dynamics and optical colors suggests that its relatively local proximity and projection on the sky make the NBG 21-6 region an important laboratory for studying the role of ongoing galaxy interactions in the progression of group galaxies from the blue cloud to the red sequence.
Our observations emphasize the importance of wide-field, high sensitivity H i mapping. These massive, extended H i features were found in a region that had been extensively studied in H i; without the powerful combination of sensitivity, resolution, and field of view of ALFALFA we would not have been able to trace galaxy interactions in these large scales. Wide field, deep mapping with next generation H i detectors like the Square Kilometer Array Pathfinders (see Giovanelli & Haynes, 2016) will be necessary for a full understanding of galactic evolution in the group environment.
Acknowledgements
The authors acknowledge the work of the entire ALFALFA collaboration in observing, flagging, and extracting sources in this field. The ALFALFA team at Cornell is supported by NSF grants AST-0607007 and AST-1107390 to RG and MPH and by grants from the Brinson Foundation. EAKA is supported by TOP1EW.14.105, which is financed by the Netherlands Organisation for Scientific Research (NWO). The authors would like to thank the referee for useful comments that helped improve the quality of the paper. LL would like to thank Michael G. Jones and Gregory Hallenbeck for several useful discussions.
This research used data from the Sloan Digital Sky Survey, funded by the Alfred P. Sloan Foundation, the participating institutions, the National Science Foundation, the U.S. Department of Energy, the National Aeronautics and Space Administration, the Japanese Monbukagakusho, the Max Planck Society, and the Higher Education Funding Council for England.
The Westerbork Synthesis Radio Telescope is operated by the ASTRON (Netherlands Institute for Radio Astronomy) with support from the Netherlands Foundation for Scientific Research (NWO).
References
- Amanullah et al. (2010) Amanullah R., et al., 2010, ApJ, 716, 712
- Appleton et al. (2014) Appleton P. N., et al., 2014, ApJ, 797, 117
- Bekki & Couch (2011) Bekki K., Couch W. J., 2011, MNRAS, 415, 1783
- Blakeslee et al. (2001) Blakeslee J. P., Lucey J. R., Barris B. J., Hudson M. J., Tonry J. L., 2001, MNRAS, 327, 1004
- Borthakur et al. (2010) Borthakur S., Yun M. S., Verdes-Montenegro L., 2010, ApJ, 710, 385
- Borthakur et al. (2015) Borthakur S., Yun M. S., Verdes-Montenegro L., Heckman T. M., Zhu G., Braatz J. A., 2015, ApJ, 812, 78
- Bournaud & Duc (2006) Bournaud F., Duc P.-A., 2006, A&A, 456, 481
- Cannon et al. (2015) Cannon J. M., et al., 2015, AJ, 149, 72
- Garcia (1993) Garcia A. M., 1993, A&AS, 100, 47
- Geller & Huchra (1983) Geller M. J., Huchra J. P., 1983, ApJS, 52, 61
- Giovanelli & Haynes (2016) Giovanelli R., Haynes M. P., 2016, A&ARv, 24, 1
- Giovanelli et al. (1997a) Giovanelli R., Haynes M. P., Herter T., Vogt N. P., Wegner G., Salzer J. J., da Costa L. N., Freudling W., 1997a, AJ, 113, 22
- Giovanelli et al. (1997b) Giovanelli R., Haynes M. P., Herter T., Vogt N. P., da Costa L. N., Freudling W., Salzer J. J., Wegner G., 1997b, AJ, 113, 53
- Giovanelli et al. (1997c) Giovanelli R., Haynes M. P., da Costa L. N., Freudling W., Salzer J. J., Wegner G., 1997c, ApJ, 477, L1
- Giovanelli et al. (2005) Giovanelli R., et al., 2005, AJ, 130, 2598
- Haynes et al. (1984) Haynes M. P., Giovanelli R., Chincarini G. L., 1984, ARA&A, 22, 445
- Haynes et al. (2011) Haynes M. P., et al., 2011, AJ, 142, 170
- Heisler et al. (1985) Heisler J., Tremaine S., Bahcall J. N., 1985, ApJ, 298, 8
- Hess & Wilcots (2013) Hess K. M., Wilcots E. M., 2013, AJ, 146, 124
- Hibbard et al. (2001a) Hibbard J. E., van der Hulst J. M., Barnes J. E., Rich R. M., 2001a, AJ, 122, 2969
- Hibbard et al. (2001b) Hibbard J. E., van Gorkom J. H., Rupen M. P., Schiminovich D., 2001b, in Hibbard J. E., Rupen M., van Gorkom J. H., eds, Astronomical Society of the Pacific Conference Series Vol. 240, Gas and Galaxy Evolution. p. 657 (arXiv:astro-ph/0110667)
- Huchra & Geller (1982) Huchra J. P., Geller M. J., 1982, ApJ, 257, 423
- Janowiecki et al. (2015) Janowiecki S., et al., 2015, ApJ, 801, 96
- Jones et al. (2016) Jones M. G., Papastergis E., Haynes M. P., Giovanelli R., 2016, MNRAS,
- Karachentsev et al. (2015a) Karachentsev I. D., Nasonova O. G., Karachentseva V. E., 2015a, Astrophysical Bulletin, 70, 1
- Karachentsev et al. (2015b) Karachentsev I. D., Tully R. B., Makarova L. N., Makarov D. I., Rizzi L., 2015b, ApJ, 805, 144
- Lee-Waddell et al. (2012) Lee-Waddell K., Spekkens K., Haynes M. P., Stierwalt S., Chengalur J., Chandra P., Giovanelli R., 2012, MNRAS, 427, 2314
- Lee-Waddell et al. (2014) Lee-Waddell K., et al., 2014, MNRAS, 443, 3601
- Lelli et al. (2015) Lelli F., et al., 2015, A&A, 584, A113
- Makarov & Karachentsev (2011) Makarov D., Karachentsev I., 2011, MNRAS, 412, 2498
- Martin et al. (2009) Martin A. M., Giovanelli R., Haynes M. P., Saintonge A., Hoffman G. L., Kent B. R., Stierwalt S., 2009, ApJS, 183, 214
- Mould et al. (2000) Mould J. R., et al., 2000, ApJ, 529, 786
- Mundell et al. (1995) Mundell C. G., Pedlar A., Axon D. J., Meaburn J., Unger S. W., 1995, MNRAS, 277, 641
- Mundell et al. (2004) Mundell C. G., James P. A., Loiseau N., Schinnerer E., Forbes D. A., 2004, ApJ, 614, 648
- Postman & Geller (1984) Postman M., Geller M. J., 1984, ApJ, 281, 95
- Rand (1994) Rand R. J., 1994, A&A, 285
- Saintonge (2007) Saintonge A., 2007, AJ, 133, 2087
- Sancisi et al. (2008) Sancisi R., Fraternali F., Oosterloo T., van der Hulst T., 2008, A&ARv, 15, 189
- Sault et al. (1995) Sault R. J., Teuben P. J., Wright M. C. H., 1995, in Shaw R. A., Payne H. E., Hayes J. J. E., eds, Astronomical Society of the Pacific Conference Series Vol. 77, Astronomical Data Analysis Software and Systems IV. p. 433 (arXiv:astro-ph/0612759)
- Serra et al. (2012) Serra P., et al., 2012, MNRAS, 422, 1835
- Serra et al. (2013) Serra P., et al., 2013, MNRAS, 428, 370
- Serra et al. (2015) Serra P., et al., 2015, MNRAS, 452, 2680
- Shostak & Allen (1980) Shostak G. S., Allen R. J., 1980, A&A, 81, 167
- Stierwalt et al. (2009) Stierwalt S., Haynes M. P., Giovanelli R., Kent B. R., Martin A. M., Saintonge A., Karachentsev I. D., Karachentseva V. E., 2009, AJ, 138, 338
- Szabó et al. (2003) Szabó G. M., Sárneczky K., Vinkó J., Csák B., Mészáros S., Székely P., Bebesi Z., 2003, A&A, 408, 915
- Tago et al. (2008) Tago E., Einasto J., Saar E., Tempel E., Einasto M., Vennik J., Müller V., 2008, A&A, 479, 927
- Tonry et al. (2001) Tonry J. L., Dressler A., Blakeslee J. P., Ajhar E. A., Fletcher A. B., Luppino G. A., Metzger M. R., Moore C. B., 2001, ApJ, 546, 681
- Toribio et al. (2011) Toribio M. C., Solanes J. M., Giovanelli R., Haynes M. P., Martin A. M., 2011, ApJ, 732, 93
- Tully (1987) Tully R. B., 1987, ApJ, 321, 280
- Turner & Gott (1976) Turner E. L., Gott III J. R., 1976, ApJS, 32, 409
- Verdes-Montenegro et al. (2001) Verdes-Montenegro L., Yun M. S., Williams B. A., Huchtmeier W. K., Del Olmo A., Perea J., 2001, A&A, 377, 812
- Walker et al. (2016) Walker L. M., Johnson K. E., Gallagher S. C., Privon G. C., Kepley A. A., Whelan D. G., Desjardins T. D., Zabludoff A. I., 2016, AJ, 151, 30
- Wang et al. (2013) Wang J., et al., 2013, MNRAS, 433, 270
- Yang et al. (2014) Yang Y., Hammer F., Fouquet S., Flores H., Puech M., Pawlowski M. S., Kroupa P., 2014, MNRAS, 442, 2419
- Yoshii et al. (2014) Yoshii Y., Kobayashi Y., Minezaki T., Koshida S., Peterson B. A., 2014, ApJ, 784, L11
- Yun et al. (1994) Yun M. S., Ho P. T. P., Lo K. Y., 1994, Nature, 372, 530
| AGC | Name | Coordinates | c | W50 | Source | log | |||
| J2000 | km s-1 | km s-1 | Jy-km s-1 | Jy-km s-1 | % | ||||
| (1) | (2) | (3) | (4) | (5) | (6) | (7) | (8) | (9) | (10) |
| 5590∗ | NGC 3213 | 10:21:17.4+19:39:04 | 13471 | 1342 | 1.620.06 | 8.38 | 3.2 | ||
| 5620 | NGC 3227 | 10:23:30.5+19:51:53 | 11262 | 4123 | 17.520.10 | 14.5 | M95 | 9.41 | 35.0 |
| 5629∗ | 10:24:12.9+21:03:01 | 12381 | 1132 | 3.580.06 | 8.72 | 7.2 | |||
| 5653 | I610 | 10:26:28.3+20:13:42 | 11682 | 2964 | 1.640.06 | 8.38 | 3.3 | ||
| 5675 | M+327047 | 10:28:30.0+19:33:46 | 11061 | 832 | 4.550.06 | 8.83 | 9.1 | ||
| 202045† | D568-04 | 10:20:56.1+20:09:21 | 15572 | 734 | 1.310.04 | 8.29 | 2.6 | ||
| HINE | 10:25:37.4+20:20:34 | 12102 | 574 | 10.180.21 | 9.610.39 | L16 | 9.18 | 20.3 | |
| HINorth | 10:23:25.7+20:00:01 | 130533 | 13416 | 2.880.16 | 3.3 | M95 | 8.63 | 5.8 | |
| HISouth | 10:22:50.5+19:27:48 | 12925 | 495 | 6.770.21 | 5.120.2 | L16 | 9.00 | 13.5 | |
| NGC 3227 group total: | 9.87 | 1.0 | |||||||
| 5617 | NGC 3226 | 10:23:27.0+19:53:54 | 1275 | … | … | … | … | ||
| 718673 | 10:23:15.4+20:10:40 | 1151 | … | … | … | … | |||
| 718681 | 10:23:21.6+20:01:38 | 1166 | … | … | … | … | |||
| 718719 | 10:24:34.7+20:01:57 | 1028 | … | … | … | … | |||
| 718778 | 10:26:31.0+20:16:60 | 1163 | … | … | … | … | |||
| 739353 | 10:23:22.4+19:54:51 | 1338 | … | … | … | … | |||
| 739467 | 10:27:37.5+20:04:43 | 1268 | … | … | … | … | |||
| AGC | Name | Coordinates | c | W50 | Source | log | |||
| J2000 | km s-1 | km s-1 | Jy-km s-1 | Jy-km s-1 | % | ||||
| (1) | (2) | (3) | (4) | (5) | (6) | (7) | (8) | (9) | (10) |
| 5510 | NGC 3162 | 10:13:31.6+22:44:13 | 13021 | 1772 | 30.480.08 | 9.65 | 40.0 | ||
| 5524 | 123-027 | 10:14:21.8+22:07:28 | 16361 | 1802 | 2.730.07 | 8.60 | 3.6 | ||
| 5544 | NGC 3177 | 10:16:34.0+21:07:23 | 13102 | 1814 | 3.760.07 | 2.11 | S13 | 8.74 | 4.9 |
| 5554 | NGC 3185 | 10:17:38.6+21:41:16 | 12301 | 2532 | 3.580.08 | 8.72 | 4.7 | ||
| 5556 | NGC 3187 | 10:17:47.9+21:52:23 | 15862 | 2194 | 11.190.09 | 8.22 | S13 | 9.22 | 14.7 |
| 5559 | N3189/90111NGC 3190 is referred to as NGC 3189 in some papers. According to Serra et al. (2013), NGC3189 is the southeast component of NGC 3190. | 10:18:05.5+21:49:51 | 13104 | 4637 | 4.530.12 | 4.0 | S13 | 8.82 | 5.9 |
| 5574 | M+425001 | 10:19:43.0+22:27:06 | 14625 | 13010 | 2.300.08 | 8.53 | 3.0 | ||
| 5575 | 10:19:46.9+22:35:39 | 14713 | 1235 | 1.280.07 | 0.84 | S13 | 8.28 | 1.7 | |
| 200162 | 123-024 | 10:12:52.5+22:43:21 | 128511 | 12823 | 1.480.07 | 8.34 | 1.9 | ||
| 200255∗ | 124-001 | 10:19:01.5+21:17:01 | 10833 | 506 | 2.650.06 | 8.59 | 3.5 | ||
| 201052† | 10:17:23.3+21:47:58 | 19431 | 423 | 2.380.06 | 1.03 | S13 | 8.55 | 3.1 | |
| 201174 | F500-4 | 10:19:19.2+22:42:05 | 15733 | 516 | 0.570.06 | 7.92 | 0.7 | ||
| 201337 | 123-035 | 10:17:39.5+22:48:35 | 11783 | 1837 | 1.200.08 | 8.25 | 1.6 | ||
| 202134 | Wa5 | 10:10:32.8+22:00:40 | 128012 | 7925 | 0.370.06 | 7.74 | 0.5 | ||
| HIMain | TN | 10:18:05.4+22:31:27 | 13025 | 1153 | 7.660.43 | 2.79 | S13 | 9.05 | 10.1 |
| NGC 3190 group total: | 10.05 | 1.0 | |||||||
| 5562 | NGC 3193 | 10:18:24.9+21:53:36 | 1378 | … | … | … | … | ||
| 208748 | 124-001b | 10:19:00.8+21:16:55 | 1085 | … | … | … | … | ||
| 208761 | 10:19:28.6+21:11:24 | 1381 | … | … | … | … | |||
| 718513 | 10:17:17.6+22:09:39 | 1423 | … | … | … | … | |||
| 718530 | 10:18:22.8+21:23:31 | 1408 | … | … | … | … | |||
| 718531 | 10:18:40.9+21:22:49 | 1289 | … | … | … | … | |||