Hard X-ray variability of V404 Cyg during the 2015 outburst††thanks: Based on observations with INTEGRAL, an ESA project with instruments and science data centre funded by ESA member states (especially the PI countries: Denmark, France, Germany, Italy, Switzerland, Spain) and with the participation of Russia and the USA.
Abstract
Aims. Hard X-ray spectra of black hole binaries (BHB) are produced by Comptonization of soft seed photons by hot electrons near the black hole. The slope of the resulting energy spectra is governed by two main parameters: the electron temperature () and the optical depth () of the emitting plasma. Given the extreme brightness of V404 Cyg during the 2015 outburst, we aim to constrain the source spectral properties using an unprecedented time resolution in hard X-rays, and to monitor the evolution of and over the outburst.
Methods. We have extracted and analyzed 602 X-ray spectra of V404 Cyg obtained by the IBIS/ISGRI instrument on-board INTEGRAL during the 2015 June outburst, using effective integration times ranging between 8 and 176000 seconds. We have fit the resulting spectra in the 20–200 keV energy range.
Results. We find that while the light curve and soft X-ray spectra of V404 Cyg are remarkably different from those of other BHBs, the spectral evolution of V404 Cyg in hard X-rays and the relations between the spectral parameters are consistent with those observed in other BHBs. We identify a hard branch where the is anti-correlated with the hard X-ray flux, and a soft flaring branch where the relation reverses. In addition, we find that during long X-ray plateaus detected at intermediate fluxes, the thermal Comptonization models fail to describe the spectra. However, the statistics improve if we allow to vary freely in the fits to these spectra.
Conclusions. We conclude that the hard branch in V404 Cyg is analogous to the canonical hard state of BHBs. V404 Cyg never seems to enter the canonical soft state, although the soft flaring branch bears resemblance to the BHB intermediate state and ultra-luminous state. The X-ray plateaus are likely the result of absorption by a Compton-thick outflow () which reduces the observed flux by a factor of about 10. Variable covering of the central source by this Compton-thick material may be the reason for the complicated light curve variability, rather than intrinsic source variability.
Key Words.:
Accretion, accretion disks – Black hole physics – X-rays: binaries – X-rays: individuals: V404 Cyg1 Introduction
Black hole (BH) binary systems (BHBs) can go through various spectral states which are thought to be caused by changes in the accretion geometry and accretion rates close to the BH, although the actual details still remain debated (Remillard & McClintock, 2006; Belloni & Motta, 2016).
The two most common states are the hard and the soft states (see, e.g., Done et al. 2007; Poutanen & Veledina 2014 for review).
In the hard state, the spectrum can be described by a power-law with a variable cut-off energy around 60-150 keV, which is thought to result from Comptonization of soft seed photons by a population of hot electrons located in an optically thin region close to the BH (Shapiro et al., 1976; Narayan & Yi, 1995). The high energy cut-off suggests a thermal distribution of electrons, with temperatures in the range 30–100 keV (Sunyaev & Truemper, 1979; Gierliński et al., 1999). Occasionally, a hard excess has been observed above 100 keV suggesting the presence of non-thermal electrons as well (see e.g., McConnell et al. 2002; Wardziński et al. 2002; Joinet et al. 2007; Droulans et al. 2010), either in the corona/hot flow or in the base of the jet (e.g., Zdziarski et al. 2012).
In the soft state, thermal emission peaking at 1 keV, from a cool, optically thick, geometrically thin accretion disk, dominates the spectrum (Shakura & Sunyaev, 1973; Esin et al., 1997). A weak, hard X-ray tail extending up to the MeV range, is also detected (Zdziarski et al., 2016). This tail is thought to originate from Comptonized emission by non-thermal electrons in discrete flares on top of the accretion disc (McConnell et al., 2002).
During transitions between the hard and soft states, BHBs pass through additional intermediate states, which show characteristic features of both (see e.g. Ebisawa et al. 1994; Malzac et al. 2006; Belloni & Motta 2016).
On rare occasions, some systems may pass also through the so-called ultra-luminous state (Motta et al., 2012), also called very high state or anomalous state,
an intermediate state characterized by both a strong thermal component and a very strong and steep hard X-ray tail (Done et al., 2007).
One of the current observational challenges in this context is to determine the electron temperature, , and optical depth, , of the Comptonizing medium. These together determine the spectral slope of the Comptonized spectrum (e.g. Beloborodov 1999).
Because the cut-off energies are found around 100 keV, where usually the instrumental response is low,
observations sensitive enough to constrain these parameters have only been available for a few sources and typically require long exposures.
Observations in the hard state of GRO J0422+32 (Esin et al., 1998), GX 339–4 (Wardziński et al., 2002; Motta et al., 2009), XTE J1550–564 (Rodriguez et al., 2003), Cyg X-1 (Del Santo et al., 2013) and Swift J1753.5–0127 (Kajava et al., 2016) show an anti-correlation between the electron temperature, (or high energy cut-off) and the X-ray flux, accompanied by
a correlation between the plasma optical depth, , and the X-ray flux (Wardziński et al., 2002).
These relations reverse during the hard to soft state transitions. Observations of these transitions in Cyg X-1 (Phlips et al., 1996; Del Santo et al., 2013), GRO J1719–24 (Esin et al., 1998), GRO J1655–40 (Joinet et al., 2008) and GX 339–4 (Motta et al., 2009) show an increasing with increasing flux, while the optical depth decreases (Joinet et al., 2008; Del Santo et al., 2013). The cut-off is significantly present during the hard and intermediate states, and it disappears when the source reaches the soft state.
The extremely bright outburst of V404 Cyg in June 2015 provides a unique data set to perform high time resolved spectroscopy in high energies and study in detail the evolution of the parameters describing the Comptonizing plasma. We present here the results of spectral analysis of IBIS/ISGRI data in the 20–200 keV energy range over the period 18–28 June 2015, when the source was brightest.
V404 Cyg is a transient Low-Mass X-ray Binary (LMXB) consisting of a BH accreting mass from a K3 III companion (Khargharia et al., 2010) in a 6.5 d orbit (Casares et al., 1992). It is located at a distance kpc (Miller-Jones et al., 2009). V404 Cyg was first detected in optical wavelengths during two outbursts in 1938 and 1956 (Richter, 1989) and later in X-rays during a third outburst in 1989 (Makino, 1989; Marsden, 1989). The 1989 outburst was characterized by extreme flaring activity, several flux levels above the Crab (Tanaka, 1989; Oosterbroek et al., 1996). After 26 years in quiescence, the onset of a new outburst was detected by Swift/BAT, MAXI and Fermi/GBM on 15 June 2015 (Barthelmy & Sbarufatti, 2015; Negoro et al., 2015; Younes, 2015). This outburst, which triggered the most intensive multi-wavelength observing campaign performed so far on a transient BHB, lasted until early-August 2015 (Sivakoff et al., 2015). During the first ten days, the source exhibited violent flaring activity on time scales of sub-seconds to hours in all wavelengths: -rays (Loh et al., 2016); X-rays (Rodriguez et al. 2015; Roques et al. 2015; Jenke et al. 2016; Walton et al. 2016); optical (Gandhi et al., 2016; Kimura et al., 2016; Muñoz-Darias et al., 2016); infrared (Eikenberry et al., 2016); millimeter/sub-millimeter and radio (Tetarenko et al., 2015). In some major flares, V404 Cyg reached fluxes around 50 and 40 Crab in soft and hard X-rays, respectively (Segreto et al., 2015; Rodriguez et al., 2015). The peak of the outburst was reached on June 26th, and the flux dropped immediately afterwards (Ferrigno et al., 2015; Walton et al., 2015) slowly fading to quiescence over the subsequent weeks (Sivakoff et al., 2015).
 |
 |
 |
2 Observations and data analysis
V404 Cyg was observed by INTEGRAL, the INTErnational Gamma-Ray Astrophysics Laboratory (Winkler et al., 2003) in a series of Target of Opportunity observations scheduled between 17 June, 2015 and 13 July, 2015 (MJD 57556–57582; revolutions 1554–1563; Kuulkers 2015). We present here the analysis of the available IBIS/ISGRI data (Lebrun et al., 2003), obtained during revolutions 1554–1558 (18–28 June, 2015; MJD 57191–51201), which cover the epoch of intense flaring activity and the beginning of the outburst decay. These observations provide data sensitive enough to study in detail the properties of the Comptonizing medium.
2.1 Data reduction
The IBIS/ISGRI data reduction was performed using the Off-line Scientific Analysis software (OSA; Courvoisier et al. 2003) v10.2, using the latest calibration files. The data were processed following standard IBIS/ISGRI reduction procedures.
The spectral extraction was performed using good time interval files (GTIs) of variable duration, defined to provide source spectra of comparable S/N regardless of the source flux. The GTI selection was based on the source light curves distributed by the INTEGRAL Science Data Center (ISDC; Kuulkers 2015). The GTIs were defined sequentially, and their start/end times were selected such that during each time interval 4105 counts were accumulated in the IBIS/ISGRI 25–60 keV band. This GTI selection was found to be an optimal compromise between time resolution and the ability to constrain the values, particularly for the softer spectra in the sample. Using this strategy, we extracted 602 spectra, with effective exposure times in the range 8 to 176000 s. We binned the IBIS/ISGRI response matrix in the energy range 20–500 keV using 28 channels of variable logarithmic widths. To remove potential background contamination, and the contribution of additional spectral components above 200 keV, like hard non-thermal tails (Rodriguez et al., 2015; Roques et al., 2015) or hard X-ray emission caused by positron annihilation (Siegert et al., 2016), we restricted the spectral fits to the 20–200 keV energy range. In our fits we have ignored the energy bin around 50 keV due to calibration uncertainties and added 3 per cent systematic errors to the spectral bins. The IBIS/ISGRI X-ray spectra were fit using xspec v12.8.2 (Arnaud, 1996), adopting the statistics. Errors provided below are quoted at the 1- confidence level ( for one parameter of interest).
2.2 Spectral modelling
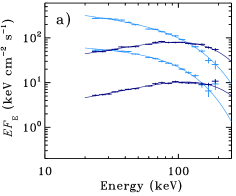
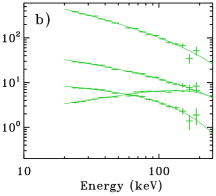
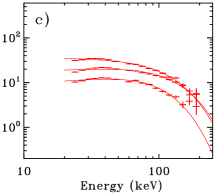
We show in Fig. 1 a sample of the IBIS/ISGRI spectra of V404 Cyg analysed in this work. In most occasions, the spectra have a powerlaw-like shape, modified by a cut-off at high energies, consistent with a thermal Comptonization spectrum (see Fig. 1a). Therefore, we have used Comptonization models to fit our data: nthcomp (Zdziarski et al., 1996; Życki et al., 1999) and compps (Poutanen & Svensson, 1996). These models provide a description of the continuum produced by thermal Compton up-scattering of soft X-ray photons. nthcomp is parameterized by a power law index , and an electron temperature . The compps parameters are the electron temperature and optical depth . Although a thermal component was never detected during the June 2015 outburst (Motta et al. in preparation), in our fits we fixed the seed photon temperature = 0.1 keV, as fits by Motta et al. (2016) to the source spectra over the 0.6–200 keV energy range, using Comptonization models are consistent with this value.
In some cases, a high-energy cutoff is either weakly significant or not statistically required by the data (see figure 1b). These spectra can still be fit using Comptonization models, but fixing to an arbitrary high value ( = 999 keV). To account for both possibilities, we carried out two independent fitting runs per model. In the first fitting run, we fit every spectrum leaving as a free parameter, while in the second fitting run we fixed it to = 999 keV. Then, the Bayesian information criterion (BIC; Schwarz 1978) was independently applied to the results obtained for every spectrum, in order to select the best fit to the data. We computed the BIC using the following approximation: BIC = , where is the number of parameters in the model, and is the number of channels in the spectral fits. In a model selection process, the optimal model is identified by the minimum value of BIC. A lower BIC implies either fewer explanatory variables, a better fit, or both. Kass (1995) set the strength of the evidence against the model with the higher BIC to be strong if BIC6, which we adopted as the limit for model selection. This approach was applied to the nthcomp and compps fits. The results of this analysis are described in Sections 3.1–3.3, and displayed in figures 2–8. In these figures the data are presented according to the following color convention:
- Blue points are used to highlight those fits where the BIC model selection favored a Comptonization model with a constrained electron temperature , further divided in two groups: ’hard spectra’ ( 1.7; dark blue) and ’soft spectra’ ( 1.7; light blue). Some of these spectra are shown in Fig. 1a. The latter classification is based on the values derived from the nthcomp fits, and then applied to the compps fits.
- Green points correspond to those spectra where could not be constrained by our fits (i.e. fixed at 999 keV). Some of these spectra are shown in Fig. 1b.
- Additionally, we computed the corresponding –value of the fit with respect to the data for every fit. We mark the spectra where with red symbols. Some of these spectra are shown in Fig. 1c.
To improve the fits to the latter group of spectra, we also explored the possibility that these were affected by heavy absorption. The results of these additional fits are presented in Sect. 3.4
3 Results
3.1 Parameter evolution
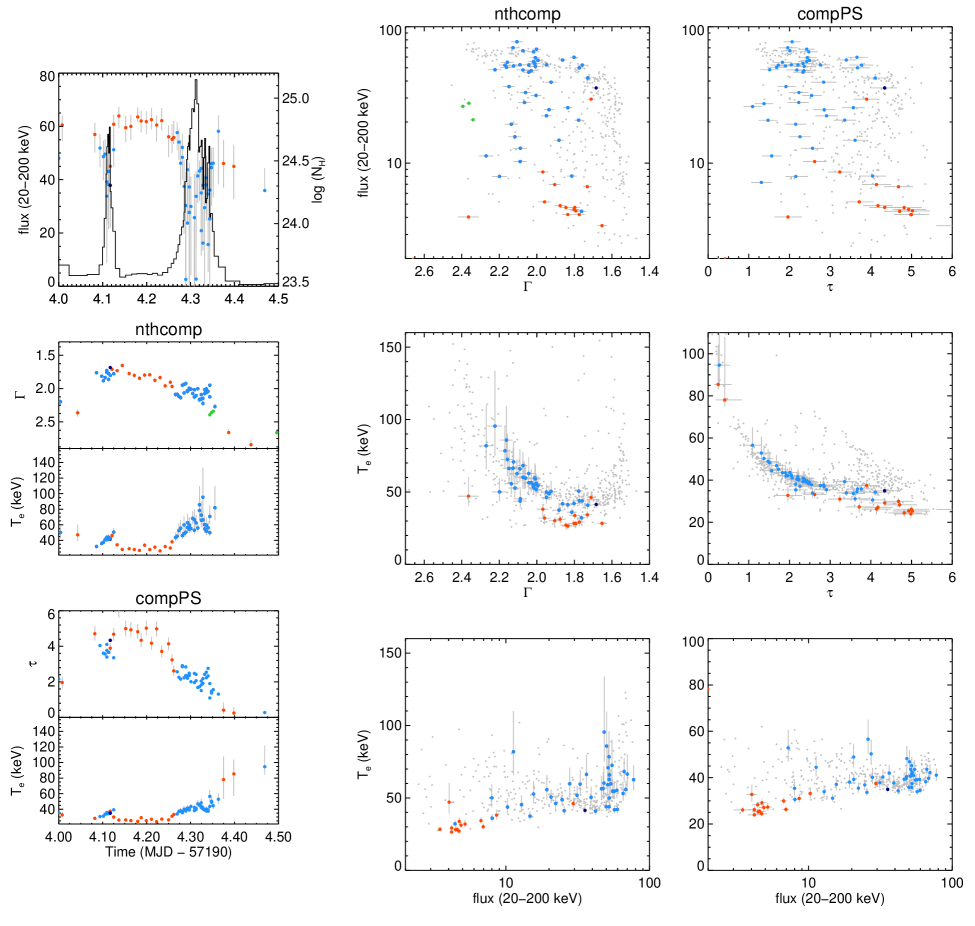
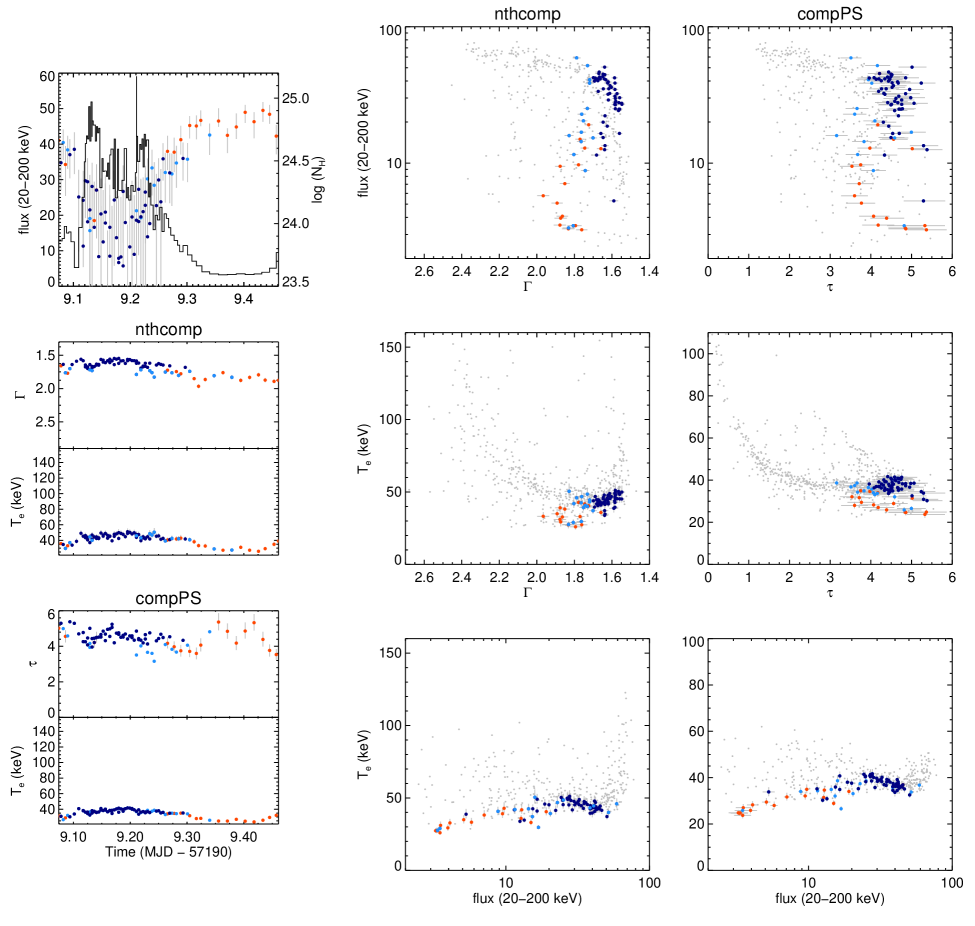
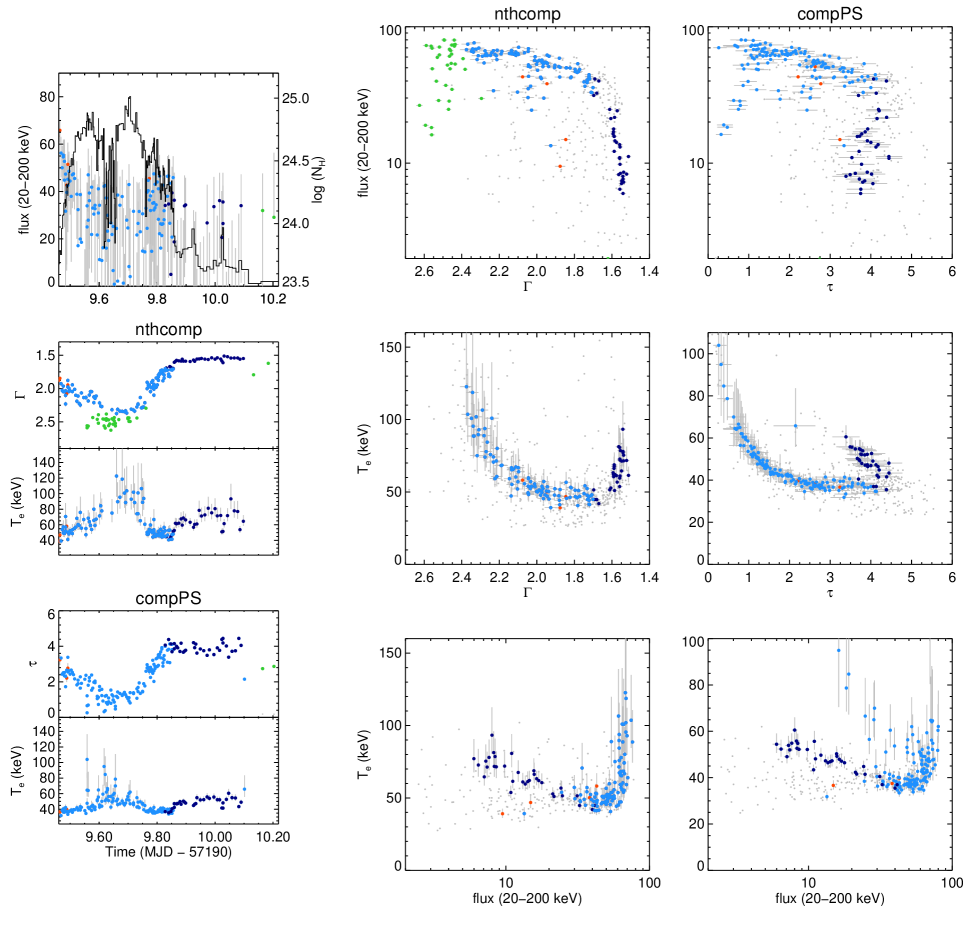
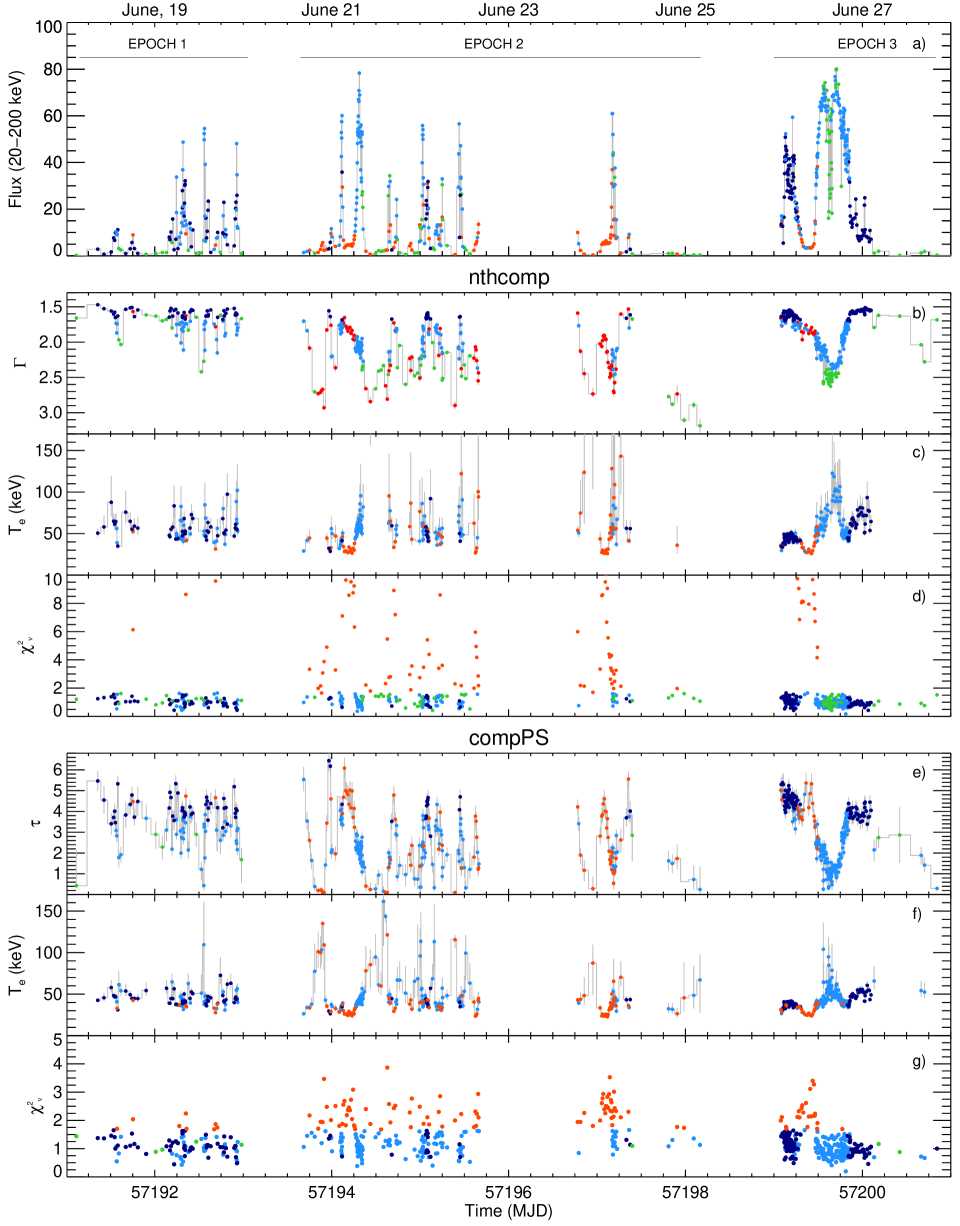
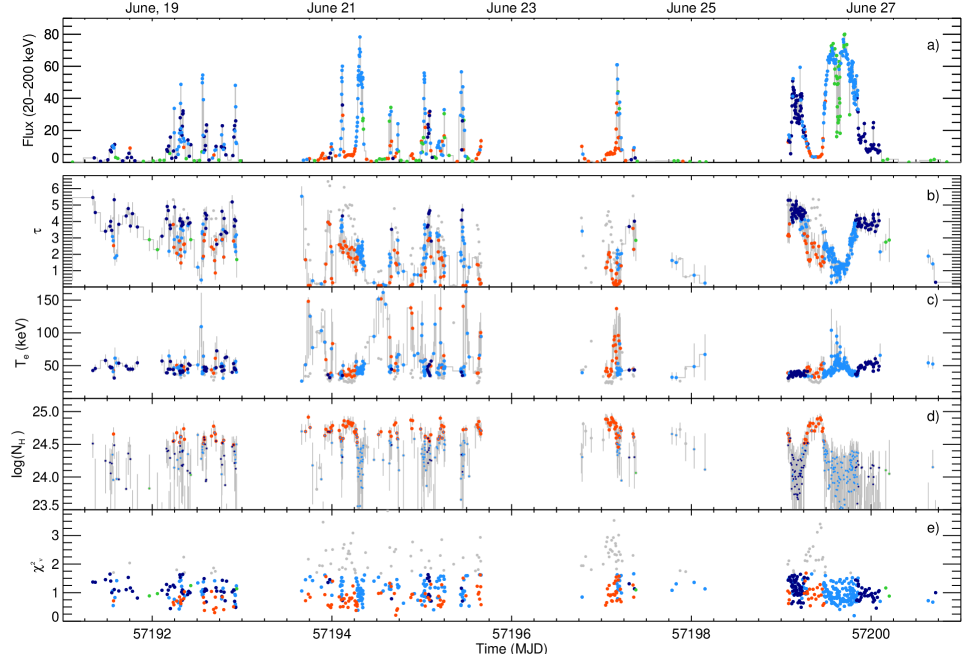
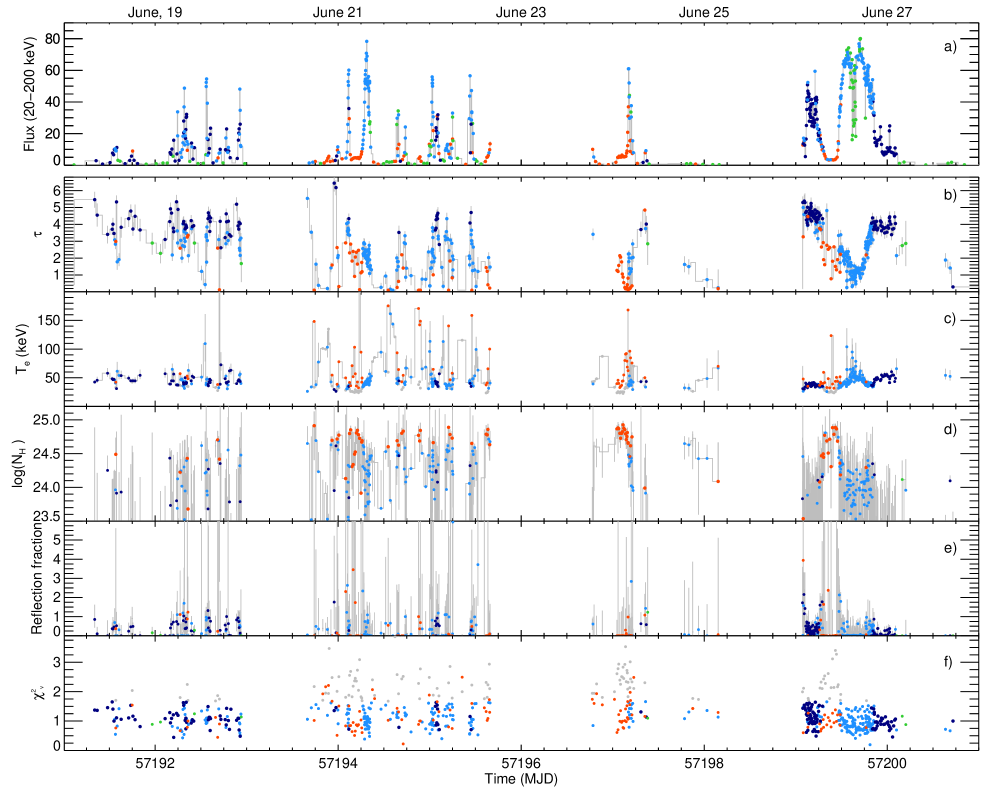
We present in Fig. 2 the time evolution of the source flux computed in the 20–200 keV energy range, together with the evolution of the spectral parameters derived using nthcomp (, ) and compps (, ) and the corresponding values.
Hereafter we will refer to the flux in the 20–200 keV energy range as .
3.1.1 epoch 1: Flaring activity
During the period MJD 57191–57193 (Rev. 1554; epoch 1 in Fig. 2a) intense flaring activity was detected on timescales of minutes to hours. The flares reached peak fluxes of 55 10-8 erg cm-2 s-1, while between flares we measure fluxes below erg cm-2 s-1. Over this period, the source spectrum was hard (), and only softened when increased above 25 10-8 erg cm-2 s-1 (i.e. during the peaks of the flares). is well constrained during the X-ray flares, with values in the range 30–100 keV (nthcomp) or 30–70 keV (compps). Between flares cannot be constrained in our spectral fits, and the X-ray spectrum is consistent with a hard power-law () with no cut-off (see Fig. 1b). Similar results were obtained by Natalucci et al. (2015), who analyzed this data set using a different time resolution, and Roques et al. (2015), who analyzed contemporaneous INTEGRAL/SPI data.
In epoch 1 varied between 2 and 5. It displayed higher values ( 3.5) when the spectrum was hard (), and decreased ( 3.5) as the spectrum softened (; see Fig. 2d).
3.1.2 epoch 2: Spectral softening, state transitions, and X-ray plateaus
During the intervals MJD 57193.5–57195.5 and MJD 57196.7– 57197.4 (Rev. 1555–1556; epoch 2 in Fig. 2a) the flaring activity persisted. Peak fluxes of 60–80 10-8 erg cm-2 s-1 were measured. Between flares, we find again fluxes erg cm-2 s-1. In general, in epoch 2 V404 Cyg displayed softer spectra than during epoch 1 even at the lowest count rates, when spectra with 2.3 without a cut-off were frequently observed. Only one of the X-ray flares (detected around MJD 57195.15) displayed a hard X-ray spectrum ( 1.7). Several transitions between Comptonized hard ( 1.7) and soft ( 3) spectra with unconstrained occurred.
In epoch 2, there is more scatter in the measured , and parameters than in epoch 1. Also, the relation between and is complex: while during some flares was roughly constant (e.g. flare on MJD 57194.10, Fig. 7), in other flares the spectrum hardened (e.g. flare on MJD 57195.5) or softened during the entire flare (e.g. flare on MJD 57194.3, Fig. 7). During the flares, displayed values in the range 30–120 keV (nthcomp) or 20–150 keV (compps). Very soft spectra () with unconstrained were detected by the end of epoch 2, when the flux dropped below erg cm-2 s-1.
One additional feature over this period is the detection of X-ray plateaus (i.e. non-varying flux periods) at intermediate fluxes ( erg cm-2 s-1). They last several hours and happen in between successive X-ray flares (red points in Fig. 2; see also Rodriguez et al. 2015). For a closer view of one of these plateaus see Fig. 7. We consistently obtain –values 0.05 and when modeling the plateau spectra using Comptonization models (nthcomp or compps), which also provide systematically lower electron temperatures for these data points ( 30 keV) than those derived in fits to contemporaneous flare spectra ( 50 keV). Joint spectral fits to simultaneous Swift/XRT, INTEGRAL/JEMX and INTEGRAL/ISGRI data by Motta et al. (2016) obtained during the plateau observed on MJD 57194, showed a high absorption ( cm-2) over a dominant reflection component.
Adding an absorption component (tbabs; 1024 cm-2) to the fits to the plateau spectra (as described in detail in Sect. 3.4), we obtain 50 keV, in better agreement with the values derived during contemporaneous flares.
3.1.3 epoch 3: Major flares and onset of outburst decay
Between MJD 57199.05 and MJD 57200.10 we observed two major flares separated by a long X-ray plateau, similar to those seen in epoch2. The first flare (MJD 57199.05–57199.15; Fig. 8) reached a peak flux erg cm-2 s-1. During this flare, the spectrum was hard ( 1.7), contrary to the softer flares detected in epoch 2. We measure roughly constant electron temperatures ( 50 keV) and an optical depth in the range [4–5.5], which decreased as the flare proceeded. During the subsequent X-ray plateau a flux erg cm-2 s-1 was measured (Fig. 8). The plateau lasted 0.15 day.
The plateau was followed by a major X-ray flare (MJD 57199.50–57199.80; Fig. 9) during which the source reached the highest fluxes measured during the 2015 outburst ( erg cm-2 s-1). The flare had two peaks, separated by a 1 hour drop in flux (from 70 to 20 10-8 erg cm-2 s-1 and back to 80 10-8 erg cm-2 s-1). Over the flare rise and decay we find a Comptonized, soft, X-ray spectrum that softened as increased, and hardened as decreased. also evolved in correlation with the flux variations, and reached values above 130 keV (nthcomp) or 90 keV (compps) during the peak of the flare. In some occasions around the peak of the flare is not constrained by our fits (nthcomp).
During the flare decay we find an abrupt drop in flux (from to 10-8 erg cm-2 s-1), which happened in less than half an hour. The drop in flux was accompanied by a transition to harder spectra, characterized by a roughly constant power-law index ( 1.5), increasing and decreasing . After the transition, the flux decay continued at a roughly constant . As the flux evolved towards quiescence values, the spectrum softened again, was unconstrained and the optical depth, , decreased. The two lowest flux spectra in Fig. 1b correspond to this period.
 |
 |
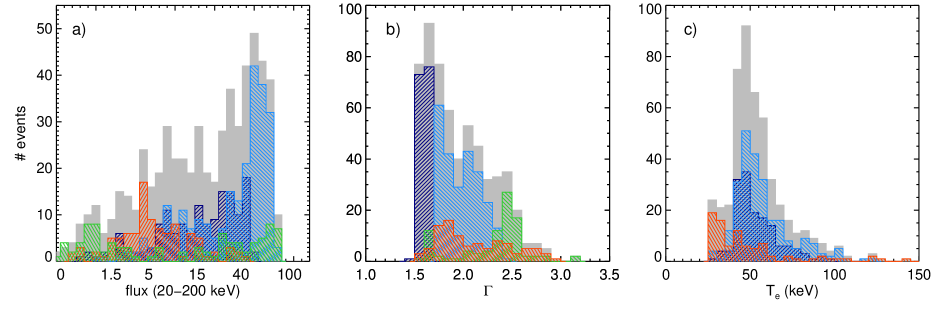
3.2 Parameter distributions
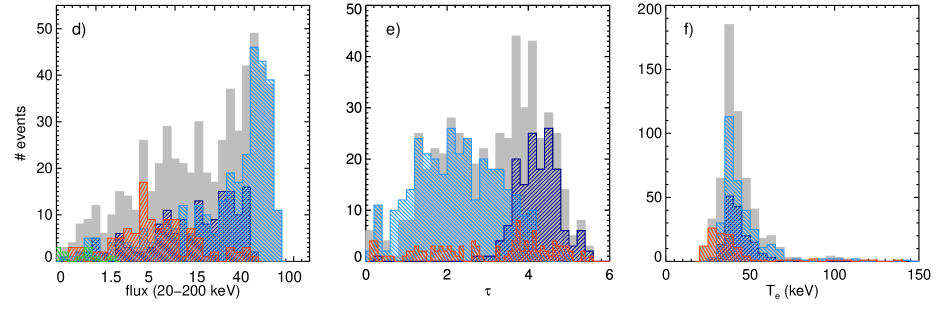
The distributions of the spectral parameters derived in this analysis are displayed in Fig. 3. Note that the integration times of the spectra are flux dependent, and consequently the parameter distributions are skewed towards higher fluxes, when the integration times are shorter, and therefore the sampling is more frequent.
The distribution is shown in Fig. 3a and 3d. We measure fluxes in the range [0.01–80] 10-8 erg cm-2 s-1 with a peak in the distribution at 50 10-8 erg cm-2 s-1. We do not find hard Comptonized spectra ( 1.7) when erg cm-2 s-1. We find soft Comptonized spectra ( 1.7) for fluxes in the range [4–80] ( 10-8 erg cm-2 s-1). Comptonized spectra with unconstrained electron temperatures are predominantly found at the lowest and highest fluxes. Spectra not compatible with Comptonized models are predominant in the range of fluxes [1.5–6] 10-8 erg cm-2 s-1, with a peak in the distribution at 5 10-8 erg cm-2 s-1.
The photon index (; Fig. 3b) was derived using the nthcomp model. The distribution of values is asymmetric, with a peak at and a tail extending to . We measure values in the range [1.5–2.4] for the Comptonized spectra with constrained . All the Comptonized spectra softer than 2.4 display unconstrained in our nthcomp fits. There are also a fraction of hard spectra ( 1.7) with unconstrained . The spectra detected during X-ray plateaus display values in the range [1.6–3.0], with a peak in the distribution at = 1.8.
The optical depth of the Comptonizing plasma (; Fig. 3e), derived using compps shows a large scatter in values, which are in the range []. The hard and soft spectra have different distributions. For the hard spectra ( 1.7) we derive values in the range [3–5.5]. For the softer spectra (1.7 2.4) we derive values in the range [0.1–4.5].
The electron temperatures that we derive using the nthcomp and compps models (Figs. 3c and 3f) display similar distributions, with a narrow peak at moderate temperatures (nthcomp: 45 keV; compps: 35 keV) and a tail extending up to 150 keV. However, the distribution of derived using nthcomp is broader than the distribution of values obtained from the compps fits. We find more spectra with unconstrained using nthcomp than using compps, probably due to the systematically lower values derived using compps. The electron temperatures derived for Comptonized hard ( 1.7) and soft spectra ( 1.7) have consistent values, but we note that the tail of the distribution extends to higher energies for the soft Comptonized spectra than for the hard ones. The fits to the spectra obtained during X-ray plateaus provide broad distributions. They peak at lower energies than those derived for the Comptonized spectra ( 25 keV) and extend up to 130 keV.
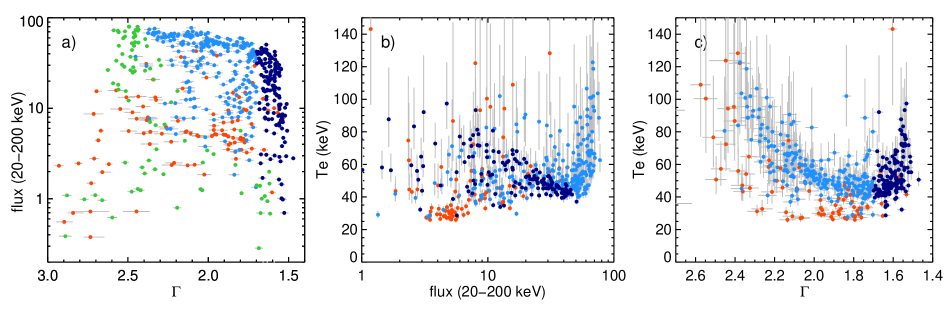
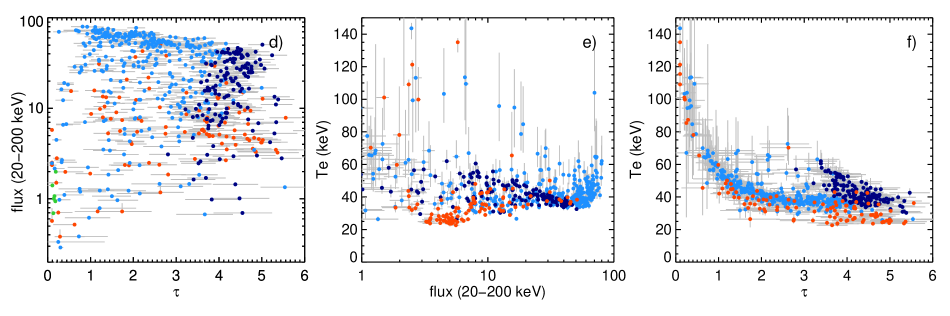
3.3 Parameter relations
The flux dependencies of the photon index and optical depth are presented in the and diagrams (Fig. 4a, 4d). We find that the hard spectra in our sample () occupy a region in the – diagram reminiscent of the hard state in the BHB Hardness-Intensity Diagram (HID; Homan et al. 2001; Belloni 2004; Fender et al. 2004; Dunn et al. 2010). In this region, which we will call hereafter the hard branch, the spectrum softens (from 1.5 to 1.7) while the flux increases, and the optical depth increases with increasing flux from to (Fig. 4d). The hard spectra also occupy defined regions in the –, , and diagrams (Fig. 4b, 4e, 4c, 4f). In these hard branch(es), is anti-correlated with (figure 4b, 4e). We also find that is anti-correlated with and (4c, 4f).
The soft ( 1.7) spectra in our sample, detected during the brightest X-ray flares, occupy a distinct region in the diagram (Fig. 4a) which we will call hereafter the soft flaring branch. In the soft flaring branch the spectrum still softens as the flux increases (Fig. 4a) even though most of the parameter dependencies are reversed with respect to the hard branch: is seen to decrease with increasing flux (Fig. 4d); and are correlated (Fig. 4b, 4e) and the – dependency is also reversed. In the – diagram, we find a range of values ([2.5–4]) for which displays a roughly constant value ( 40 keV). Below 2.5, and are anti-correlated (Fig. 4f).
For spectra softer than 2.4 the spectral fits using nthcomp do not provide constrained electron temperatures. These soft spectra are detected at the highest ( 20 10-8 erg cm-2 s-1) and lowest ( 2 10-8 erg cm-2 s-1) values. When detected at the highest fluxes, they occupy regions in the diagram (Fig. 4a) reminiscent of the HID ultra-luminous state (Motta et al., 2014).
Finally, we also observe that the spectra detected during X-ray plateaus occupy separate regions in all these diagrams, distinct from the Comptonized branches, which confirms our classification of these spectra in a separate category. We will call these regions plateau branch(es).
 |
 |
3.4 Fits to the plateau spectra using variable absorption
To study the poor fitting spectra detected during X-ray plateaus, we also considered the possibility that these were the result of obscuration of the primary X-ray emitting region. Absorption by Compton-thick material ( cm) can substantially reduce the source flux for energies up to 30–40 keV, and also change the spectral slope and produce a global flux reduction by a factor 10 in the 40–300 keV energy range (Murphy & Yaqoob, 2009). Joint spectral fits to simultaneous Swift/XRT and INTEGRAL/JEMX+ISGRI spectra during the X-ray plateau around MJD 57195 by Motta et al. (2016) already showed that the broad band spectrum of V404 Cyg around that period was compatible with heavily absorbed Comptonized emission () with a prominent scattered component.
For the above reasons, we performed two additional fitting runs using compps. In the first fitting run, we left as a free parameter. The results of these fits are presented in Fig. 5. In the second fitting run we also allowed the Compton reflection amplitude parameter in compps to vary freely.
The results obtained in these fits are presented in Fig. 6.
In both cases, we compared the results obtained in these fits against those obtained using a model where the absorption was fixed to interstellar values, as described in the previous sections. We computed the BIC for each fit, and again applied the BIC6 criterium to select the model better describing the data.
Also, the –value of the fit with respect to the data was verified in these new fits.
For the spectra obtained during the X-ray plateaus, the BIC model selection criterium favors a Comptonized model with values in excess of the interstellar one ( cm-2, see Figs. 5, 6) regardless whether reflection is considered or not. However, is constrained better when no reflection is considered (see Fig. 5).
The validity of the models is supported by the –value of the fit with respect to the data, which is now –value for the fits to the plateau spectra, when the absorption is left to vary freely, with or without reflection.
During X-ray flares, the BIC model selection favours a Comptonized model where the absorption is fixed to the interstellar values. The energy range analyzed in this work (20–200 keV), only allows
firm constraints on the most extreme values ( cm-2). Although we observe an evolution of the derived values in anti-correlation with the flux evolution (i.e. reaches the highest values during the X-ray plateaus and decreases during the X-ray flares).
Using solely the 20–200 keV energy range of our spectra, we cannot constrain simultaneously and the reflection contribution to the source spectra (quantified using the parameter in compps, Fig. 6e), as shown by the large uncertainties in the determination of both parameters (Fig. 6d, e).
The BIC model selection criterium favours a Comptonized model with variable column density over a Comptonized model with variable column density and variable reflection. Only extending the fitting range to lower energies we will be able to model simultaneously the absorption and reflection parameters in our fits.
Finally, we note that with the spectral fits presented in this section, the peculiar increase of , and simultaneous decrease of derived during the X-ray plateaus largely disappears, (see Figs. 2, 5, 6) suggesting that the systematic changes of these parameters were the result of an inaccurate modeling.
4 Discussion
The light curve of V404 Cyg during the June 2015 outburst does not display the typical features of the standard BHB light curves (e. g. Chen et al. 1997; Remillard & McClintock 2006). Similarly, the soft X-ray spectra of V404 Cyg is remarkably different from the spectra of other BHBs, mostly due to extreme intrinsic absorption (Motta et al., 2016) also seen in the 1989 outburst (Życki et al., 1999). However, when we look at the source spectra in hard X-rays (above 20 keV), we find some similarities between V404 Cyg and other BHBs.
4.1 Hard branch
We have identified a hard branch in the FX– diagram of V404 Cyg, reminiscent of the hard state branch of the BHB HID (Homan et al., 2001; Belloni, 2004; Fender et al., 2004; Dunn et al., 2010; Belloni & Motta, 2016). The hard branch is occupied by the hardest spectra in our sample (). In the hard branch, the spectrum of V404 Cyg gradually softens and decreases from keV or unconstrained (nthcomp) down to about keV as the flux increases (Fig. 4a, 4d, 4b, 4e). This – anti-correlation was observed by Natalucci et al. (2015) Roques et al. (2015) in the analysis of IBIS/ISGRI and SPI data obtained during rev. 1554 (epoch 1) and by Jenke et al. (2016) using FERMI/GBM data. Similar anti-correlations are also found in other BHBs in the hard state (Esin et al., 1998; Wardziński et al., 2002; Rodriguez et al., 2003; Motta et al., 2009; Kajava et al., 2016), supporting our identification of the hard branch with the hard state of prototypical BHBs (Belloni & Motta, 2016). The – anti-correlation in the hard branch can be explained by the truncated disk/hot inner flow model (Esin et al., 1997; Mayer & Pringle, 2007), which assumes that at low luminosities the accretion disk is truncated at distances between a few tens and a few thousand gravitational radii from the BH, and only a small fraction of disk photons reach the hot flow/comptonizing medium. The X-ray spectrum would then be produced by pure synchrotron self-Compton emission (SSC) in an hybrid (thermal plus non-thermal) Comptonizing medium (Poutanen & Vurm, 2009; Malzac & Belmont, 2009; Veledina et al., 2011). V404 Cyg may be in this regime at fluxes below erg cm-2 s-1, where we measure in the range 60–80 keV (or unconstrained). As the accretion rate increases, the inner radius of the accretion disk moves inwards, closer to the BH, and a growing number of soft seed photons from the accretion disk enter the Comptonizing medium, gradually cooling down the population of thermal electrons (Poutanen & Vurm, 2009; Malzac & Belmont, 2009; Veledina et al., 2011). Electron cooling results in softer Comptonized spectra (Done et al., 2007). The electron cooling could cause the observed – anti-correlation and gradual spectral softening in the hard branch. Observations of GX 339–4 (Wardziński et al., 2002) and GRO J1655–40 (Joinet et al., 2008) in the hard state result in values comparable to our measurements. However, these systems displayed lower values (2.5) than those measured for V404 Cyg ([3–5.5]) which suggests that we are dealing with an optically thicker Comptonizing medium. The values we derive are comparable to those found during the 1989 outburst of V404 Cyg (; Życki et al. 1999). As the optical depth is expected to scale linearly with the mass accretion rate (Różańska & Czerny, 2000), the presence of an optically thick Comptonizing medium may be connected to V404 Cyg emitting closer to the Eddington limit than other BHBs in the hard state.
4.2 Soft flaring branch
In the soft flaring branch the spectrum still softens as the flux increases, but most of the parameter dependencies are reversed with respect to the hard branch, suggesting a change in the hard X-ray production mechanism: as increases, the optical depth of the Comptonizining medium decreases and the spectrum softens (Fig. 4c), while the electron temperature increases (Fig. 4b, 4e). These parameter relations are similar to those observed during hard to soft state transitions in other BHBs (Phlips et al., 1996; Esin et al., 1998; Joinet et al., 2008; Motta et al., 2009; Del Santo et al., 2013), suggesting that the soft flaring branch may correspond to the BHB intermediate state. The decrease in observed during hard to soft state transitions is consistent with the material in the Comptonizing medium condensing into a disk, or being ejected into an outflow (Malzac, 2016). The detection of a cut-off in the spectrum is indicative of a significant fraction of thermal electrons in the Comptonizing medium. increases as the flux progressively increases, suggesting that the injection of external (disk) photons, which cooled down the electron cloud in the hard branch might have ceased or its cooling effect on the electron cloud is negligible.
The steepest spectra in our sample with (or ) are the ones where is not constrained (nthcomp). Fits to these data using compps provide extremely low and high values. When the optical depth is low, the particles do not have time to thermalize between re-accelerations, and the electron distribution resembles the power-law injection function that could originate from magnetic re-connection or shock acceleration (Veledina et al., 2011; Del Santo et al., 2013). These spectra are detected at epochs bracketed by the largest measured values ( keV), so it is likely that they are caused by the electron population becoming simultaneously hotter and/or progressively less thermal. When detected at the highest fluxes ( 20 10-8 erg cm-2 s-1), the spectra occupy a region in the diagram (Fig. 4a) reminiscent of the HID ultra-luminous state (Dunn et al., 2010), which suggests that these spectra could be analogous to the ultra-luminous state of GX 339-4 (Miyamoto et al., 1991; Kubota & Done, 2016), GS 1124–68 (Miyamoto et al., 1993), XTE J1550–564 (Sobczak et al., 1999b; Kubota & Makishima, 2004; Hjalmarsdotter et al., 2016), GRO J1655–40 (Sobczak et al., 1999a; Joinet et al., 2008), or 4U 1630–47 (Abe et al., 2005) where the spectrum is a composite of a strong disc and a steep prominent Comptonized tail, with no cutoff at high energies, which may extend up to 1 MeV (Kubota & Done, 2016).
When detected at the lowest fluxes, these spectra, could be analogous to the soft state spectra of some BHB where faint non-thermal hard X-ray tails are detected (Zdziarski et al., 2016).
4.3 X-ray plateaus
We have observed X-ray plateaus characterized by roughly constant fluxes ( erg cm-2 s-1) during periods lasting several hours. Often the plateaus are observed in between two or several flares (see Figs. 2, 7). Furthermore, we only detect X-ray plateaus in epoch 2 and 3, when the source is predominantly in the soft flaring branch, where the spectrum is softer (). We have observed that the statistically worse fits (1.8; see Fig. 2) tend to happen during these X-ray plateaus if we fix to the interstellar value in the direction of the source. The statistics are improved when allowing to vary in our fits (1; see Figs. 5, 6). In this case we derive values ( cm-2) two orders of magnitude in excess of the interstellar value in the direction of the source ( cm-2), which suggests that intrinsic absorption by Compton-thick material distorts the source spectrum, and results in the spectral shape observed during the X-ray plateaus (see Fig. 1c). Due to the limited energy range available for this analysis, our fits cannot constrain simultaneously and the fraction of X-ray photons reprocessed by the Compton thick material contributing to the source spectra (i.e. the reflection fraction in compps). We note also that if is allowed to vary in our fits, the spectral parameters and display values consistent with measurements during nearly contemporaneous flares.
In previous studies, Natalucci et al. (2015), Roques et al. (2015) and Jenke et al. (2016) inferred very high seed photon temperatures 6–7 keV, which they attributed to the jet. Our results show that the source spectra can also be modeled using lower seed photons temperatures (consistent with Swift/XRT results; Motta et al. 2016) and strong local absorption.
4.4 Flaring activity
Although cannot be properly constrained during the X-ray flares, when lower values are derived, it is seen to vary in anti-correlation with the evolving X-ray flux over the whole data set analyzed here (Fig. 5c). The fact that we derive cm-2 only during the X-ray plateaus, and clearly lower values in the adjacent flares, suggests that the dramatic intensity drops observed during these plateaus may be partially caused by obscuration of the central source. The obscuring material can be some outflowing material, the outer regions of a Compton thick accretion disk, or a combination of both. Thus, the apparent flaring activity may be actually the result of a clumpy Compton-thick obscuring material becoming occasionally Compton-thin and allowing the source photons to reach the observer. The fast flare rise and decay times (30 min, see Fig. 7) may actually be related to varying partial obscuration of the central source, as previously suggested by Życki et al. (1999), who measured variability on timescales of minutes during the 1989 outburst. Perhaps also for the same reason we find a lot of scatter in the correlations between and the source spectral parameters (, ), while there is much less scatter in the various parameter correlations (–, – see Fig. 4).
5 Summary of results and conclusions
We have fit the 20–200 keV IBIS/ISGRI spectra of V404 Cyg during the June 2015 outburst using two thermal Comptonization models (nthcomp and compps). For the first time we have continuously measured the evolution of the properties of the Comptonizing medium during an outburst rise and decay. We find that the system evolves through the same –, – and – paths when the outburst rises or decays. We have identified two clear spectral branches in the - diagram which display characteristic parameter relations: a hard branch and a soft flaring branch.
In the hard branch, V404 Cyg shows a hard (1.7) thermal Comptonized spectrum, which slowly softens as the flux increases. In the hard branch, is correlated with while is anti-correlated with and . Similar parameter correlations have been observed in other BHBs in the hard state, suggesting that the hard branch could correspond to the HID hard state. The observed parameter evolution can be explained in terms of thermal Comptonization of soft seed photons by a hot electron cloud in the vicinity of the BH. The – anti-correlation could result from the electron population progressively cooling down as the accretion disk moves closer to the BH and more disk photons enter the Comptonizing medium.
In the soft flaring branch V404 Cyg shows a soft, thermal Comptonized spectrum, (1.7), which softens as the flux increases. In the soft flaring branch and are correlated, while and are anti-correlated. The parameter correlations are consistent with those observed during hard to soft state transitions in other sources, suggesting that these data could correspond to the intermediate state or occasionally the ultra-luminous state. The observed – correlation is compatible with the predictions of SSC-models.
We have also found a plateau branch where Comptonization models fail to describe the source spectra if is fixed to the interstellar values in the direction of the source. The fits to these spectra improve when we leave the absorption to vary freely. In this case we derive values ( cm-2) which suggests that intrinsic absorption by Compton-thick material results in the spectral shape observed during the X-ray plateaus. The obscuring material can be some outflowing material, a clumpy Compton thick accretion disk, or a combination of both. Thus, we propose that the observed dramatic flaring activity seen at hard X-rays may not only be due to intrinsic source variability, but can partly result from obscuration of the central source by Compton thick material. The system inclination of 67∘ may be a key parameter in he observation of such phenomenology, not observed in other sources seen at lower or higher inclination angles.
Acknowledgements.
The authors would like to thank the anonymous referee for useful comments that contributed to improve the paper. JJEK was supported by Academy of Finland grants 268740 and 295114, and the ESA research fellowship programme. SEM acknowledges support from the Faculty of the European Space Astronomy Centre (ESAC).References
- Abe et al. (2005) Abe, Y., Fukazawa, Y., Kubota, A., Kasama, D., & Makishima, K. 2005, PASJ, 57, 629
- Arnaud (1996) Arnaud, K. A. 1996, in Astronomical Society of the Pacific Conference Series, Vol. 101, Astronomical Data Analysis Software and Systems V, ed. G. H. Jacoby & J. Barnes, 17
- Barthelmy & Sbarufatti (2015) Barthelmy, S. D. & Sbarufatti, B. 2015, GRB Coordinates Network, 17963
- Belloni (2004) Belloni, T. 2004, Nuclear Physics B Proceedings Supplements, 132, 337
- Belloni & Motta (2016) Belloni, T. M. & Motta, S. E. 2016, in Astrophysics and Space Science Library, Vol. 440, Astrophysics of Black Holes: From Fundamental Aspects to Latest Developments, ed. C. Bambi, 61
- Beloborodov (1999) Beloborodov, A. M. 1999, in ASP Conf. Ser. 161: High Energy Processes in Accreting Black Holes, ed. J. Poutanen & R. Svensson, 295
- Casares et al. (1992) Casares, J., Charles, P. A., & Naylor, T. 1992, Nature, 355, 614
- Chen et al. (1997) Chen, W., Shrader, C. R., & Livio, M. 1997, ApJ, 491, 312
- Courvoisier et al. (2003) Courvoisier, T. J.-L., Walter, R., Beckmann, V., et al. 2003, A&A, 411, L53
- Del Santo et al. (2013) Del Santo, M., Malzac, J., Belmont, R., Bouchet, L., & De Cesare, G. 2013, MNRAS, 430, 209
- Done et al. (2007) Done, C., Gierliński, M., & Kubota, A. 2007, A&A Rev., 15, 1
- Droulans et al. (2010) Droulans, R., Belmont, R., Malzac, J., & Jourdain, E. 2010, ApJ, 717, 1022
- Dunn et al. (2010) Dunn, R. J. H., Fender, R. P., Körding, E. G., Belloni, T., & Cabanac, C. 2010, MNRAS, 403, 61
- Ebisawa et al. (1994) Ebisawa, K., Ogawa, M., Aoki, T., et al. 1994, PASJ, 46, 375
- Eikenberry et al. (2016) Eikenberry, S. S., Dallilar, Y., Garner, A., et al. 2016, in AAS/High Energy Astrophysics Division, Vol. 15, AAS/High Energy Astrophysics Division, 109.01
- Esin et al. (1997) Esin, A. A., McClintock, J. E., & Narayan, R. 1997, ApJ, 489, 865
- Esin et al. (1998) Esin, A. A., Narayan, R., Cui, W., Grove, J. E., & Zhang, S.-N. 1998, ApJ, 505, 854
- Fender et al. (2004) Fender, R. P., Belloni, T. M., & Gallo, E. 2004, MNRAS, 355, 1105
- Ferrigno et al. (2015) Ferrigno, C., Bozzo, E., Boissay, R., Kuulkers, E., & Kretschmar, P. 2015, The Astronomer’s Telegram, 7731
- Gandhi et al. (2016) Gandhi, P., Littlefair, S. P., Hardy, L. K., et al. 2016, MNRAS, 459, 554
- Gierliński et al. (1999) Gierliński, M., Zdziarski, A. A., Poutanen, J., et al. 1999, MNRAS, 309, 496
- Hjalmarsdotter et al. (2016) Hjalmarsdotter, L., Axelsson, M., & Done, C. 2016, MNRAS, 456, 4354
- Homan et al. (2001) Homan, J., Wijnands, R., van der Klis, M., et al. 2001, ApJS, 132, 377
- Jenke et al. (2016) Jenke, P. A., Wilson-Hodge, C. A., Homan, J., et al. 2016, ApJ, 826, 37
- Joinet et al. (2007) Joinet, A., Jourdain, E., Malzac, J., et al. 2007, ApJ, 657, 400
- Joinet et al. (2008) Joinet, A., Kalemci, E., & Senziani, F. 2008, ApJ, 679, 655
- Kajava et al. (2016) Kajava, J. J. E., Veledina, A., Tsygankov, S., & Neustroev, V. 2016, A&A, 591, A66
- Kass (1995) Kass, R.. Raftery, A. 1995, Journal of the American Statistical Association, 90, 773
- Khargharia et al. (2010) Khargharia, J., Froning, C. S., & Robinson, E. L. 2010, ApJ, 716, 1105
- Kimura et al. (2016) Kimura, M., Isogai, K., Kato, T., et al. 2016, Nature, 529, 54
- Kubota & Done (2016) Kubota, A. & Done, C. 2016, MNRAS, 458, 4238
- Kubota & Makishima (2004) Kubota, A. & Makishima, K. 2004, ApJ, 601, 428
- Kuulkers (2015) Kuulkers, E. 2015, The Astronomer’s Telegram, 7758
- Lebrun et al. (2003) Lebrun, F., Leray, J. P., Lavocat, P., et al. 2003, A&A, 411, L141
- Loh et al. (2016) Loh, A., Corbel, S., Dubus, G., et al. 2016, MNRAS, 462, L111
- Makino (1989) Makino, F. 1989, IAU Circ., 4782
- Malzac (2016) Malzac, J. 2016, Astronomische Nachrichten, 337, 391
- Malzac & Belmont (2009) Malzac, J. & Belmont, R. 2009, MNRAS, 392, 570
- Malzac et al. (2006) Malzac, J., Petrucci, P. O., Jourdain, E., et al. 2006, A&A, 448, 1125
- Marsden (1989) Marsden, B. G. 1989, IAU Circ., 4783
- Mayer & Pringle (2007) Mayer, M. & Pringle, J. E. 2007, MNRAS, 376, 435
- McConnell et al. (2002) McConnell, M. L., Zdziarski, A. A., Bennett, K., et al. 2002, ApJ, 572, 984
- Miller-Jones et al. (2009) Miller-Jones, J. C. A., Jonker, P. G., Dhawan, V., et al. 2009, ApJ, 706, L230
- Miyamoto et al. (1993) Miyamoto, S., Iga, S., Kitamoto, S., & Kamado, Y. 1993, ApJ, 403, L39
- Miyamoto et al. (1991) Miyamoto, S., Kimura, K., Kitamoto, S., Dotani, T., & Ebisawa, K. 1991, ApJ, 383, 784
- Motta et al. (2009) Motta, S., Belloni, T., & Homan, J. 2009, MNRAS, 400, 1603
- Motta et al. (2012) Motta, S., Homan, J., Muñoz Darias, T., et al. 2012, MNRAS, 427, 595
- Motta et al. (2014) Motta, S. E., Belloni, T. M., Stella, L., Muñoz-Darias, T., & Fender, R. 2014, MNRAS, 437, 2554
- Motta et al. (2016) Motta, S. E., Kajava, J. J. E., Sánchez-Fernández, C., Giustini, M., & Kuulkers, E. 2016, ArXiv e-prints [arXiv:1607.02255]
- Muñoz-Darias et al. (2016) Muñoz-Darias, T., Casares, J., Mata Sánchez, D., et al. 2016, Nature, 534, 75
- Murphy & Yaqoob (2009) Murphy, K. D. & Yaqoob, T. 2009, MNRAS, 397, 1549
- Narayan & Yi (1995) Narayan, R. & Yi, I. 1995, ApJ, 452, 710
- Natalucci et al. (2015) Natalucci, L., Fiocchi, M., Bazzano, A., et al. 2015, ApJ, 813, L21
- Negoro et al. (2015) Negoro, H., Matsumitsu, T., Mihara, T., et al. 2015, The Astronomer’s Telegram, 7646
- Oosterbroek et al. (1996) Oosterbroek, T., van der Klis, M., Vaughan, B., et al. 1996, A&A, 309, 781
- Phlips et al. (1996) Phlips, B. F., Jung, G. V., Leising, M. D., et al. 1996, ApJ, 465, 907
- Poutanen & Svensson (1996) Poutanen, J. & Svensson, R. 1996, ApJ, 470, 249
- Poutanen & Veledina (2014) Poutanen, J. & Veledina, A. 2014, Space Sci. Rev., 183, 61
- Poutanen & Vurm (2009) Poutanen, J. & Vurm, I. 2009, ApJ, 690, L97
- Remillard & McClintock (2006) Remillard, R. A. & McClintock, J. E. 2006, ARA&A, 44, 49
- Richter (1989) Richter, G. A. 1989, Information Bulletin on Variable Stars, 3362
- Rodriguez et al. (2015) Rodriguez, J., Cadolle Bel, M., Alfonso-Garzón, J., et al. 2015, A&A, 581, L9
- Rodriguez et al. (2003) Rodriguez, J., Corbel, S., & Tomsick, J. A. 2003, ApJ, 595, 1032
- Roques et al. (2015) Roques, J.-P., Jourdain, E., Bazzano, A., et al. 2015, ApJ, 813, L22
- Różańska & Czerny (2000) Różańska, A. & Czerny, B. 2000, A&A, 360, 1170
- Schwarz (1978) Schwarz, G. 1978, Annals of statistics, 6, 461
- Segreto et al. (2015) Segreto, A., Del Santo, M., D’Aí, A., et al. 2015, The Astronomer’s Telegram, 7755
- Shakura & Sunyaev (1973) Shakura, N. I. & Sunyaev, R. A. 1973, A&A, 24, 337
- Shapiro et al. (1976) Shapiro, S. L., Lightman, A. P., & Eardley, D. M. 1976, ApJ, 204, 187
- Siegert et al. (2016) Siegert, T., Diehl, R., Greiner, J., et al. 2016, Nature, 531, 341
- Sivakoff et al. (2015) Sivakoff, G. R., Bahramian, A., Altamirano, D., et al. 2015, The Astronomer’s Telegram, 7959
- Sobczak et al. (1999a) Sobczak, G. J., McClintock, J. E., Remillard, R. A., Bailyn, C. D., & Orosz, J. A. 1999a, ApJ, 520, 776
- Sobczak et al. (1999b) Sobczak, G. J., McClintock, J. E., Remillard, R. A., et al. 1999b, ApJ, 517, L121
- Sunyaev & Truemper (1979) Sunyaev, R. A. & Truemper, J. 1979, Nature, 279, 506
- Tanaka (1989) Tanaka, Y. 1989, in ESA Special Publication, Vol. 296, Two Topics in X-Ray Astronomy, Volume 1: X Ray Binaries. Volume 2: AGN and the X Ray Background, ed. J. Hunt & B. Battrick
- Tetarenko et al. (2015) Tetarenko, A., Sivakoff, G. R., Young, K., Wouterloot, J. G. A., & Miller-Jones, J. C. 2015, The Astronomer’s Telegram, 7708
- Veledina et al. (2011) Veledina, A., Vurm, I., & Poutanen, J. 2011, MNRAS, 414, 3330
- Walton et al. (2015) Walton, D., Harrison, F., Forster, K., et al. 2015, The Astronomer’s Telegram, 7752
- Walton (2016) Walton, D. e. 2016, in AAS/High Energy Astrophysics Division, Vol. 15, AAS/High Energy Astrophysics Division, 109.08
- Wardziński et al. (2002) Wardziński, G., Zdziarski, A. A., Gierliński, M., et al. 2002, MNRAS, 337, 829
- Winkler et al. (2003) Winkler, C., Courvoisier, T. J.-L., Di Cocco, G., et al. 2003, A&A, 411, L1
- Younes (2015) Younes, G. 2015, GRB Coordinates Network, 17932
- Zdziarski et al. (1996) Zdziarski, A. A., Johnson, W. N., & Magdziarz, P. 1996, MNRAS, 283, 193
- Zdziarski et al. (2012) Zdziarski, A. A., Lubiński, P., & Sikora, M. 2012, MNRAS, 423, 663
- Zdziarski et al. (2016) Zdziarski, A. A., Malyshev, D., Chernyakova, M., & Pooley, G. G. 2016, ArXiv e-prints [arXiv:1607.05059]
- Życki et al. (1999) Życki, P. T., Done, C., & Smith, D. A. 1999, MNRAS, 309, 561
Appendix A Closer view to some flares