The light-yield response of a NE-213 liquid-scintillator detector measured using 2 – 6 MeV tagged neutrons
Abstract
The response of a NE-213 liquid-scintillator detector has been measured using tagged neutrons from 2–6 MeV originating from an Am/Be neutron source. The neutron energies were determined using the time-of-flight technique. Pulse-shape discrimination was employed to discern between gamma-rays and neutrons. The behavior of both the fast (35 ns) and the combined fast and slow (475 ns) components of the neutron scintillation-light pulses were studied. Three different prescriptions were used to relate the neutron maximum energy-transfer edges to the corresponding recoil-proton scintillation-light yields, and the results were compared to simulations. The overall normalizations of parametrizations which predict the fast or total light yield of the scintillation pulses were also tested. Our results agree with both existing data and existing parametrizations. We observe a clear sensitivity to the portion and length of the neutron scintillation-light pulse considered.
keywords:
NE-213, gamma-rays, fast-neutrons, scintillations, pulse-shape discrimination1 Introduction
Organic liquid scintillators are typically employed to detect fast neutrons in mixed neutron and gamma-ray fields. When exposed to these two different types of radiation, such scintillators emit light with dramatically different decay-time constants. Gamma-rays interact dominantly with the atomic electrons of the scintillator atoms. The freed electrons are almost minimum ionizing and produce very fast flashes of light (10s of ns decay times). In contrast, neutrons interact dominantly with the hydrogen nuclei (and to a lesser extent, carbon nuclei) of the scintillator molecules via scattering. Only the hydrogen nuclei are given sufficient energy to produce a significant signal, and in the neutron energy range from 2–6 MeV, the recoiling protons are far from minimum ionizing and produce much slower flashes of light (100s of ns decay times). By examining the time dependence of the scintillation-light intensity, differences in pulse shapes may be identified. Such pulse-shape discrimination (PSD) may be used to determine whether or not the incident radiation was a neutron or gamma-ray.
The organic liquid scintillator NE-213 [1] has been a popular detector medium since its introduction in the early 1960s [2]. It is a solution of aromatic molecules suspended in a xylene solvent111More recent variants are based on a pseudo-cumene solvent. These variants are less flammable than the xylene-based original.. The result is a flammable, corrosive, sharp-smelling liquid with a flash point of 26 ∘C that poses a considerable health risk. Nevertheless, due to its strong gamma-ray rejection properties, which are facilitated by excellent PSD characteristics and high detection efficiency for fast neutrons, NE-213 (first three scintillation-light decay constants: 3.16, 32.3, and 270 ns) has long set the standard for organic liquid scintillators (and beyond). As a result, newly developed fast-neutron detectors are often compared to it [3, 4, 5, 6].
We have recently reported on a technique for tagging neutrons emitted by actinide/Be-based radioactive sources [7]. In that paper, we also discuss in detail the experimental apparatus and technique employed here. In this paper, we present the results of our inaugural investigation performed using this neutron-tagging technique – a precision mapping of the response of a NE-213 liquid-scintillator detector using neutrons tagged from 2–6 MeV.
2 Apparatus
2.1 Actinide/Be-based source
An 18.5 GBq 241Am/9Be (Am/Be) source was employed for the irradiations performed in this work. We note that the neutron-tagging technique described below will work equally well for any actinide/Be-based neutron source. Unwanted 60 keV gamma-rays associated with the -decay of 241Am were attenuated using a 3 mm thick Pb sheet. The source radiated (1.1060.015) 106 neutrons per second nearly isotropically [8]. Fast neutrons were produced when the -particles from the decay of 241Am interacted with the 9Be. These neutrons had a maximum energy of about about 11 MeV [9]. Roughly 25% of the neutrons had an energy less than 1 MeV [10]. If the recoiling 12C was left in its first excited state (about 55% of the time [10, 11, 12]), the freed neutron was accompanied by an isotropically radiated prompt 4.44 MeV de-excitation gamma-ray. The half-value layer (HVL) for 3.5 MeV gamma-rays in lead is 1.51 cm, and above this energy, the HVL does not increase with increasing gamma-ray energy. As a result, fewer than 20% of these 4.44 MeV gamma-rays were attenuated in the 3 mm Pb sleeve. Thus, the radiation field associated with the lead-shielded Am/Be source was to a large extent a combination of 4.44 MeV gamma-rays and their associated fast-neutrons.
2.2 NE-213 liquid-scintillator detector
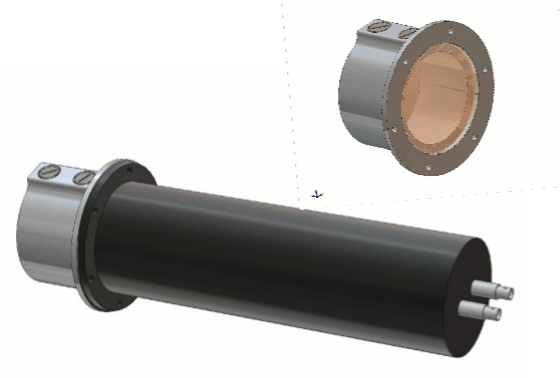
Figure 1 presents the NE-213 liquid-scintillator detector employed in this measurement. A 3 mm thick cylindrical aluminum cell 62 mm deep by 94 mm in diameter, coated internally with EJ-520 TiO2-based reflective paint [13], contained the NE-213. A 5 mm thick borosilicate glass plate [14], attached using Araldite 2000 glue [15], served as an optical window. A pressurized nitrogen gas-transfer system was used to fill the cell with nitrogen-flushed NE-213, and Viton O-rings [16] were used to seal the filling penetrations. The filled cell was coupled to a cylindrical PMMA UVT lightguide [17] 57 mm long by 72.5 mm in diameter coated on the outside by EJ-510 [18] TiO2-based reflector. The cell/lightguide assembly was attached to a spring-loaded, -metal shielded 3 in. ET Enterprises 9821KB photomultiplier tube (PMT) and base [19]. Gain for the NE-213 detector was set using standard gamma-ray sources, resulting in an operating voltage of about 2000 V. Typical signal risetime was 5 ns.
2.3 YAP(Ce) 4.44 MeV gamma-ray detectors
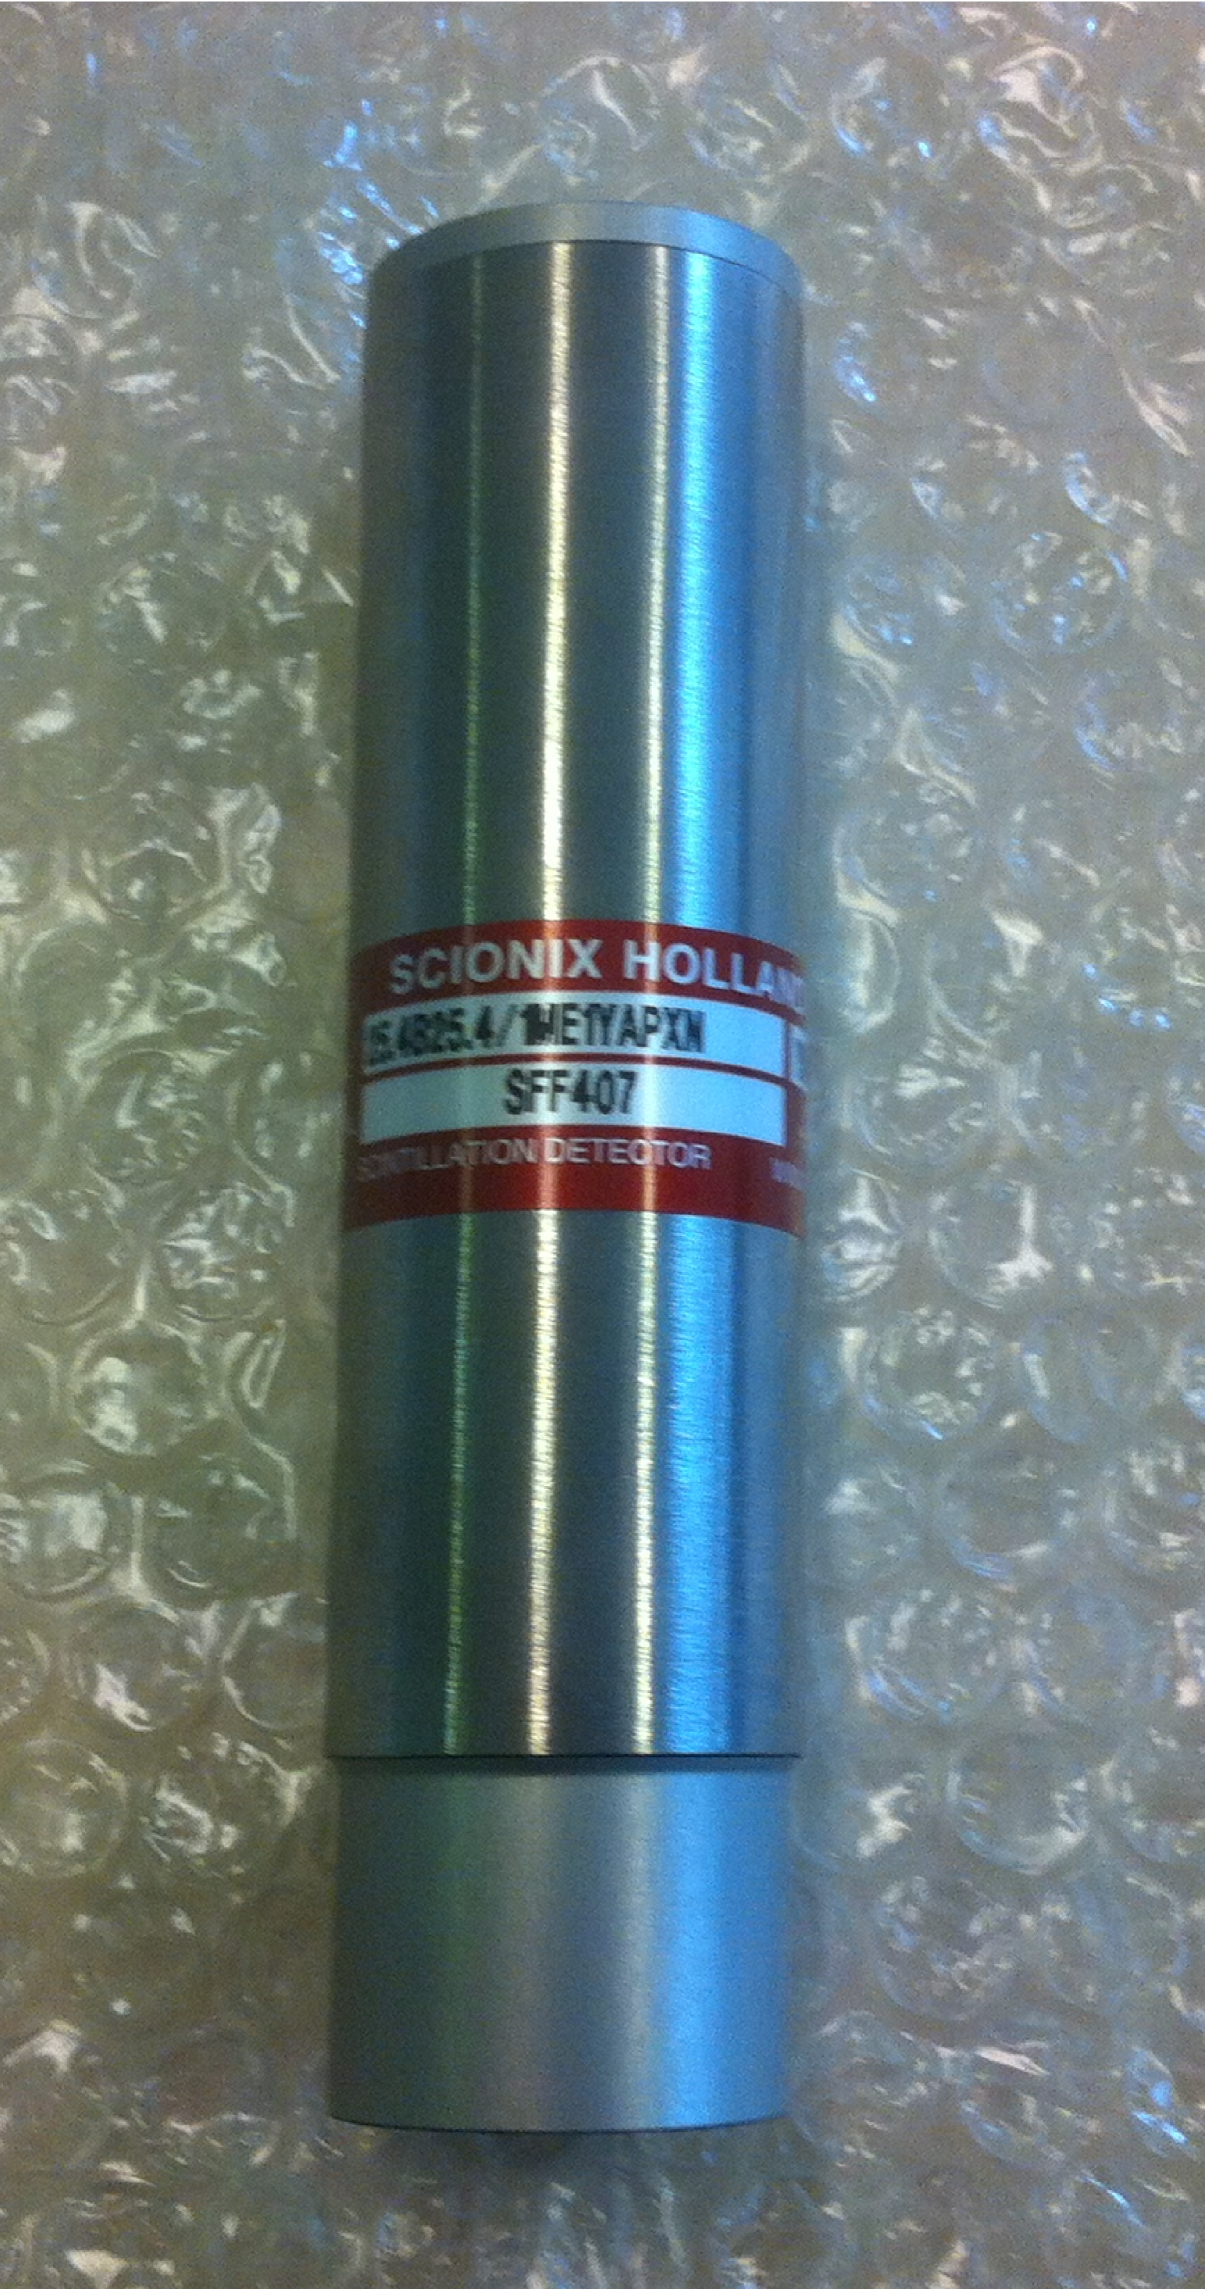
Figure 2 presents a photograph of one of the YAP(Ce) gamma-ray detectors provided by Scionix [20] that was employed in this measurement. YAP(Ce) is an abbreviation for yttrium aluminum perovskit:cerium, or YAlO3, Ce+ doped. YAP(Ce) is both radiation hard and relatively insensitive to fast neutrons. Each detector was composed of a cylindrical 1 in. long by 1 in. diameter crystal [21] attached to a 1 in. Hamamatsu Type R1924 PMT [22]. Gains for the YAP(Ce) detectors were set using standard gamma-ray sources with typical operating voltages of about 800 V. Typical signal risetime was 5 ns. The energy resolution for the 662 keV peak of 137Cs measured using such a detector was about 10%. We stress that the YAP(Ce) detectors were not used for gamma-ray spectroscopy, but rather to count the 4.44 MeV gamma-rays emitted by the source and thus provide a reference in time for the corresponding emitted neutrons.
3 Measurement
3.1 Setup
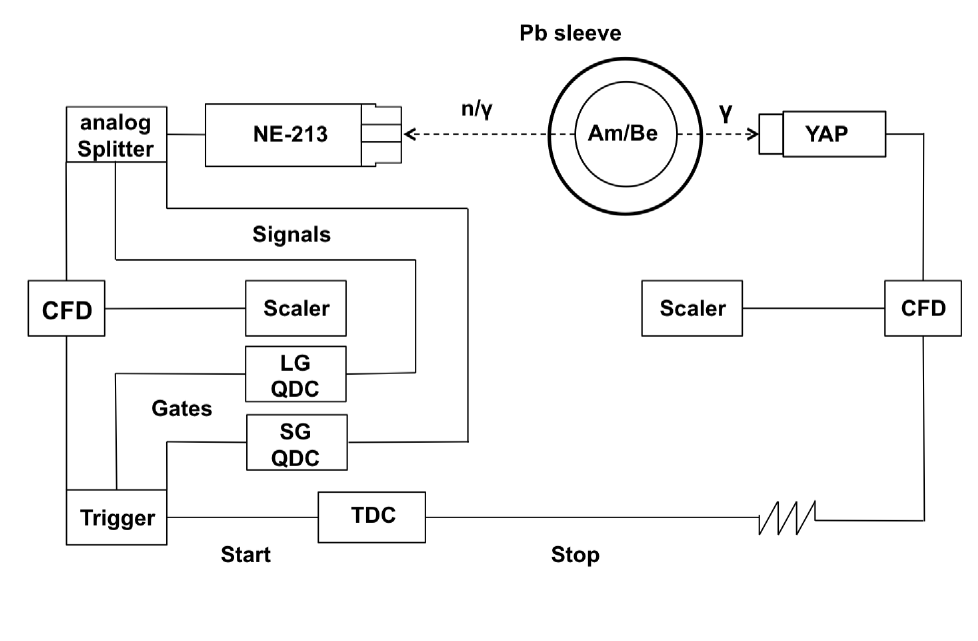
Figure 3 shows a simplified block diagram of the experimental setup. As previously mentioned, the Am/Be source was placed within a 3 mm thick Pb sleeve to attenuate the source-associated 60 keV gamma-rays. Two YAP(Ce) detectors (for simplicity, only one is shown) were located about 5 cm from the Am/Be source at source height. The threshold for the YAP(Ce) detectors was about 350 keVee (keV electron equivalent). The NE-213 detector was located 2.420 m from the Am/Be source and also at source height. The threshold for the NE-213 detector was about 250 keVee. Both detectors triggered overwhelmingly on the source-associated 4.44 MeV gamma-rays corresponding to the decay of the first excited state of 12C, but they also registered a large number of 2.23 MeV gamma-rays associated with neutron capture on the hydrogen in the water and paraffin used as general radiation shielding (not shown in this simplified illustration). The NE-213 detector also triggered on the fast neutrons radiated from the source. By detecting both the fast neutron and the prompt correlated 4.44 MeV gamma-ray, neutron time-of-flight (TOF) and thus energy was determined. This neutron-tagging technique enabled the mapping of the response of the NE-213 cell to fast neutrons as a function of their kinetic energy. Note that due to the energy invested in the 4.44 MeV gamma-ray, the tagging technique restricted the maximum available tagged-neutron energies to about 6 MeV.
3.2 Electronics and data acquisition
The analog signals from the detectors were split and sent to LeCroy 2249A (DC-coupled short gate SG) and 2249W (AC-coupled long gate LG) CAMAC charge-to-digital converters (QDCs) and Phillips Scientific 715 NIM constant-fraction timing discriminators (CFDs). The discriminator logic signals were sent to LeCroy 4434 scalers and LeCroy 2228A CAMAC time-to-digital converters (TDCs). A CES 8210 branch driver was employed to connect the CAMAC electronics to a VMEbus and a SBS 616 PCI-VME bus adapter was used to connect the VMEbus to a LINUX PC-based data-acquisition (DAQ) system. The signals were recorded and processed using ROOT-based software [23]. Signals from the NE-213 detector were used to trigger the DAQ and also provided the start for the TOF TDC. As previously mentioned, the NE-213 detector QDCs included a 60 ns gated SG QDC and a 500 ns gated LG QDC, where in both cases, the gates opened 25 ns prior to the arrival of the analog pulse. The YAP(Ce) detector provided the stop signal for the TOF TDC. We were particularly interested in two source-related event types: 1) a fast neutron detected in the NE-213 detector (which started the TOF TDC) and the corresponding 4.44 MeV gamma-ray detected in the YAP(Ce) detector (which stopped the TOF TDC); and 2) a prompt, time-correlated gamma-ray pair detected one in the NE-213 detector and one in a YAP(Ce) detector (a gamma-flash event, see below). Such a pair of gamma-rays can result from, for example, the decay of 241Am to the higher excited states of 237Np.
3.3 Energy calibration
Gamma-ray sources are typically used to calibrate organic scintillators as the light yield of the recoiling atomic electrons is linear above about 100 keV [24, 25]. However, the low Z value typical of liquid scintillators means that gamma-ray interactions are dominated by Compton scattering at energies of a few MeV. Thus, resolution-broadened Compton edges must be carefully interpreted in order to calibrate the detector. Two different prescriptions to extract the Compton edge from a resolution-smeared distribution have been reported by Flynn et al. [26] and Knox and Miller [24]. More recently, with the aid of Monte Carlo simulations, it has become generally accepted that the Compton edge lies somewhere between these prescriptions [27, 28, 29, 30]. Apparently, no clear concensus exists.
We simulated the response of our detector to gamma-rays (and then neutrons, see below) using GEANT4 (version 10.00 patch2) with the standard electromagnetic-interaction package and hadronic physics list QGSP_BERT_HP which provided high-precision data-driven models for neutron interactions below 20 MeV [31, 32]. The amplitude of the detector signal was provided by a sensitive-detector class which recorded the total energy deposited in the liquid-scintillator volume. The detector was defined to be the NE-213 filled cell together with the non-sensitive PMMA lightguide. For the purpose of the energy-calibration simulation, a point source of gamma-rays was positioned along the cylindrical symmetry axis of the cell at a distance of 1.5 cm from the face. The gamma-rays were directed onto the cell along its symmetry axis. Simulations of the deposited energy / scintillation-light yield for the detector were performed for the gamma-rays coming from 22Na (511 keV and 1274 keV) and 137Cs (662 keV), with corresponding Compton-edge-equivalent energies of 341 keVee, 1062 keVee, and 477 keVee, respectively. A non-linear, energy-dependent parametrization of the detector resolution measured for gamma-ray energies between 0.5 MeVee (18%) and 4.0 MeVee (10%) was included in the simulation. Note that this exact same parametrization was used to smear the GEANT4-simulated detector response to produce resolution-corrected neutron scintillation-light yield spectra (see below).
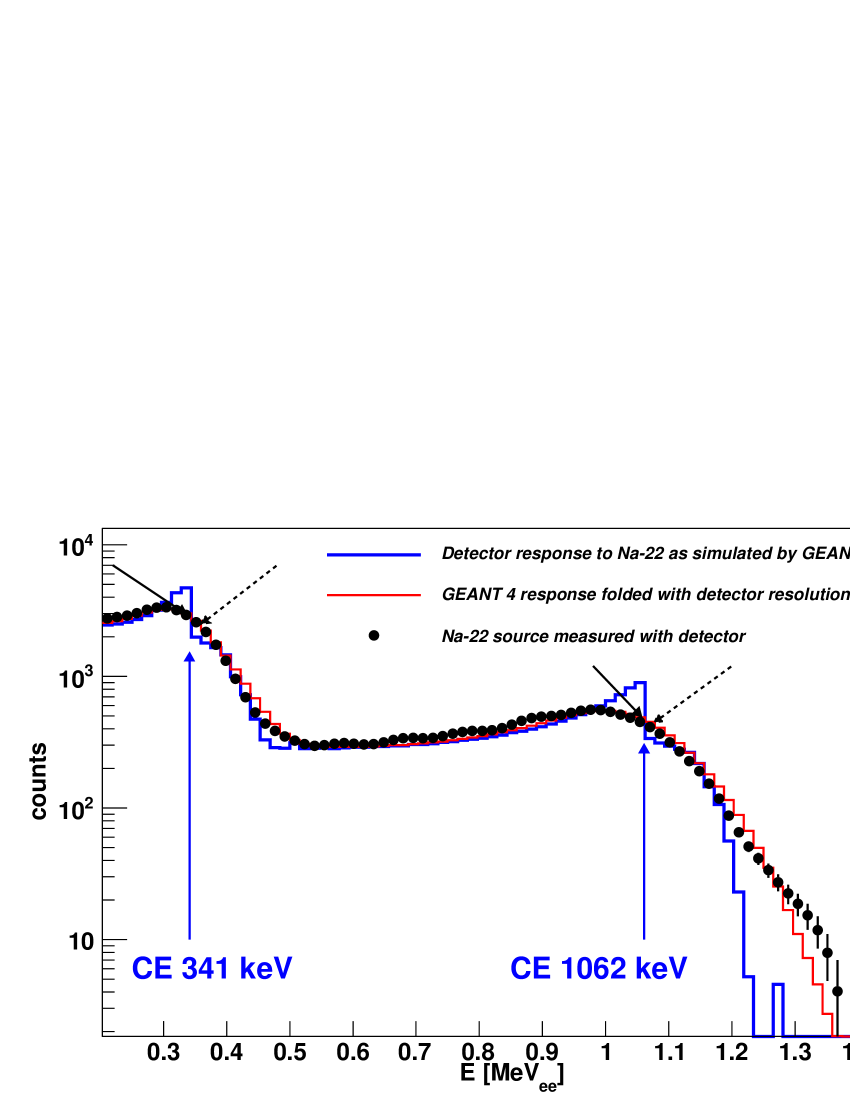
Figure 4 shows a representative comparison between the GEANT4 simulation of the response of the detector to the gamma-rays coming from a 22Na source and background-subtracted data obtained with a 22Na source. The blue histogram corresponds to the basic simulation of the deposited energy and does not include resolution effects but clearly illustrates the Compton edges at 341 keVee and 1062 keVee. The red histogram corresponds to the simulation including the non-linear parametrization of the energy-resolution effects detailed above. The black dots result from the subtraction of non-source-related background from the measured data. This included cosmic-ray background and experiment-hall background. The intensity of the cosmic-ray background was addressed with an energy-dependent exponential function, while the room background was addressed by identifying dominant gamma-rays present in data taken simultaneously with a HPGe detector. This background was then simulated as a combination of the dominant gamma-rays – specifically, from 40K (1460 keV), 208Tl (2614 keV, 583 keV, and 510 keV using the branching ratio 100:85:23) and 511 keV positron annihilation222 Unfortunately, a “source-free” data set was not available. . The overall agreement between the measured data and simulation is very good. We attribute the very small variations between 0.5 MeVee and 1.0 MeVee to room background which we did not address. The enhanced strength at 1.4 MeV may be due to the simultaneous detection of both the gamma-rays emitted by 22Na.
We compared the results of our simulations to the Compton-edge prescriptions suggested by Flynn et al. [26] (dashed black arrows in Fig. 4) and Knox and Miller [24] (solid black arrows in Fig. 4). When the Flynn et al. approach was taken, we found it to overpredict systematically the locations of the Compton edges by more than 10%. When the Knox and Miller approach was taken, we found it to underpredict systematically the locations of the Compton edges by less than 3%.
4 Results
As previously mentioned, gamma-ray scintillations in NE-213 are generally fast (10s of ns decay times) while neutron scintillations are much slower (100s of ns decay times). The type of radiation incident upon the NE-213 scintillator may thus be identified by examining the time structure of the scintillation pulses. We used the standard “tail-to-total” method [33, 34, 5]. With this method, the difference in the integrated charge produced by the scintillation-light pulses in the LG and SG QDCs was normalized to the integrated charge produced by the scintillation-light pulse in the LG QDC according to
| (1) |
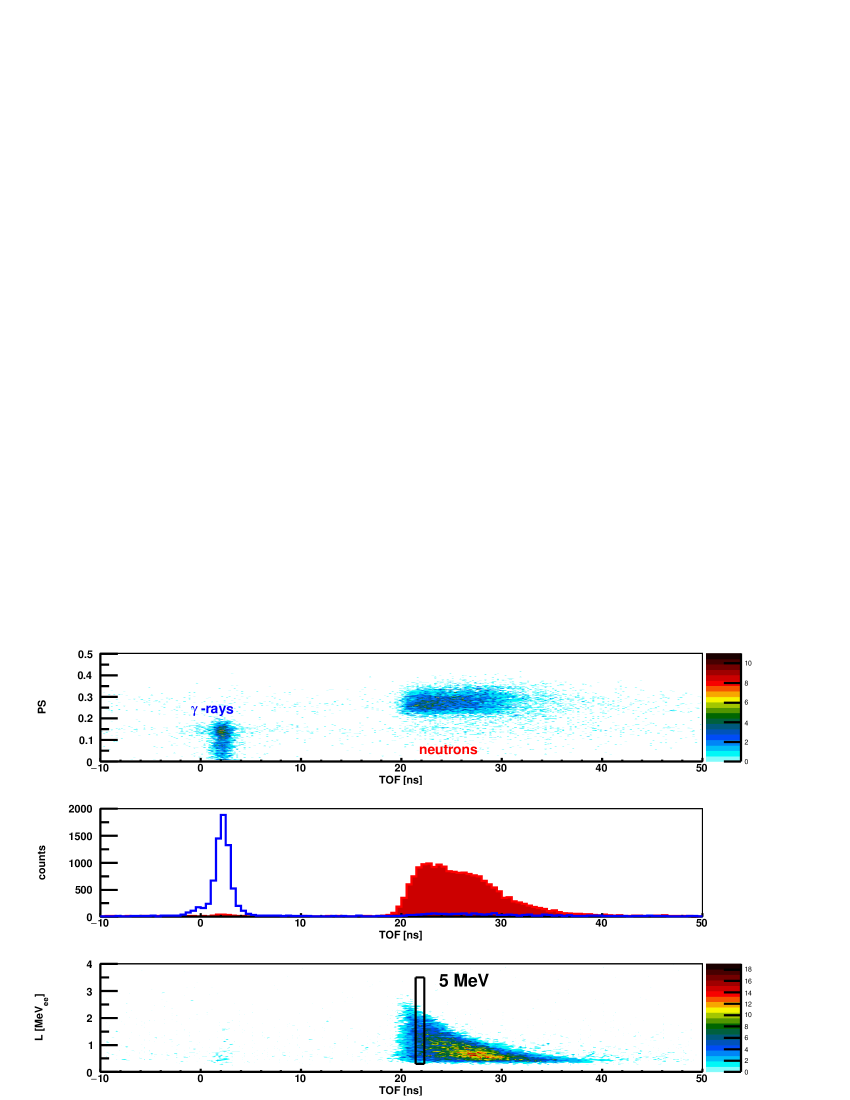
Figure 5 presents TOF distributions acquired when the NE-213 reference detector started the TOF TDC and the YAP(Ce) detector stopped the TOF TDC. The top two panels have been presented and discussed in detail in Ref. [7] and are included here for completeness. The top panel illustrates that the separation between gamma-rays (recoiling electrons) and neutrons (recoiling protons) was excellent. In the middle panel, the data from the top panel have been projected onto the TOF axis. The -flash and fast-neutron distributions are clearly identified. The very low level of background consists of random events which included cosmic rays, room background, Am/Be neutrons not correlated with a 4.44 MeV gamma-ray, and Am/Be neutrons where the 4.44 MeV gamma-ray was missed due to YAP inefficiency or geometry. In the bottom panel, our previously detailed calibration was applied to the data and the resulting scintillation-light yield is displayed for the SG QDC. It is this scintillation-light yield which we now proceed to analyze in detail.
The neutron scintillation-light yield (due to recoiling protons) was determined by converting from TOF to neutron kinetic energy, binning in widths of 0.2 MeV, and filling the corresponding energy-calibrated SG and LG QDC spectra. was determined from the location of the gamma-flash in the TOF spectra using the speed of light and measurements of the distances between the YAP(Ce) detector, the NE-213 detector, and the Am/Be source. The neutron path length employed in this measurement was 2.420 m. Based upon our 1.8 ns gamma-flash and the detector thickness of 6.2 cm, we determined our energy resolution to be 4% at 2 MeV and 5% at 4 MeV. If the TOF bin width is sufficiently small and there was no smearing due to energy-resolution effects, each of these spectra would demonstrate a sharp cutoff corresponding to the neutron transferring all of its energy to the recoiling proton. In our detector, resolution effects smeared this maximum-transfer edge. Further, as in the case for locating the Compton edge for the energy calibration of organic scintillators with gamma-ray sources, there is no single prescription for relating the maximum proton energy to the resolution-smeared maximum-transfer edge. Thus, for each energy bin, we have investigated three edge-determination prescriptions:
-
1.
As suggested by Naqvi et al. [35], a Gaussian function was fitted to the high-energy edge of the recoil-proton energy distribution and the maximum-transfer edge was taken to be the half-height (HH) position.
-
2.
As suggested by Kornilov et al. [36], the location of the most energetic minimum in the first derivative (FD) of the recoil-proton energy distribution was associated with the maximum-transfer edge.
-
3.
The maximum-transfer edge was taken as the turning point (TP) of the Gaussian function fitted to the resolution-smeared edge. Note that if the fitted Gaussian function described the resolution-smeared maximum-transfer edge perfectly, then the location of its TP is by definition identical to the minimum in the first derivative of the recoil-proton energy distribution.
In each investigation, the non-linear correspondence between recoiling electron () and recoiling proton () scintillation light-yield has been represented in two ways:
| (2) |
| (3) |
Eq. (2) is the same as Eq. (4) given in Ref. [36], where and are adjustable parameters, and Eq. (3) is from Ref. [37], where is an adjustable parameter.
Figure 6 compares the GEANT4-simulated and measured neutron scintillation-light yield (due to recoiling protons) in the LG QDC for neutrons having (5.0 0.1) MeV kinetic energy (TOF 22 ns). In the GEANT4 simulation, the light-yield parametrization presented in Eq. (2) (see below for a discussion of light-yield parametrizations for NE-213) has been employed, where parameter was fixed at the Kornilov et al. [36] value of 2.47. The light-yield scaling (parameter ) was first based on the HH method for positioning the maximum-transfer edge (see the red curve at 5 MeV in the top panel of Fig. 7). The simulated detector response is shown without resolution effects, and the location of the maximum-transfer edge may be observed at about 2.36 MeVee. As the degree of smearing of the simulated detector response due to energy-resolution effects affects the location of the maximum-transfer edge in the simulated detector response predicted by the various prescriptions, the non-linear energy-dependent parametrization of the detector resolution measured for gamma-ray energies between 0.5 MeVee and 4.0 MeVee that we employed in our calibration efforts was again employed to accurately smear the simulated detector response. The simulated detector response with resolution effects is also shown. The arrows indicate the locations of the maximum-transfer edge in the data according to the FD (2.29 MeVee), TP (2.32 MeVee), and HH (2.36 MeVee) prescriptions. As expected, when the HH evaluation of the data is compared to the simulation with HH-based scaling, the agreement is essentially exact. The average location of the 5 MeV maximum-transfer edge is 2.33 MeVee, and all three predictions based upon the data agree to about 1%. For these same 5 MeV neutrons, with the HH method for positioning the maximum-transfer edge fixed, we then varied the light-yield scaling in the GEANT4 simulation to the values obtained using the TP and FD prescriptions (see the red curves at 5 MeV in the middle and bottom panels of Fig. 7). In all three cases, the GEANT4 simulations were very close to the data up to 2 MeVee, with the FD and TP results lying at most 5% and 3% respectively above the HH results. Above 2 MeVee, comparison was difficult due to a combination of lack of statistics and resolution effects. For simulated (4.0 0.1) MeV neutrons, light-yield scaling factors derived from all three methods resulted in a constant 8% overestimation of the location of the maximum-transfer edges extracted from the data according to the procedure described above. At (3.0 0.1) MeV the difference between the simulation-predicted and data-extracted edge location for the HH prescription remained at an 8% overestimation, while for the TP and FD prescriptions, the discrepancy increased to 12% and 18%, respectively. At lower energies, the degree of non-linearity of the recoil-proton scintillation-light yield increases and this may account for the increasing discrepancy. Note that the use of Eq. (3) gives very similar results from 3 to 5 MeV.
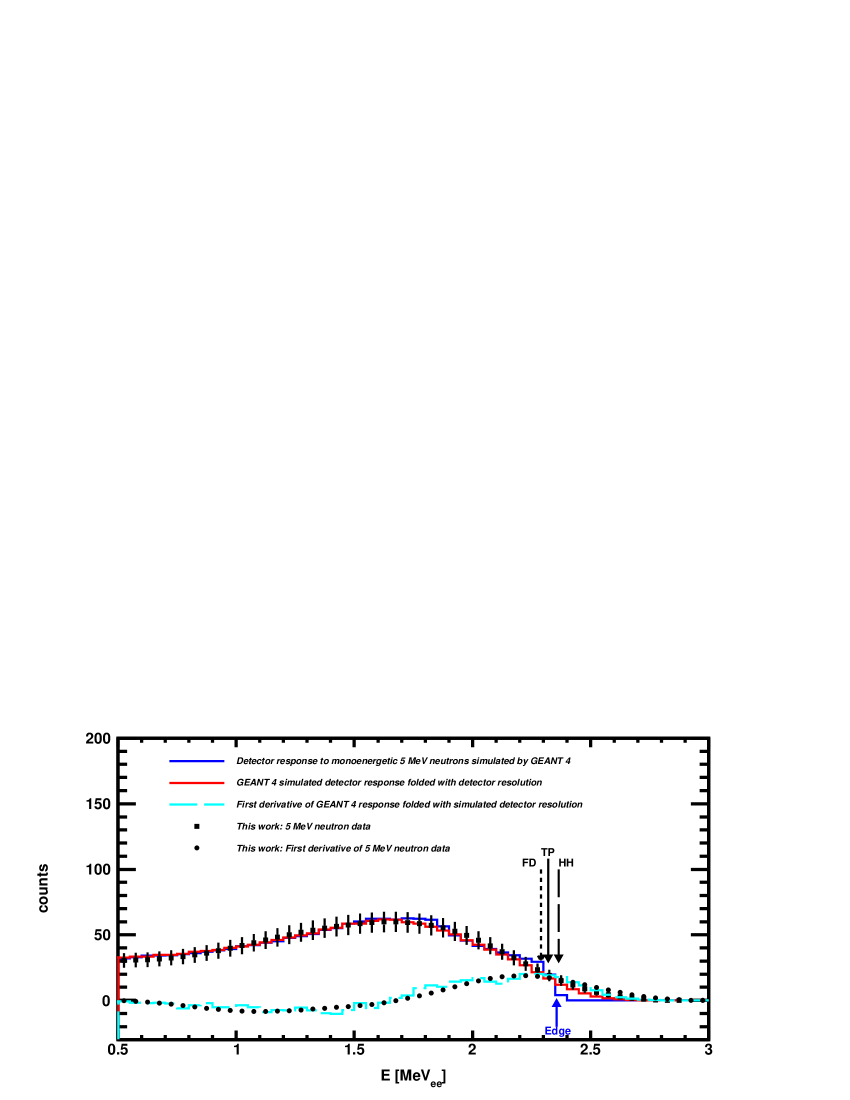
Fig. 7 shows neutron scintillation-light yield (due to recoiling protons) data, as a function of neutron kinetic energy, for the three different maximum-transfer edge determinations together with existing results. The statistical uncertainties in our data are smaller than the point size. Gagnon-Moisan et al. [38] used a PS digitizer and employed a gamma-ray energy calibration similar to that of Ref. [24]. The tail-to-total method was used in their analysis together with the HH prescription for determining the maximum-transfer edge. Their data agree well with our corresponding LG results and we note that the method they used to integrate the total charge produced by the scintillation light is very similar to that employed here. Naqvi et al. [35] used ADCs (which we believe were peak-sensing) and employed the gamma-ray energy calibration suggested in Ref. [24]. The HH prescription was used for determining the maximum-transfer edge. Their data agree well with our corresponding SG results, but it is not possible to determine how much of the scintillation-light pulse was integrated from Ref. [35]. Kornilov et al. [36] used a charge-sensitive preamp together with an Ortec 460 delay-line amplifier and peak-sensing ADCs. Again, it is difficult to quantify how much of the scintillation pulse was integrated when the light yield was measured. “Standard” (unspecified) gamma-ray energy calibrations were employed and the FD prescription was used to determine the maximum-transfer edge. Again their data agree well with our corresponding SG results.
Thus, the results from Ref. [35] and Ref. [36], which used similar measurement techniques, are both in good agreement with our SG results. This could indicate that in these works, the entire charge associated with the scintillation was not integrated. On the other hand, real differences in the behavior of different samples of NE-213 are entirely possible and were observed in Ref. [36].
In Fig. 7, the red curves shown in each panel display the scintillation-light yield parametrization described by Eq. (3) fitted to the present LG data, while the blue curves display the scintillation-light yield parametrization described by Eq. (2) fitted to the SG data. In each case, the overall scale of the fitting function was allowed to float (see below). Note that when the fitted functions employed were interchanged (that is, when Eq. (3) was fitted to our SG data and Eq. (2) was fitted to our LG data) the quality of fit was as good. This is not surprising as the scaled parametrizations differ by only about 3% over this energy range.
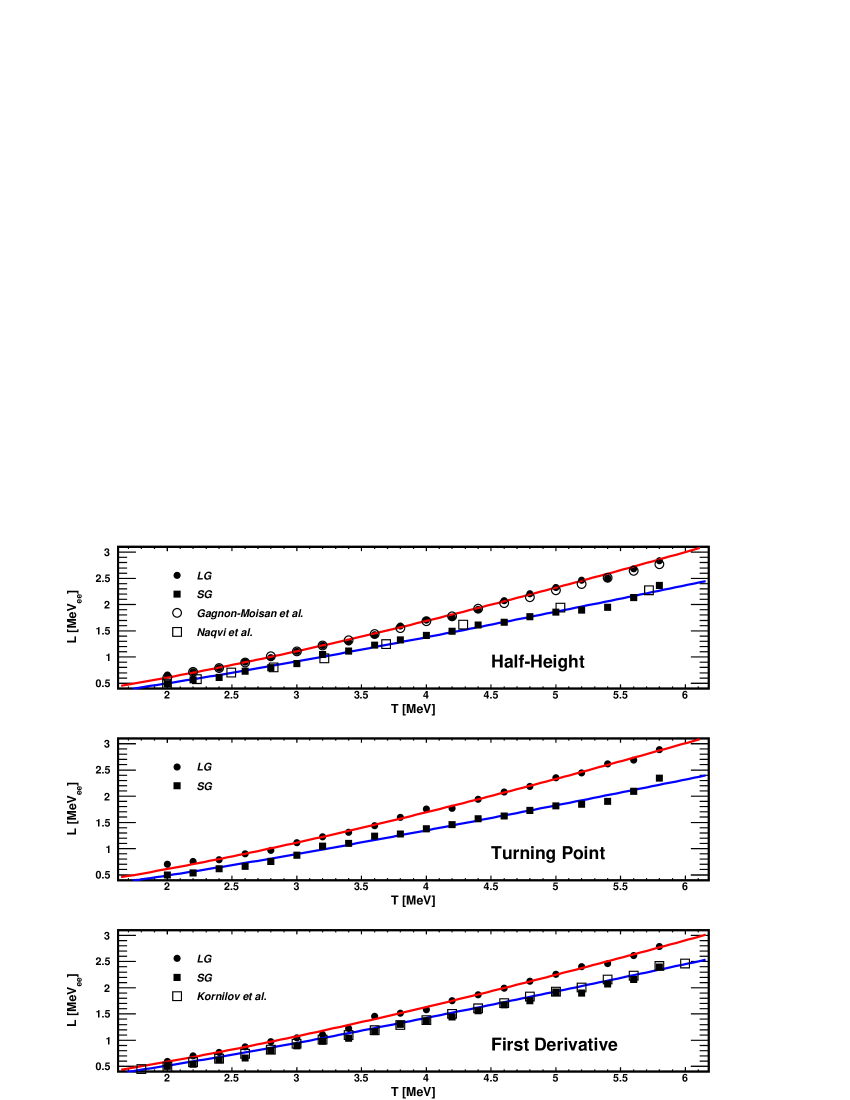
Table 1 presents the scale factors (parameter of Eq. (2) and parameter of Eq. (3)) obtained by fitting parametrizations to the recoil-proton scintillation-light yield obtained with LG and SG. For Eq. (2), parameter was fixed at a value 2.47. In each case, the HH, TP, and FD prescriptions for determining the location of the maximum-transfer edge have been employed, and 20 data points between 2 and 6 MeV were considered.
| Data | Edge | (from Eq. (2)) | d.o.f | (from Eq. (3)) | /d.o.f. |
|---|---|---|---|---|---|
| LG | HH | 0.86 | 1.20 | ||
| SG | HH | 0.98 | 1.10 | ||
| SG/LG | HH | ||||
| LG | TP | 1.37 | 1.41 | ||
| SG | TP | 1.27 | 1.29 | ||
| SG/LG | TP | ||||
| LG | FD | 1.05 | 0.74 | ||
| SG | FD | 1.19 | 0.82 | ||
| SG/LG | FD |
There is little to choose between the /d.o.f. values which are all close to 1. Further, the ratios of scale parameters for the SG and LG data do not differ significantly between any of the edge-determination prescriptions or between the use of Eq. (2) or Eq. (3) for the correspondence between the recoiling electron and recoiling proton scintillation-light yield. Comparing the present LG values of with those presented in Ref. [36] where a similar value of was used, our values are a factor higher. Thus, compared to Ref. [36], we have collected a factor 1.2 more recoil-proton scintillation. On the other hand, from the values of presented in Table 1 which are only a few percent above 1, it can be seen that our results are quite similar to those presented in Ref. [37] and close to those presented in Ref. [38].
5 Summary and Discussion
We have reported a detailed mapping of the response of a NE-213 detector to neutrons from 2–6 MeV emitted by a lead-shielded Am/Be source and subsequently tagged by time-correlated gamma-ray emission. Neutron/gamma pulse shape discrimination was performed using the gated tail-to-total QDC method, with charge-integration periods set to 35 ns and 475 ns. The electron-energy calibration was performed using standard gamma-ray sources and two prescriptions for locating the corresponding Compton edges were examined. The results were compared to GEANT4 simulations which considered both energy-resolution effects and backgrounds. The Compton-edge prescriptions of Knox and Miller [24] and Flynn et al. [26] differ by more than 10% when applied to our data. The present GEANT4 simulations suggest that the former underpredicts the actual edge position by %, while the latter overpredicts by %. Consequently, we used the prescription of Knox and Miller [24] scaled up by a factor 1.03.
The present neutron-tagging technique provided a continuous, polychromatic, energy-tagged neutron beam from 2–6 MeV. Neutron kinetic energy was determined by measuring the neutron TOF relative to the prompt 4.44 MeV gamma-ray associated with the BeC∗ process. Using this information, recoil-proton scintillation-light yields were determined as a function of neutron kinetic energy. Three different prescriptions were employed for identifying the maximum energy-transfer edge of the recoiling protons in accumulated neutron scintillation-light spectra. Two parametrizations (Eq. (2), Eq. (3)) of the recoil-proton scintillation-light yield were investigated. Simple scaling factors allowed for variations in the neutron scintillation-light yield, and after scaling, either parametrization fitted our LG and SG data equally well.
GEANT4 was also used to study the effects of the three prescriptions for the determination of the recoil-proton edge in the neutron scintillation light-yield spectra. For a fixed light-yield parametrization, we varied the prescription between HH, TP, and FD (both with and without energy-resolution effects) for 3, 4, and 5 MeV neutrons. At 5 MeV, simulation and analysis agreed for all prescriptions at the 1% level. At 4 MeV, all three GEANT4 predictions for the maximum-transfer edge overestimated the location of the maximum-transfer edge extracted from the data by 8%. At 3 MeV, the difference between the edge locations extracted from the simulation and data for the HH prescription remained at 8%, while for the TP and FD prescriptions, the difference increased to 12% and 18%, respectively. A possible cause of the disprecancy is an incomplete consideration of increasing quenching of the scintillation as increases along the track of the recoiling proton. This will be investigated in future work. Nevertheless, the HH method produced the best results for our detector over our energy range.
The present results indicate that for recoiling protons in the present energy range, % (see Table 1) of the total integrated scintillation intensity (integration period 475 ns) is contained with the first 35 ns of the signal. Comparing the total light yield (LG) to previous measurements, the present results are in good agreement with those of Gagnon-Moisan et al. [38] and within a few percent of those of Cecil et al. [37], the latter of which being used to estimate recoil-proton scintillation-light output in the absence of a calibration. The present LG results are higher by a factor compared to those of Kornilov et al. [36] and Naqvi et al. [35]. These previous measurements yield results which are actually close to our SG results (integration period 35 ns), but it is impossible to say if this discrepancy is due to a difference in effective integration times, as the pulse-processing method was different. At least part of the disprecancy could be due to real differences in the response of the liquid scintillator. Factors such as concentration of the active scintillant/fluorescent materials in the base solvent and the presence of dissolved oxygen will affect the relative recoiling proton-to-electron scintillation-light yields. Indeed, it would seem that a dedicated measurement of the recoil-proton scintillation-light yield must be made on a case-by-case basis to obtain the best accuracy in precision neutron measurements.
The present measurements have been made at a new neutron test facility recently installed at Lund University [7]. This facility is being used to measure the characteristics of neutron detectors as part of the program to build the European Spallation Source. Development and extension of this facility is ongoing with a view to precisely determining the response of many materials to neutrons ranging in energies from fast to thermal.
Acknowledgements
We thank the Photonuclear Group at the MAX IV Laboratory for providing access to their experimental hall and Am/Be source. We acknowledge the support of the UK Science and Technology Facilities Council (Grant nos. STFC 57071/1 and STFC 50727/1) and the European Union Horizon 2020 BrightnESS Project, Proposal ID 676548.
References
- [1] Eljen Technologies EJ-301 (http://www.eljentechnology.com/index.php/products/liquid-scintillators/71-ej-301). Saint Gobain BC-501 (http://www.detectors.saint-gobain.com/uploadedFiles/SGdetectors/Documents/Product_Data_Sheets/BC501-501A-519-Data-Sheet.pdf).
- [2] R. Batchelor et al., Nucl. Instrum. and Meth. 13 (1961) 70, doi:10.1016/0029-554X(61)90171-9.
- [3] E. Bayat et al., Rad. Phys. and Chem. 81 (2012) 217, doi:10.1016/j.radphyschem.2011.10.016
- [4] J. Iwanowska et al., Nucl. Instr. and Meth. in Phys. Res. A 781 (2013) 44, doi:10.1016/j.nima.2013.01.064
- [5] I.A. Pawelczak et al., Nucl. Instr. and Meth. in Phys. Res. A 711 (2013) 21, doi:10.1016/j.nima.2013.01.028
- [6] R. al Jebali et al., Nucl. Instr. and Meth. in Phys. Res. A 794 (2015) 102, doi:10.1016/j.nima.2015.04.058
- [7] J. Scherzinger et al., Applied Radiation and Isotopes 98 (2015) 74, doi: 10.1016/j.apradiso.2015.01.003.
- [8] Testing performed at National Physical Laobratory, Teddington, Middlesex, UK TW11 0LW on 24 January 2012.
- [9] E.A. Lorch, Int. J. Appl. Radiat. Is. 24 (1973) 585, doi: 10.1016/0020-708X(73)90127-0.
- [10] A.D. Vijaya and A. Kumar, Nucl. Instrum. and Meth. 111 (1973) 435, doi: 10.1016/0029-554X(73)90199-7.
- [11] A.A Mowlavi and R. Koohi-Fayegh, Appl. Radiat. Isot. 60 (2004) 959, doi: 10.1016/j.apradiso.2004.02.008.
- [12] Zhenzhou Liu et al., Appl. Radiat. Isot. 65 (2007) 1318, doi: 10.1016/j.apradiso.2007.04.007.
- [13] http://www.eljentechnology.com/index.php/products/paints/87-ej-520.
- [14] http://www.us.schott.com/borofloat/english/index.html for details. Supplied by Glasteknik i Emmaboda AB, Utvägen 6 SE-361 31 Emmaboda, Sweden.
- [15] Araldite is a registered trademark of Huntsman. See http://www.araldite2000plus.com.
- [16] Viton is a registered trademark of DuPont Performance Elastomers LLC.
- [17] Poly-methyl-methacrylate, also known as PMM, acrylic, plexiglass, and lucite. Supplied by Nordic Plastics Group AB, Bronsyxegatan 6, SE-213 75 Malmö, Sweden.
- [18] http://www.eljentechnology.com/index.php/products/paints/86-ej-510.
- [19] http://www.et-enterprises.com/files/file/Pmtbrochure11.pdf for details.
- [20] Scionix Holland BV. http://www.scionix.nl.
- [21] M. Moszyński et al., Nucl. Instr. and Meth. in Phys. Res. A 404 (1998) 157, doi:10.1016/S0168-9002(97)01115-7.
- [22] Hamamatsu Photonics. http://www.hamamatsu.com.
- [23] R. Brun and F. Rademakers, Nucl. Instr. and Meth. in Phys. Res. A 389 (1997) 81-86. See also http://root.cern.ch/.
- [24] H.H. Knox and T.G. Miller, Nucl. Instrum. and Meth. 101 (1972) 519, doi: 10.1016/0029-554X(72)90040-7.
- [25] Radiation detection and measurement, G.F. Knoll, Wiley, New York, U.S.A. (1989), ISBN: 9780471815044,
- [26] K.F. Flynn et al., Nucl. Instrum. and Meth. 27 (1964) 13, doi:10.1016/0029-554X(64)90129-6.
- [27] L.E. Beghian et al., Nucl. Instrum. and Meth. 35 (1965) 34, doi:10.1016/0029-554X(65)90004-2.
- [28] G. Dietze and H. Klein, Nucl. Instrum. and Meth. 193 (1982) 549, doi:10.1016/0029-554X(82)90249-X.
- [29] F. Arneodo et al., Nucl. Instr. and Meth. in Phys. Res. A 418 (1998) 285, doi:10.1016/S0168-9002(98)00679-2.
- [30] C. Matei et al., Nucl. Instr. and Meth. in Phys. Res. A 676 (2012) 135, doi:10.1016/j.nima.2011.11.076.
- [31] S. Agostinelli et al., Nucl. Instr. and Meth. in Phys. Res. A. 506, (2003) 250, doi: 10.1016/S0168-9002(03)01368-8
- [32] J. Allison et al., IEEE Trans. Nucl. Sci. 53, (2006) 270, doi: 10.1109/TNS.2006.869826
- [33] A. Jhingan et al., Nucl. Instr. and Meth. in Phys. Res. A 585 (2008) 165, doi:10.1016/j.nima.2007.11.013.
- [34] A. Lavagno et al., Nucl. Instr. and Meth. in Phys. Res. A 617 (2010) 492, doi:10.1016/j.nima.2009.10.111.
- [35] A.A. Naqvi et al., Nucl. Instr. and Meth. in Phys. Res. A 353 (1994) 156, doi:10.1016/0168-9002(94)91626-8.
- [36] N.V. Kornilov et al., Nucl. Instr. and Meth. in Phys. Res. A 599 (2009) 226, doi:10.1016/j.nima.2008.10.032.
- [37] R.A. Cecil et al., Nucl. Instr. and Meth. 161 (1979) 439, doi:10.1016/0029-554X(79)90417-8.
- [38] F. Gagnon-Moisan et al., 2nd International Workshop on Fast Neutron Detectors and Applications (FNDA2011), Ein Gedi, Israel, (2011), doi:10.1088/1748-0221/7/03/C03023