The complex evolutionary paths of local infrared bright galaxies: a high angular resolution mid-infrared view
Abstract
We investigate the evolutionary connection between local IR-bright galaxies () and quasars. We use high angular resolution ( 0.3-0.4 arcsec few hundred parsecs) m ground-based spectroscopy to disentangle the AGN mid-IR properties from those of star formation. The comparison between the nuclear m PAH feature emission and that measured with Spitzer/IRS indicates that the star formation is extended over a few kpc in the IR-bright galaxies. The AGN contribution to the total IR luminosity of IR-bright galaxies is lower than in quasars. Although the dust distribution is predicted to change as IR-bright galaxies evolve to IR-bright quasars and then to optical quasars, we show that the AGN mid-IR emission of all the quasars in our sample is not significantly different. In contrast, the nuclear emission of IR-bright galaxies with low AGN contributions appears more heavily embedded in dust although there is no clear trend with the interaction stage or projected nuclear separation. This suggests that the changes in the distribution of the nuclear obscuring material may be taking place rapidly and at different interaction stages washing out the evidence of an evolutionary path. When compared to normal AGN, the nuclear star formation activity of quasars appears to be dimming whereas it is enhanced in some IR-bright nuclei, suggesting that the latter are in an earlier star-formation dominated phase.
keywords:
galaxies: active – quasars: general – galaxies: Seyfert – infrared: galaxies – galaxies: evolution.1 Introduction
The evolutionary connection between “cool” (IRAS m to m colors ) ultraluminous infrared (IR) galaxies (ULIRGs, defined to have m IR luminosities ), to “warm” () ULIRGs, and optical quasars was proposed almost thirty years ago (Sanders et al., 1988). In this scenario IR bright activity and in particular ULIRG activity is triggered by interactions between gas-rich galaxies that merge, go through an optical quasar phase and eventually evolve into elliptical galaxies (see review by Sanders & Mirabel, 1996). Numerical simulations predict that during the merger phase both intense star formation and a dust enshrouded active galactic nucleus (AGN) phase co-exist in the dusty nuclear regions of most ULIRGs before energetic feedback from an AGN and/or star formation clears the nuclear region of gas and dust (see e.g. Di Matteo et al., 2005; Hopkins et al., 2008). Plenty of observations now support this scenario at least in terms of the AGN detection rate and increased AGN bolometric contribution to the system luminosity with increasing IR luminosity for local luminous infrared galaxies (LIRGs, with IR luminosities ) and ULIRGs (Kim et al., 1995; Veilleux et al., 1995, 2009a; Imanishi et al., 2007; Yuan et al., 2010; Nardini et al., 2008, 2010; Petric et al., 2011; Alonso-Herrero et al., 2012).
There has been considerable effort devoted to understanding the relation between the IR luminosity and the morphology, merger state, star formation rate and AGN dominance of ULIRGs and how all these properties relate to those of optical quasars. In particular, using Spitzer Infrared Spectrograph (IRS, Houck et al., 2004) mid-infrared (mid-IR) spectroscopic observations,Veilleux et al. (2009a) showed that ULIRGs do not seem to follow a simple evolutionary path to optical quasars, either in terms of the AGN bolometric dominance or the Eddington ratios. Moreover, Farrah et al. (2009) based on the same data set proposed that the lifecycle of local ULIRGs consists of three phases with the first one during pre-coalescence being dominated by star formation activity. The subsequent final evolution of the ULIRG may or may not go through a quasar phase depending on the properties of the progenitor galaxies. For quasars, Haas et al. (2003) proposed an evolutionary sequence which is driven by the geometry of the dust in their nuclear regions to explain the variety of observed optical and IR spectral indices.
| Galaxy | IRAS Name | Redshift | Dist | Class | Morph | Ref | Other name | |
|---|---|---|---|---|---|---|---|---|
| (Mpc) | () | |||||||
| IZw1 | IRAS00509+1225 | 0.058900 | 248 | Sy1 | 11.86 | IVb | E06 | PG0050+124 |
| Mrk 1014 | IRAS01572+0009 | 0.163110 | 748 | Sy1 | 12.53 | IVb | Y10 | PG0157+001 |
| NGC 1614 | IRAS043150840 | 0.015938 | 65.5 | Cp | 11.58 | IIIb | Y10 | |
| Mrk 1073 | IRAS03117+4151 | 0.023343 | 95.3 | Sy2 | 11.39 | Pair/IIIa? | V95 | |
| IRAS 08572+3915 | - | 0.058350 | 254 | NW/SE-Sy2: | 12.11 | IIIb | Y10 | |
| UGC 5101 | IRAS09320+6134 | 0.039367 | 168 | Sy2: | 12.00 | IV | Y10 | |
| Arp 299 | IRAS11257+5850 | 0.010411 | 45.2 | Sy2/L | 11.83 | IIIb | GM06 | |
| Mrk 231 | IRAS12540+5708 | 0.042170 | 181 | Sy1 | 12.50 | IVb | Y10 | UGC08058 |
| IRAS 13349+2438 | - | 0.107641 | 483 | Sy1 | 12.32 | IV/V? | W09 | [HB89]1334+246 |
| Mrk 463 | IRAS13536+1836 | 0.050355 | 219 | E-Sy1/W-Sy2 | 11.78 | IIIb | GM07 | |
| IRAS 143481447 | - | 0.083000 | 366 | SW/NE-Cp: | 12.26 | IIIb | Y10 | |
| Mrk 478 | IRAS14400+3539 | 0.079055 | 347 | Sy1 | 11.52 | V | E06 | PG1440+356 |
| NGC 6240 | IRAS16504+0228 | 0.024480 | 103 | L | 11.83 | IIIb | Y10 | |
| IRAS 172080014 | - | 0.042810 | 181 | HII | 12.40 | IV | Y10 |
Notes. — Dist is the luminosity distance taken from NED for , , and . The IR luminosity is in the m range. The morphology class follows the criteria defined by Veilleux et al. (2002): IIIa wide binary (nuclear separation 10 kpc); IIIb close binary (nuclear separation 10 kpc); IVa: diffuse merger; IVb: compact merger; V: old merger; Pair: In a pair. The references are for the optical class except for Mrk 478 and IZw1 which is for the IR luminosity: GM06: García-Marín et al. (2006), Y10: Yuan et al. (2010), W09: Wu et al. (2009), GM07: García-Marín (2007), V95: Veilleux et al. (1995), E06: Evans et al. (2006).
| Galaxy | Redshift | Dist | Class | Other name | |
|---|---|---|---|---|---|
| (Mpc) | () | ||||
| Mrk 335 | 0.025785 | 103 | Sy1 | 10.75 | PG0003+199 |
| PG0804+761 | 0.100000 | 443 | Sy1 | 11.83 | |
| PG0844+349 | 0.064000 | 279 | Sy1 | 10.94 | |
| PG1211+143 | 0.080900 | 358 | Sy1 | 11.61 | |
| 3C273 | 0.158339 | 734 | Sy1 | 12.68 | PG1226+023 |
| PG1229+204 | 0.063010 | 276 | Sy1 | 10.90 | |
| PG1411+442 | 0.089600 | 396 | Sy1 | 11.61 | |
| Mrk 1383 | 0.086570 | 383 | Sy1 | 11.55 | PG1426+015 |
| Mrk 841 | 0.036422 | 157 | Sy1.5 | 10.96 | PG1501+106 |
| Mrk 509 | 0.034397 | 141 | Sy1.5 | 11.17 |
Notes.—The IR luminosities are from Weedman et al. (2012) corrected to our cosmology except for Mrk 841 which is computed from the IRAS fluxes listed in NED.
In spite of the high AGN incidence in the population of local IR-bright galaxies, little is known about the detailed properties of the dust surrounding the AGN and star formation activity of their nuclear regions and how they relate to the putative torus of the Unified Model. Studies of local universe type 1 quasars have shown that their unresolved near- and mid-IR emission can be reproduced with clumpy dusty torus models with small covering factors (Mor et al., 2009; Martínez-Paredes et al., 2016; Mateos et al., 2016), whereas quasars optically classified as type 2 have larger covering factors (Mateos et al., 2016). On the other hand, the nuclear mid-IR AGN emission of local ULIRGs has only been modeled for a handful of objects. The results vary from source to source with some being modeled with high covering factor torus models and high foreground extinctions (Alonso-Herrero et al., 2013b; Mori et al., 2014; Martínez-Paredes et al., 2015), others requiring fully embedded heating sources (Levenson et al., 2007), and some having relatively small covering factors and properties similar to those of other Seyfert 1 nuclei (for instance the nucleus of the LIRG NGC 7469, see Hönig et al., 2010; Alonso-Herrero et al., 2011; Ichikawa et al., 2015).
In this work we take advantage of the nearly factor of 10 improved angular resolution afforded by mid-IR instruments on 8-10 m class telescopes when compared to Spitzer/IRS to investigate the evolutionary connection between local IR-bright galaxies and quasars. We use new and existing high angular resolution (arcsec) ground-based mid-IR spectroscopy mostly obtained with the CanariCam (Telesco et al., 2003; Packham et al., 2005) instrument on the 10.4 m Gran Telescopio CANARIAS (GTC). By using high angular resolution we are able to isolate nuclear scales of a few hundred parsecs where the AGN and star formation processes are believed to be more tightly coupled (Hopkins & Quataert, 2010). We observed a sample of local LIRGs and ULIRGs with IR luminosities , as at these luminosities most systems are interacting galaxies or mergers (see e.g. Hung et al., 2014; Larson et al., 2016, and references therein). We dub these systems IR-bright galaxies. As a comparison sample we observed optical quasars which are mostly Palomar-Green (PG) quasars from the Bright Quasar Sample (Schmidt & Green, 1983). Among the IR-bright galaxy sample there are four IR-bright PG quasars (see Section 2 for more details on our definition). These quasars tend to show more pronounced merger-induced morphological anomalies and thus might be at an earlier evolutionary stage than IR-faint quasars (Veilleux et al., 2009b). Cao et al. (2008) reached a similar conclusion by comparing the properties of the mid-IR Spitzer/IRS spectra of IR-bright and IR-weak quasars. Therefore, IR-bright quasars might represent a transition phase to the evolution to classical optical quasars.
The paper is organized as follows. Section 2 describes the samples of IR-bright galaxies and quasars. Section 3 gives details on the new and existing mid-IR observations used in this work. Section 4 presents the analysis of the mid-IR spectroscopy, whereas Section 5 discusses the mid-IR AGN and nuclear star formation properties of local IR-bright galaxies and the comparison sample of quasars. In Section 6 we investigate the possible evolutionary connection between the mid-IR AGN properties and nuclear star formation activity of IR-bright galaxies and quasars and finally in Section 7 we present our conclusions. Throughout this work we use the following cosmology: , , and .
2 The samples
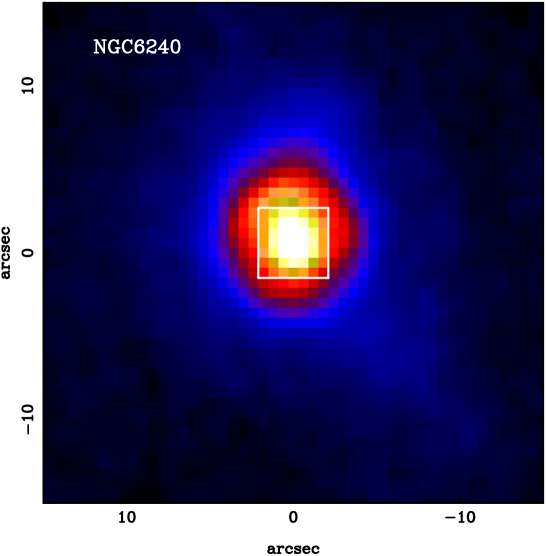
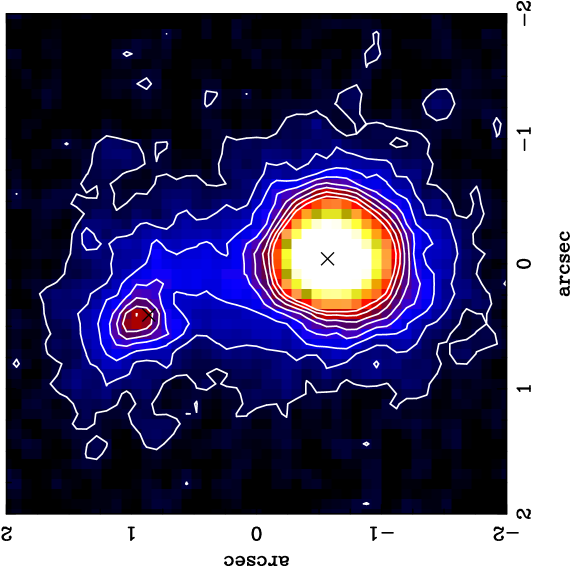
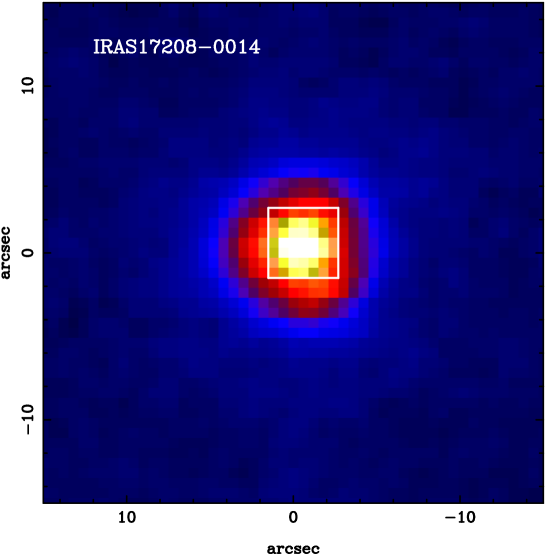
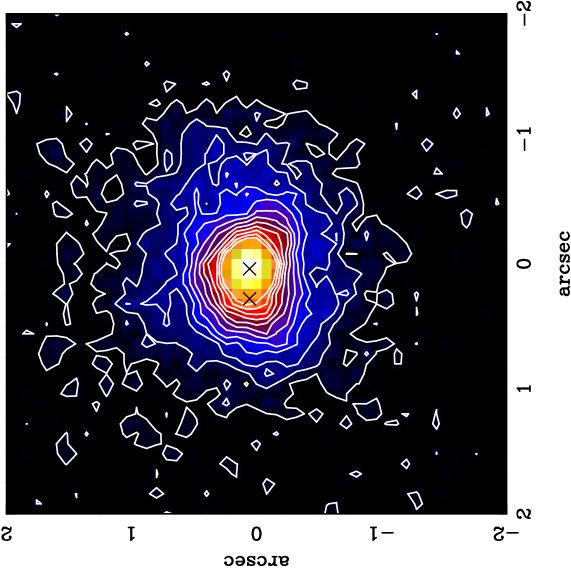
Our sample of IR-bright galaxies contains 14 local systems with IR luminosities in the range (see Fig. 1 and Table 1), hosting an AGN (see below) and with available high angular resolution (0.3-0.4 arcsec) mid-IR imaging and spectroscopy (see Section 3). All but one are part of our GTC/CanariCam mid-IR survey of local AGN (see Alonso-Herrero et al., 2016, for details). According to their IR luminosities, 7 systems are LIRGs and 7 are ULIRGs. We selected our sample of IR-bright galaxies to cover mostly close (projected nuclear distances of kpc) interaction and merger phases. Using the morphological classification of Veilleux et al. (2002) we have (see Table 1) 6 close interacting galaxies termed class IIIb, 5 mergers termed class IV, and 1 old merger termed class V. Mrk 1073 is part of the Perseus cluster and probably paired with UGC 2612 (Levenson et al., 2001) at a projected distance greater than 10 kpc, so likely in the IIIa class. Finally, the ULIRG/IR-bright quasar IRAS 13349+2438 (see Low et al., 1989, and below) has no morphological classification but it shows a compact appearance which probably indicates a merger The projected nuclear separations between the nuclei of galaxies classified as IIIb are as follows, 6.1 kpc for IRAS 08572+3915, 5.5 kpc for IRAS 143481447, 4.5 kpc for Arp 299, 3.8 kpc for Mrk 463 (García-Marín et al., 2009), 3 kpc for NGC 1614 (this galaxy is classified as a minor merger by Larson et al., 2016, and references therein), 0.7 kpc for NGC 6240 (Komossa et al., 2003), and 0.2 kpc for IRAS 172080014 (Medling et al., 2014, 2015).
The high angular resolution (arcsec) of our mid-IR data (see Sections 3.1 and 3.2) allows us to resolve the emission from the individual nuclei of those IR-bright galaxies in our sample in class IIIb except for IRAS 172080014 (see also Section 3.3). Of the systems with double nuclei, only two systems have IR-bright nuclei for which we could obtain sufficiently high signal-to-noise (S/N) ratio spectra (see Section 3), namely for the eastern and western components of Arp 299 (IC 694 and NGC 3690, respectively, see Alonso-Herrero et al., 2013b, and Fig. 2) and NGC 6240N and NGC 6240S (see Alonso-Herrero et al., 2014, and Fig. 3). For the other three close interacting systems in our sample only one nucleus is sufficiently IR-bright to obtain ground-based mid-IR spectroscopy (see next section), namely, IRAS 08572+3915N, Mrk 463E, and IRAS 143481447S (see Alonso-Herrero et al., 2016, for more details). For the minor merger NGC 1614 we only observed the main galaxy. Therefore, our sample of local IR-bright galaxies contains 16 individual nuclei.
In terms of the optical spectral classification, all the IR-bright galaxy sample nuclei but one are classified as AGN, that is, Seyfert (Sy), LINER (L), or Composite (Cp, that is, located between the H ii and Seyfert classes in optical line ratio diagnostic diagrams). The only exception is IRAS 172080014, which is classified as H ii in the optical but has evidence of AGN activity based on X-ray, IR and submillimeter data (González-Martín et al., 2009; Veilleux et al., 2009a; García-Burillo et al., 2015). The median distance of the IR-bright galaxy sample is 181 Mpc.
Our ground-based mid-IR spectroscopic observations were by necessity flux-limited (mid-IR fluxes above approximately 20 mJy within small apertures, see Alonso-Herrero et al., 2016) and required compact morphologies. This may introduce some biases in the results derived for our sample of IR-bright galaxies. In particular, our sample of IR-bright galaxies (also the sample of quasars, see below) might be biased towards more AGN-dominated sources and/or sources with compact nuclear star formation. For instance, those nuclei in the interacting systems for which we could not get observations are classified as Sy or Cp but were both faint and not compact. This means that the AGN likely contribute little to their nuclear mid-IR emission. Therefore these AGN have very low fractional contributions to the total IR luminosities of the systems (see Section 5.1). Finally, we note that Díaz-Santos et al. (2011) showed that local LIRGs and ULIRGs with a significant AGN contribution tend to show relatively compact mid-IR continuum emission. Thus it is likely that our sample of IR-bright galaxies with AGN classifications is not too different from the general population of local IR-bright galaxies with significant AGN contributions.
We also compiled mid-IR spectroscopic observations with a similar high angular resolution for a comparison sample of 10 optically selected local quasars, mostly PG quasars taken from the work of Martínez-Paredes et al. (2016). These quasars were chosen to match bolometrically the luminosities of our sample of IR-bright galaxies (see Figure 1 of Alonso-Herrero et al., 2016, for the keV luminosities of the PG quasars). We list the properties of the sample of quasars in Table 2. The median luminosity distance of the quasar sample is 319 Mpc.
Although the IR luminosities of six of the 10 optically selected quasars would put them in the (U)LIRG class (see Table 2 and Fig. 1), they are IR-weak quasars (see Low et al., 1989), based on their IR to optical -band luminosity ratios (typically ratios between 1 and 3, as calculated using total -band magnitudes from NED). Among the IR-bright galaxies in our sample there are also four optically selected quasars (IZw1, Mrk 1014, Mrk 478, and IRAS 13349+2439), of which three are in the PG catalog (see Table 1). These are, however IR-bright quasars based on their observed IR to -band ratios ( ratios between 4 and 11). Our IR-bright and IR-weak quasar classifications are consistent with the far-IR strong and weak classes of Netzer et al. (2007) based on the observed m to m ratios of PG quasars. Finally, Mrk 231 is also considered the nearest quasar (Boksenberg et al., 1977) and has a dusty broad absorption line region obscuring the continuum source and the standard broad absorption line region (Veilleux et al., 2013). Thus, Mrk 231 might be a bona-fide emerging IR-bright quasar in the local universe.
3 Observations
3.1 New GTC/CanariCam imaging observations
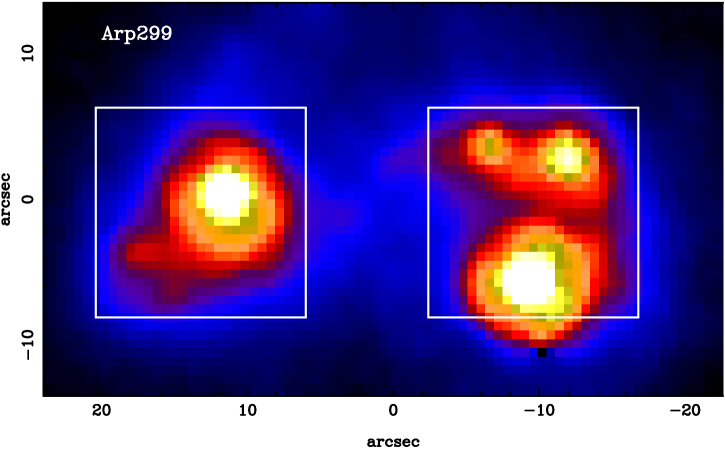
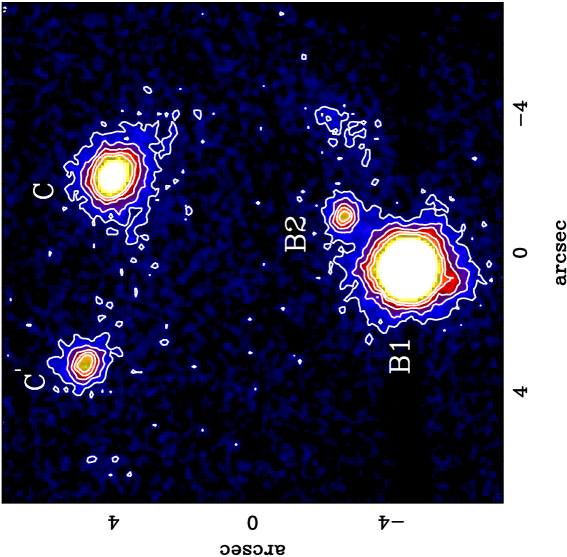
We obtained new mid-IR high angular resolution imaging observations of the interacting LIRG Arp 299 with GTC/CanariCam on the night of 2016 January 26 in queue mode. These observations were part of our GTC/CanariCam AGN guaranteed time program (PI: C. Telesco). We used the Si-2 filter which has a central wavelength of m and a width of m, at 50% cut-on/off. The CanariCam Si:As detector has a plate scale of arcsec pixel-1 which provides a field of view (FoV) of . We therefore required two pointings to cover the nuclei and bright star forming regions of Arp 299. The mid-IR spectroscopy of the bright nuclei of Arp 299 was presented in Alonso-Herrero et al. (2013b).
The observations were taken using the standard mid-IR chop-nod technique with on-source integration times of 608 s for each of the two pointings. We also obtained an image of a standard star with the same filter to perform the photometric calibration and assess the image quality of the observations. We reduced the data using the CanariCam pipeline redcan (González-Martín et al., 2013) that includes for imaging observations stacking of the individual observations, rejection of bad images and flux calibration. Figure 2 shows the fully reduced image of the two galaxies of Arp 299. Using the image of the standard star we measured an image quality of the observations of 0.48 arcsec (FWHM). The GTC/CanariCam Si-2 filter imaging data of the rest of the IR-bright galaxies in the sample are presented in Alonso-Herrero et al. (2016) except for IZw1 which is in the sample of optically selected quasars analyzed by Martínez-Paredes et al. (2016).
3.2 Existing high angular resolution mid-IR spectroscopic observations
We compiled high angular resolution (image quality of arcsec, FWHM) mid-IR m spectroscopy of the sample of 14 local IR-bright systems listed in Table 1 and the comparison sample of 10 IR-weak quasars in Table 2. These data were obtained with ground-based instruments on m class telescopes. The majority of systems in both samples were observed with the CanariCam instrument on the GTC in spectroscopic mode with a spectral resolution of as part of the CanariCam AGN guaranteed time program, an ESO/GTC large program (ID: 182.B-2005 Alonso-Herrero et al., 2016) or through the GTC Mexican open time (see Martínez-Paredes et al., 2016). The ULIRG IZw1 and the PG quasar Mrk 509 were observed in the mid-IR using VISIR (Lagage et al., 2004) on the VLT by Burtscher et al. (2013) and Hönig et al. (2010), respectively, with a spectral resolution of and similar image quality to the CanariCam spectra. We reduced all the CanariCam imaging and spectroscopic data using the redcan pipeline (González-Martín et al., 2013). We refer the reader to Alonso-Herrero et al. (2016) and Martínez-Paredes et al. (2016) for full details on the CanariCam observations, including the extraction of the spectra, the correction for possible slit losses, and their photometric calibration.
The GTC/CanariCam and VLT/VISIR mid-IR spectroscopic observations were taken with similarly sized slit widths of 0.52 arcsec and 0.75 arcsec, respectively. At the median distances of the IR-bright galaxy sample and the IR-weak quasar sample (see Section 2), the physical sizes probed by our ground-based slits range between 112 pc and 1396 pc, and between 248 pc and 1376 pc, respectively.
3.3 Archival Spitzer/IRAC and IRS observations
For both samples we obtained fully reduced Spitzer/IRS low spectral resolution () spectra from the Cornell Atlas of Spitzer/IRS Sources (CASSIS, Lebouteiller et al., 2011, version LR7), except for the nuclear regions of Arp 299 for which we used the spectra of Alonso-Herrero et al. (2009). In this work we only used the spectral range covered by the short-low (SL) mode, m, as this is the range used by the spectral decomposition tool (see Section 4.1) and the spectra with optimal extraction regions. The slit width of the SL spectra is 3.7 arcsec.
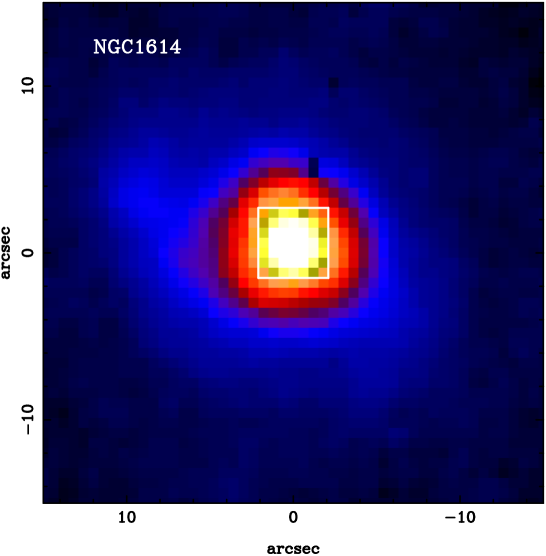
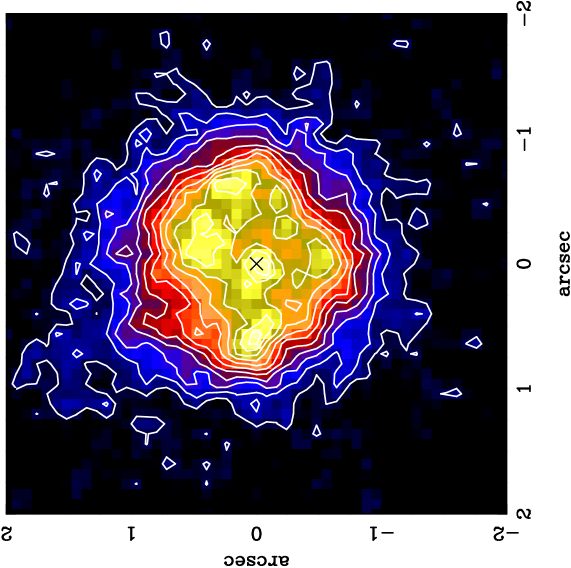
We also retrieved from the Spitzer archive fully calibrated Infrared Array Camera (IRAC, Fazio et al., 2004) images at m rebinned to a pixel size of 0.6 arcsec. The FWHM of the IRAC images is approximately 2 arcsec. In Figs. 2 and 3 we show a few examples in the IR-bright galaxy sample comparing the Spitzer/IRAC m morphologies and the nuclear morphologies resolved by our GTC/CanariCam m images. These figures emphasize the gain in angular resolution of the ground-based mid-IR observations.
| Galaxy | AGN | Mid-IR Contribution | AGN Frac. at m | AGN | AGN | ||||
|---|---|---|---|---|---|---|---|---|---|
| () | AGN | PAH | STR | ||||||
| IZw1 | 2.2 | 0.82 | 0.00 | 0.18 | 0.87[0.78, 0.96] | 0.20[ 0.05, 0.39] | -1.68[-2.13,-1.29] | 0.37 | |
| Mrk 1014 | 4.9 | 0.90 | 0.10 | 0.00 | 0.90[0.85, 0.97] | 0.22[0.00, 0.52] | -1.22[-1.86,-0.81] | 0.12 | |
| Mrk 1073 | 2.0 | 0.61 | 0.15 | 0.24 | 0.71[0.54, 0.87] | -0.96[-1.59,-0.33] | -2.00[-2.73,-1.28] | 0.05 | |
| NGC 1614 | 7.6 | 0.61 | 0.39 | 0.00 | 0.63[0.57, 0.72] | -0.75[-1.07,-0.53] | -2.94[-3.75,-2.55] | 0.03 | |
| IRAS 08572+3914N | 65.2 | 1.00 | 0.00 | 0.00 | 0.99[0.98, 1.00] | -4.16[-4.31,-4.04] | -0.14[-0.27,-0.02] | 0.16 | |
| UGC 5101 | 5.3 | 0.82 | 0.18 | 0.00 | 0.76[0.55, 0.89] | -2.42[-3.50,-1.39] | -1.41[-2.14,-0.78] | 0.03 | |
| IC 694 | 12.3 | 0.78 | 0.20 | 0.02 | 0.86[0.82, 0.91] | -3.46[-3.62,-3.34] | -1.66[-1.79,-1.54] | 0.02 | |
| NGC 3690B1 | 2.1 | 0.65 | 0.00 | 0.35 | 0.79[0.76, 0.82] | -1.67[-1.89,-1.41] | -1.89[-2.05,-1.71] | 0.06 | |
| Mrk 231 | 4.6 | 0.90 | 0.06 | 0.04 | 0.93[0.89, 0.97] | -0.68[-0.81,-0.54] | -2.20[-2.56,-1.96] | 0.22 | |
| IRAS 13349+2438 | 2.8 | 0.99 | 0.01 | 0.00 | 0.97[0.94, 0.99] | 0.17[-0.01, 0.34] | -0.75[-1.23,-0.37] | 0.65 | |
| Mrk 463E | 2.5 | 0.92 | 0.08 | 0.01 | 0.87[0.78, 0.96] | -0.47[-0.72,-0.22] | -2.36[-2.77,-1.96] | 0.68 | |
| IRAS 143481447S | 3.4 | 0.57 | 0.39 | 0.03 | 0.54[0.24, 0.83] | -1.55[-3.62,-0.09] | -1.34[-2.55,-0.20] | 0.02 | |
| Mrk 478 | 1.8 | 0.89 | 0.11 | 0.00 | 0.76[0.58, 0.91] | 0.04[-0.30, 0.37] | -1.70[-2.47,-1.07] | 0.37 | |
| NGC 6240N | 4.9 | 0.42 | 0.58 | 0.00 | 0.42[0.15, 0.62] | -1.32[-3.51,-0.03] | -1.58[-2.64,-0.39] | 0.01 | |
| NGC 6240S | 15.6 | 0.58 | 0.39 | 0.04 | 0.66[0.60, 0.72] | -1.82[-3.49,-1.03] | -2.16[-3.77,-1.61] | 0.07 | |
| IRAS172080014 | 3.0 | 0.31 | 0.69 | 0.00 | 0.42[0.17, 0.64] | -1.68[-3.69,-0.13] | -1.34[-2.51,-0.20] | 0.01 | |
Notes.— The listed values are reduced ones. For the AGN rest-frame m luminosities, those galaxies marked with the ground-based spectra do not cover the rest-frame m and the values were estimated from the extrapolation of the AGN best-fit template. The mid-IR contributions of the AGN, PAH, and STR components are in the m spectral range and within the slit. For the fitted AGN fractional contribution at m within the slit, mid-IR m spectral index and strength of the silicate feature we give the median value and in brackets the 16% and 84% percentiles of the PDFs.
| Galaxy | AGN | Mid-IR Contribution | AGN Frac. at m | AGN | AGN | ||||
|---|---|---|---|---|---|---|---|---|---|
| () | AGN | PAH | STR | ||||||
| Mrk 335 | 2.0 | 0.78 | 0.02 | 0.19 | 0.58[0.34, 0.82] | -0.09[-0.97, 0.38] | -1.58[-2.56,-0.73] | 0.32 | |
| PG0804+761 | 2.7 | 0.82 | 0.00 | 0.18 | 0.90[0.85, 0.99] | 0.24[ 0.09, 0.40] | -1.40[-1.81,-0.96] | 0.56 | |
| PG0844+349 | 3.6 | 1.00 | 0.00 | 0.00 | 0.88[0.79, 0.96] | 0.27[ 0.00, 0.50] | -1.76[-2.55,-1.28] | 0.60 | |
| PG1211+143 | 2.8 | 0.95 | 0.02 | 0.03 | 0.87[0.76, 0.96] | 0.25[ 0.04, 0.46] | -1.51[-1.91,-1.13] | 0.58 | |
| 3C273 | 1.2 | 0.91 | 0.05 | 0.04 | 0.92[0.86, 0.97] | 0.09[-0.09, 0.27] | -0.93[-1.25,-0.58] | 0.41 | |
| PG1229+204 | 3.2 | 0.93 | 0.07 | 0.00 | 0.82[0.69, 0.94] | 0.11[-0.26, 0.43] | -1.78[-2.58,-1.13] | 0.65 | |
| PG1411+442 | 1.4 | 0.85 | 0.00 | 0.15 | 0.79[0.64, 0.93] | 0.11[-0.13, 0.36] | -1.34[-1.84,-0.80] | 0.44 | |
| Mrk 1383 | 3.1 | 0.99 | 0.00 | 0.01 | 0.87[0.75, 0.96] | 0.14[-0.13, 0.38] | -1.87[-2.66,-1.41] | 0.62 | |
| Mrk 841 | 2.6 | 0.94 | 0.00 | 0.06 | 0.92[0.83, 0.97] | -0.13[-0.34, 0.14] | -2.26[-2.70,-1.86] | 0.70 | |
| Mrk 509 | 0.9 | 0.89 | 0.02 | 0.09 | 0.86[0.71, 0.95] | 0.06[-0.21, 0.29] | -1.83[-2.58,-1.38] | 0.52 | |
Notes.— All the columns are as in Table 3.
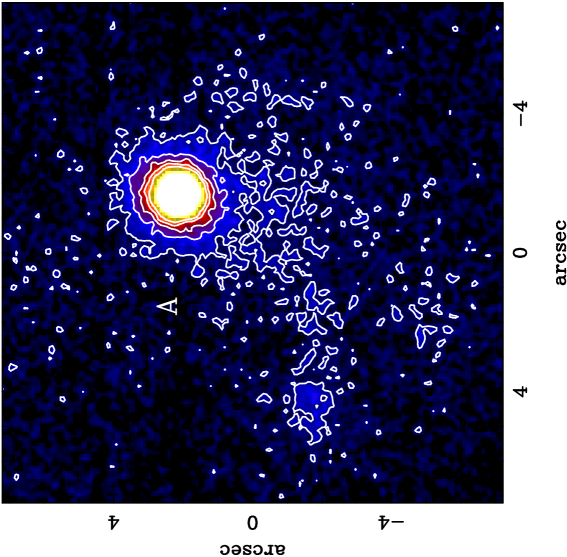
The GTC/CanariCam m images of Arp 299 show emission stemming not only from the bright mid-IR sources (A, B1, B2, C and C’) but also from H ii regions in the spiral arms of the eastern component and to the north west of B1, as well as extended emission around B1 (see Fig. 2 and Alonso-Herrero et al., 2009). The IRAC m image of IRAS 172080014 shows a bright nearly point source, which is clearly resolved and extended in the east-west direction in the GTC/CanariCam m (see Fig. 3, bottom panels). The projected separation of the two nuclei identified in this galaxy (see Medling et al., 2014, 2015) is approximately the same as the FWHM of the image (0.26 arcsec) and cannot therefore be resolved. However, based on the nuclear Br (Medling et al., 2014) and Pa (Piqueras López et al., 2012) morphologies of this system and the similarity between hydrogen recombination line and m morphologies of local LIRGs (Díaz-Santos et al., 2008), we tentatively identify the peak of the CanariCam emission with the western nucleus of IRAS 172080014. García-Burillo et al. (2015) proposed that this nucleus hosts an obscured (i.e., Compton-thick, see González-Martín et al., 2009) AGN which is responsible for the energetic outflow detected in molecular gas in this system. We note that the extraction aperture used for the GTC/CanariCam spectra includes emission from the two nuclei. NGC 1614 and NGC 6240 were discussed in detail in Pereira-Santaella et al. (2015) and Alonso-Herrero et al. (2014), respectively.
4 Analysis
4.1 Deriving the AGN mid-IR properties
Even on sub-arcsecond resolution the mid-IR emission of local (U)LIRG nuclei can have a significant contribution from star formation activity, as revealed by the detection of polycyclic aromatic hydrocarbon (PAH) features, in particular the m PAH feature (see e.g. Soifer et al., 2002; Díaz-Santos et al., 2010; Mori et al., 2014; Pereira-Santaella et al., 2015; Alonso-Herrero et al., 2014, 2016). To study the AGN mid-IR emission of local (U)LIRG nuclei, we need to disentangle it from that due to star formation. Spectral decomposition methods have been proven effective in doing so for local (U)LIRGs (see e.g. Nardini et al., 2008, 2010; Alonso-Herrero et al., 2012; Martínez-Paredes et al., 2015) and have been mostly applied to Spitzer/IRS spectra.
We use the deblendIRS tool111http://denebola.org/ahc/deblendIRS (Hernán-Caballero et al., 2015) to do the spectral decomposition of the ground-based mid-IR spectra of the two samples. deblendIRS is an idl/gdl-based routine that uses Spitzer/IRS observational spectral templates to decompose the mid-IR m spectra of galaxies into AGN, interstellar (PAH), and stellar (STR) components. Although deblendIRS was originally designed to be used with IRS spectra, it can be easily adapted to do the spectral decomposition of ground-based spectroscopy by setting the adequate spectral range. We note, however that this routine uses templates taken with IRS. We are therefore assuming that the mid-IR emission associated with star formation activity on kpc scales resembles that taking place in the vicinity of the AGN.
deblendIRS provides the best-fitting model to the data and it also gives the probability distribution functions (PDF) of the fitted AGN, PAH and STR fractional components to the m emission within the slit as well as of AGN mid-IR properties such as the mid-IR spectral index in the range m, the strength of the m silicate feature (defined as where is the flux density at the feature and is the flux density of the underlying continuum). We calculated the AGN rest-frame m monochromatic luminosity, , using the best-fit AGN component at that wavelength.
In Appendix A we show two examples of the graphical output from deblendIRS for an IR-bright galaxy with AGN-dominated mid-IR emission (Mrk 463E) and an IR-bright galaxy with a star formation-dominated nuclear mid-IR spectrum (IRAS 172080014). In Tables 3 and 4 we list the results from the deblendIRS spectral decomposition of the nuclear spectra of the IR-bright galaxies and comparison quasars, respectively. We provide for each galaxy the reduced value of the best fitting model, the rest-frame m monochromatic AGN luminosity, the best fit value of the AGN, PAH and stellar contributions in the m spectral range within the slit, the median value of the AGN fraction contribution at rest-frame m and 1 confidence interval (i.e., the 16% and 84% percentiles of the PDF), the median value of the AGN mid-IR spectral index and 1 confidence interval, and the median value of the strength of the silicate feature (positive values indicate that the feature is in emission and negative values in absorption) and 1 confidence interval. Since the AGN spectral templates are flatter than those accounting for the stellar and interstellar emission (i.e., STR and PAH templates, see Figure 2 of Hernán-Caballero et al., 2015), the contribution from the AGN at long wavelengths is generally lower than the integrated values for the entire m range.
The reduced values derived from the fits to the mid-IR ground-based spectra of the IR-bright galaxies and quasars in our sample indicate that in the majority of the cases the reliability of the fits is good. The highest value of is for IRAS 08572+3915N for which none of the AGN templates, including the “obscured AGN” templates, reproduces its extremely deep silicate absorption. We refer the reader to Appendix A for a more detailed discussion on fits of sources with deep silicate features and high values of . Deep silicate features are believed to be related to additional extinction due to either dust lanes in the host galaxy or the merger process (see Goulding et al., 2012; González-Martín et al., 2013, and also Section 6.1). We finally note that for sources with both the AGN fraction and AGN luminosity should be considered as upper limits, because the "obscured AGN" templates could be composite sources.
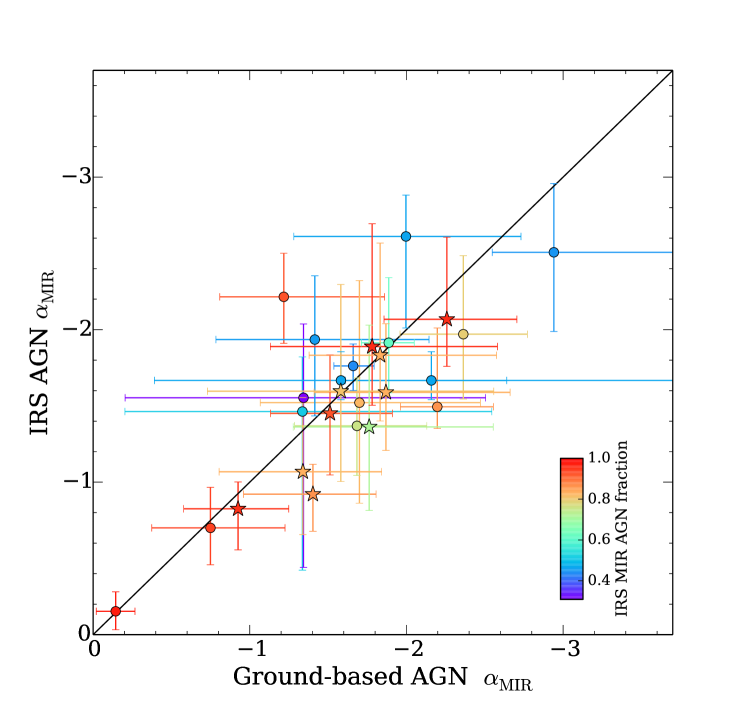
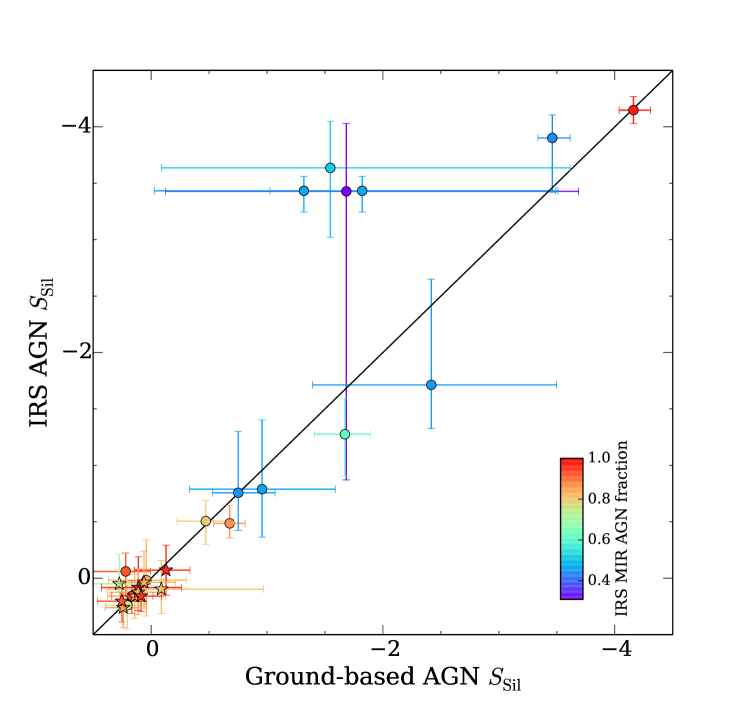
Finally, we also performed the spectral decomposition of the Spitzer/IRS spectra of the IR-bright galaxy and quasar samples. In Appendix 2 we show the comparisons between the derived AGN spectral index and strength of the silicate feature for the IRS and ground-based spectra using deblendIRS. We demonstrate that the results are compatible for the majority of the sources. We however use the deblendIRS AGN results obtained from the ground-based mid-IR spectra because they allow us to compare them with the star formation activity on nuclear scales (see Sections 4.2 and 6.2).
4.2 Measuring the m PAH feature
The PAH features and in particular the m PAH emission are good proxies for deriving the star formation rate (SFR) in starburst galaxies, LIRGs and ULIRGs (Brandl et al., 2006; Farrah et al., 2007; Alonso-Herrero et al., 2013a) as well as in Seyfert galaxies and other AGN (Shi et al., 2007; Netzer et al., 2007; Diamond-Stanic & Rieke, 2012). To measure the m PAH feature from both the high angular resolution and the Spitzer/IRS spectra, we fitted a local continuum on both sides of the feature (rest frame m and m) and integrated the feature within the spectral range m. We refer the reader to Hernán-Caballero & Hatziminaoglou (2011) for more details on this method and to Esquej et al. (2014) for its implementation for ground-based mid-IR spectroscopy. We estimated the uncertainties in the flux and equivalent width (EW) of the feature by performing Monte Carlo simulations using the calculated dispersion around the measured fluxes and EWs in 100 simulations of the original spectrum. For the CanariCam spectra we used the random noise distributed as the standard deviation calculated over 5 pixels. For the IRS spectra we only used the rms error provided by CASSIS.
In Table 5 we give the luminosity and EW of the m PAH feature measured on nuclear scales (given in parsecs) and the ratios between the nuclear and the Spitzer/IRS fluxes for both the local IR-bright galaxies and the IR-weak quasars. We note that for galaxies at approximately , the spectral range covered by the ground-based data does not allow us to measure this PAH feature and therefore are not listed in this table. As we did in Esquej et al. (2014), we considered a detection when the flux of the m PAH feature was at least twice its error. This is equivalent to having the PAH feature detected with a significance of or higher (i.e., with a 95% confidence or higher). For the nuclear non-detections of the PAH feature the upper limits to the m PAH luminosity and EW in the table are given at the level. For IZw1, Mrk 463E, Mrk 335, and PG1229+204 nuclear m PAH emission may be present but with a low () significance. Thus for these four nuclei in Table 5 we give the measurement value plus 1 uncertainty as upper limits.
| Galaxy | Region | EW | Nuc/IRS | Nuclear SFR | |
|---|---|---|---|---|---|
| (pc) | (10) | (m) | ratio | ( | |
| IR-bright galaxies | |||||
| IZw1 | 0.5 | 3 | |||
| NGC 1614 | 0.76 | 0.40 | 0.8 | ||
| Mrk 1073 | 0.17 | 0.11 | 0.9 | ||
| IRAS 08572+3915N | < 0.4 | < 0.02 | – | – | |
| UGC 5101 | 0.60 | 0.19 | 3.0 | ||
| IC 694 | 0.11 | 0.08 | 0.6 | ||
| NGC 3690B1 | 0.1 | 0.4 | |||
| Mrk 231 | 1 | 6 | |||
| Mrk 463E | 0.5 | 4 | |||
| Mrk 478 | 1.53 | 0.53 | 7.6 | ||
| NGC 6240N | 0.70 | 0.19 | 3.6 | ||
| NGC 6240S | 1.53 | 0.41 | 7.6 | ||
| IRAS 172080014 | 1.19 | 0.26 | 6.0 | ||
| IR-weak quasars | |||||
| Mrk 335 | 0.03 | 1 | – | ||
| PG 0844+349 | 0.04 | – | – | ||
| PG 1229+204 | 0.04 | 3 | – | ||
| Mrk 841 | 0.01 | 3 | – | ||
| Mrk 509 | 0.19 | 0.20 | 1.0 | ||
Notes.— The Spitzer/IRS SL slit covers both nuclei of NGC 6240, Mrk 463, and IRAS 08572+3915, whereas for Arp 299 the two nuclei, NGC 3690B1 and IC 694, were observed separately (see Alonso-Herrero et al. 2009). The upper limits to the size of the emitting region indicate that the mid-IR nuclear emission appeared unresolved at the observed angular resolution of the ground-based spectroscopy (see Alonso-Herrero et al. 2016) and correspond to the slit width. The nuclear to IRS ratios refer to the luminosity ratios. The nuclear SFR take into account the factor of 2 needed to correct the PAH luminosities measured with a local continuum to the values obtained with pahfit and use the Diamond-Stanic & Rieke (2012) calibration.
5 Nuclear mid-IR emission of quasars and IR-bright galaxies
5.1 AGN rest-frame m luminosities and contribution to IR luminosity
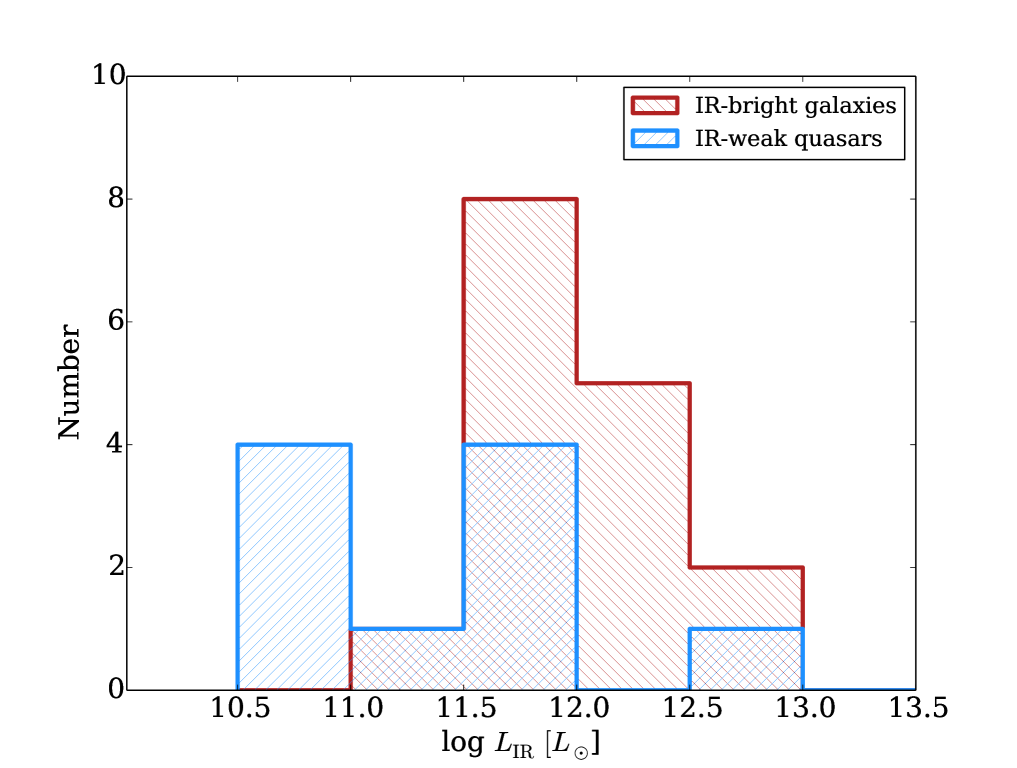
Using the results from deblendIRS we derived the monochromatic rest-frame m luminosities of the AGN in the samples of the IR-bright galaxies and IR-weak quasars. For those nuclei where the observed ground-based m spectra did not cover the rest-frame m (marked in Tables 3 and 4), we derived the luminosities by extrapolating the best-fit AGN component. Tables 3 and 4 list the derived rest-frame m AGN luminosities for the IR-bright galaxy and quasar samples, respectively, and Fig. 4 shows the corresponding histograms.
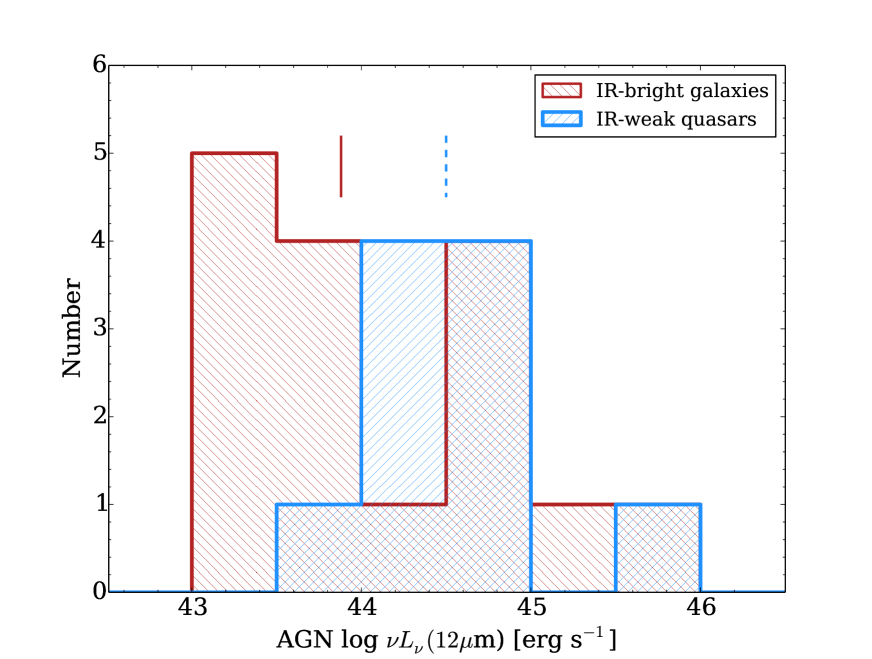
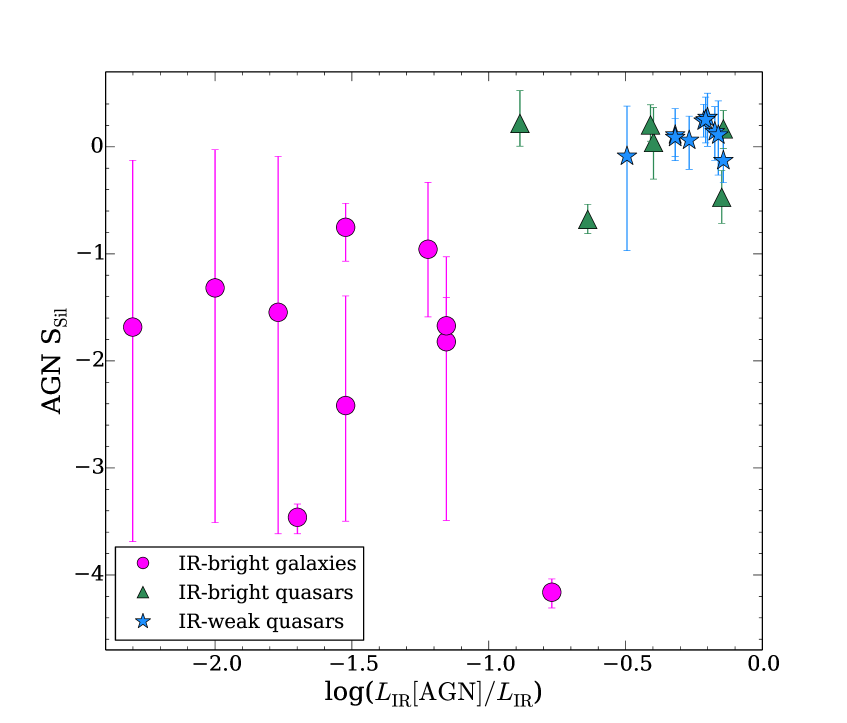
As can be seen from this figure, the median values of the AGN luminosities (using the m AGN luminosity as a proxy, see e.g. Asmus et al., 2014, 2015, and references therein) of the local IR-bright galaxies are slightly lower than those of the IR-weak quasars. However, the IR-bright galaxy AGN show a broader distribution. Their faint luminosity end () still corresponds to typical values of local Seyfert galaxies (Asmus et al., 2014; Alonso-Herrero et al., 2016) even for those nuclei optically classified as L, Cp and H ii (see Table 1). The high end of the m AGN luminosity distribution () of the sample of local IR-bright galaxies is contributed by two IR-bright quasars (e.g., Mrk 1014 and IRAS 13349+2438) as well as the emerging quasar Mrk 231. Based on the observed distribution of the m AGN luminosities of the PG quasars in our sample, we consider that AGN with monochromatic m luminosities greater than a few indicate the presence of a quasar. Therefore in our IR-bright galaxy sample, IRAS 08572+3915N and Mrk 463E (see also Mazzarella et al., 1991), which are not identified as optical quasars, would be good candidates for buried quasars. Interestingly, these two are in close interacting systems and not in fully merged ULIRGs, thus suggesting that quasars can be formed before the end of the interaction process (see e.g. Hopkins et al., 2006, 2008; Ramos Almeida et al., 2010). However, as noted in Section 4.1, for the fully embedded nuclear source of IRAS 08572+3915N the m AGN luminosity should be considered an upper limit. Therefore, from now on we we will refer as the sample of IR-bright quasars to the following six objects: IZw1, Mrk 1014, Mrk 231, IRAS 13349+2438, Mrk 463E, and Mrk 478.
The AGN fractional contributions within the slit (typical physical regions of a few hundred parsecs) at m and in the m spectral range for the IR-bright galaxy nuclei (see Table 3) show a large variation going from (NGC 6240N and IRAS 172080014) to nuclei completely dominated by the AGN emission (e.g., Mrk 1014 and IRAS 13349+2438). The median value of the AGN fractional contribution at m for the IR-bright galaxy nuclei is 0.78 (within the slit). This high value is not surprising because our sample selection required relatively compact emission and this tends to select IR-bright galaxies with AGN-dominated mid-IR fluxes within the slit (see discussion in Section 2). The nuclear (typical physical scales of hundreds of pc) mid-IR emission of the majority of quasars in our sample appears to be dominated by AGN emission (median value AGN contribution at m of 0.87), which is consistent with the AGN fractional contributions at m derived from Spitzer/IRS spectroscopy by Shi et al. (2007).
We can use the average AGN and quasar templates of Mullaney et al. (2011), which have and 1.6, respectively, to derive the IR (m) emission of the AGN. We find that the IR emission of the AGN contribute between 1% (NGC 6240N and IRAS 172080014) and (Mrk 463E) of the total IR luminosity of the system in our IR-bright galaxy sample with a median value of 10%. This is in contrast with the AGN mid-IR dominance within the central hundred parsecs and indicates that the IR-bright galaxies in our sample have extended star formation over several kiloparsecs (see also Section 5.3). The largest AGN contributions among the IR-bright galaxies are, not surprisingly, for the IR-bright quasars. These estimates are in good agreement with the average AGN bolometric contribution estimated for local ULIRGs (Veilleux et al., 2009a; Nardini et al., 2010) and for local LIRGs (Petric et al., 2011; Alonso-Herrero et al., 2012) applying different methods to the Spitzer/IRS spectra. For the quasars the AGN contribution to the IR luminosity is higher than for the IR-bright galaxies, with values in the range and a median contribution of 60%.
5.2 AGN silicate feature and mid-IR spectral index
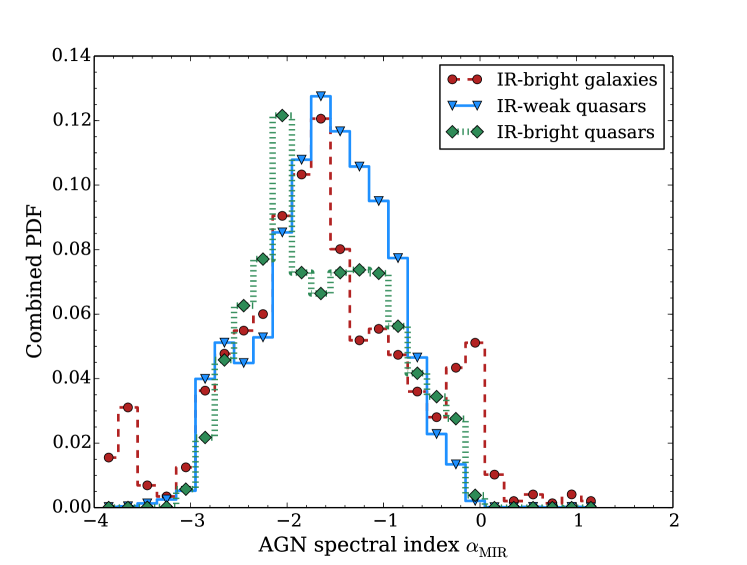
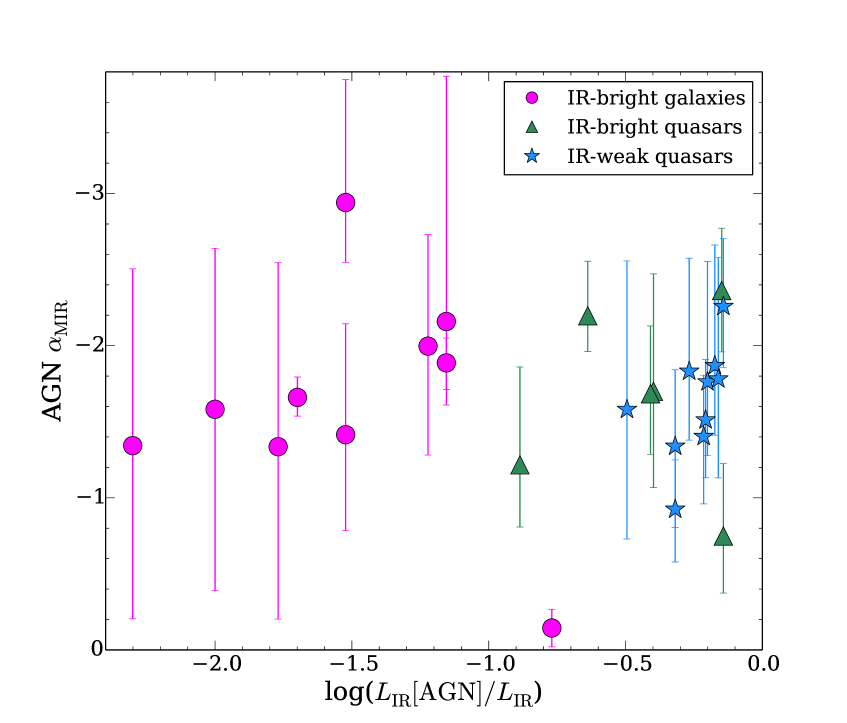
For each nucleus in the IR-bright galaxy and quasar samples, we list in Tables 3 and 4 respectively the median values and confidence intervals of the fitted strengths of the silicate feature and mid-IR spectral index of the AGN component. As can be seen from these tables, the AGN hosted in IR-bright galaxies show a broader range of strengths of the silicate feature than the IR-weak quasars. The latter tend to have values consistent with the feature being slightly in emission, as also found by other studies using Spitzer/IRS spectroscopy (see e.g. Shi et al., 2006; Thompson et al., 2009). In terms of the AGN spectral index in the m range, the two samples show values that are similar to values derived for Seyfert galaxies although some for slightly different spectral ranges (see e.g. Thompson et al., 2009; Hönig et al., 2010; Ramos Almeida et al., 2011; Hernán-Caballero et al., 2015; Alonso-Herrero et al., 2016).
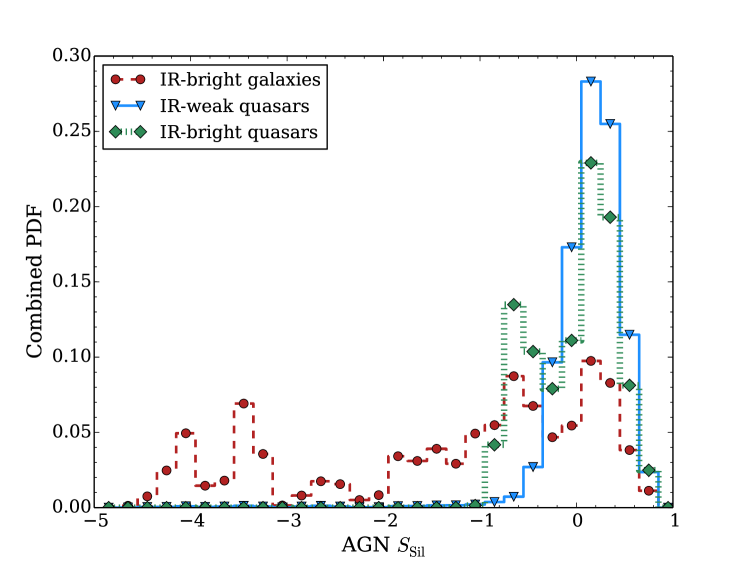
To make a statistical comparison of the derived mid-IR AGN properties of IR bright galaxies and quasars we combined the individual PDF of the the mid-IR m spectral index and the strength of the silicate feature from the deblendIRS spectral decomposition for the nuclei of the samples. We show the resulting combined PDFs in Fig. 5 and the statistics in Table 6. We note that the relatively small size of our samples means that some of the observed peaks in the combined PDF are due to individual nuclei with relatively well constrained values of the AGN and (see discussion below). However, we prefer to show the combined PDFs rather than the PDF for the individual galaxies as the PDF for some individual objects are quite broad whereas the combined PDF contain more information.
The expectation value for derived from the combined PDFs (median of the distribution) is similar for the samples of IR-bright galaxies and the IR-weak quasars (). However, the distribution for the nuclei of IR-bright galaxies shows a slightly broader tail toward flatter mid-IR spectral indices. On the other hand, the distributions of the strengths of the silicate features for the AGN component are markedly different for the two samples. The IR-weak quasars show a narrow distribution centered at (the silicate feature slightly in emission), whereas the distribution for the AGN hosted by IR-bright galaxies (including IR-bright quasars, but see below) is much broader with a median value of . These results are similar to the findings for ULIRGs and optical quasars by Veilleux et al. (2009a) based on the Spitzer/IRS spectroscopy.
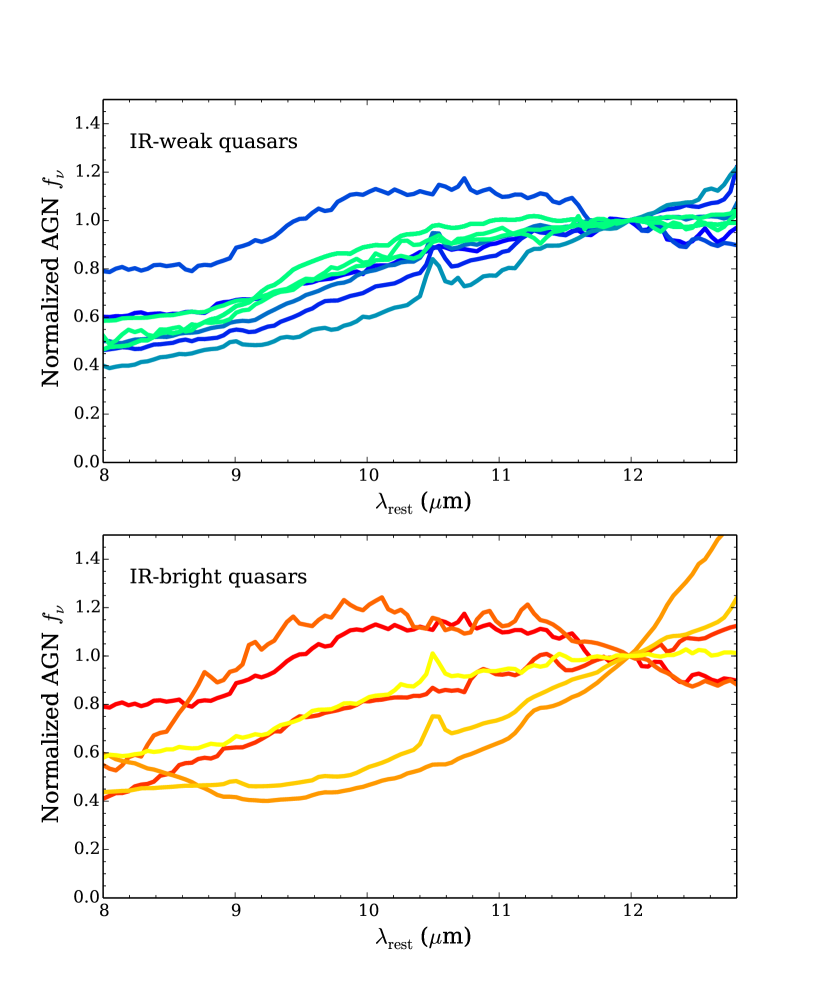
We also produced the combined PDFs for the IR-bright quasars alone (six nuclei excluding IRAS 08572+3915N), see bottom panels of Fig. 5 and Table 6. The best-fit AGN components for both IR-bright and IR-weak quasars are relatively similar (see Fig. 6), as also reflected by the median values of the combined PDFs of and . However, there are some slight differences in the percentiles of the combined PDF of . There is a second peak in the distribution of the AGN of the IR-bright quasars at , which is due to the two "transitioning quasars" in our sample, namely, Mrk 463E and Mrk 231 (the two best-fit AGN components with the m silicate feature in absorption in Fig. 6). Conversely, the peak at a value seen in the combined PDF of the IR-bright galaxy nuclei is contributed by the IR-bright quasars (IZw1, Mrk 1014, IRAS 13349+2438, and Mrk 478), whereas the rest of the AGN components in the IR-bright galaxy sample appear to be much more obscured.
| Sample | Number | AGN | AGN | ||
|---|---|---|---|---|---|
| Median | [16%, 84%] | Median | [16%, 84%] | ||
| IR-bright galaxies | 16 | -0.90 | [-3.52, 0.09] | -1.79 | [-2.63, -0.73] |
| IR-weak quasars | 10 | 0.07 | [-0.24, 0.33] | -1.68 | [-2.40, -1.04] |
| IR-bright quasars | 6 | -0.03 | [-0.68, 0.29] | -1.58 | [-2.39, -0.35] |
In Section 6 we will investigate further the possible evolutionary connection between IR-bright galaxies and quasars and the interaction stage of the AGN mid-IR emission.
5.3 Nuclear star formation activity
In this section we use the m PAH feature emission to study the star formation activity in the nuclear regions of the IR-bright galaxy sample. Of the 13 IR-bright nuclei where the ground-based spectral range allowed measurements, we detected the m PAH feature (with a detection significance better than ) in 7 of them (see Table 5). The nuclear values of the EW of the m PAH feature for most of the nuclei in the IR-bright galaxy sample are below the typical values of star forming galaxies (m, see for instance Hernán-Caballero & Hatziminaoglou, 2011) because of the increased AGN fractional contribution at m when using high angular resolution data. For the m PAH non-detections there still can be a small contribution from star formation activity in the nuclear region. Our upper limits show that sources with undetected m PAH features could still have m PAH luminosities of a few . This shows that detecting PAH emission may be difficult when the AGN continuum dominates the emission at m unless the spectrum has a high S/N ratio. In galaxies with deep silicate features (e.g., IRAS 08572+3915N in our sample) it is possible that the m PAH emission is obscured by the same foreground absorber that obscures the AGN continuum (see also discussion by Veilleux et al., 2009a). In fact for IRAS 08572+3915N, the 100% AGN contribution in the mid-IR is because this galaxy is fitted with an “obscured AGN” template which might be suffering from the same effect.
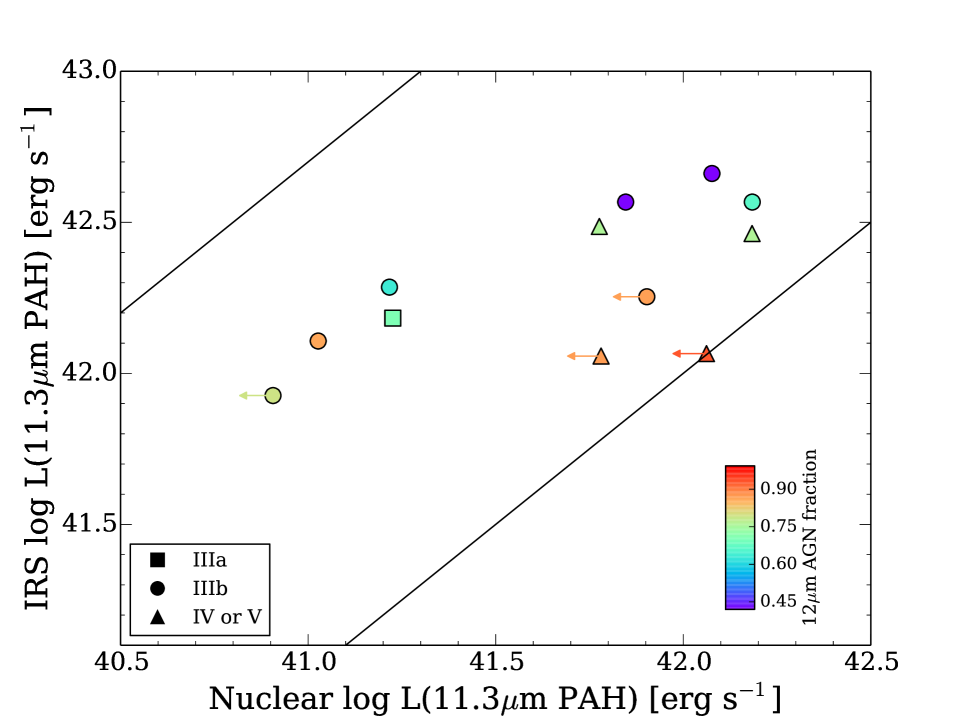
Since we also measured the m PAH feature in the Spitzer/IRS spectra, we computed the ratios between the nuclear and the IRS m PAH luminosities (fifth column of Table 5). The ratios for the IR-bright galaxy sample indicate that there is a large fraction with extended PAH emission from the nuclear physical scales probed with the ground-based data (hundreds of parsecs) to the few kpc scales probed by the IRS slit. The two nuclei in the IR-bright galaxy sample with the most extended m PAH emission (nuclear to IRS ratios of 0.08 and ) are the two components of Arp 299 (see Fig. 2), as also revealed by the deep GTC/CanariCam imaging at m with the Si-2 filter222This relatively narrow mid-IR filter probes the emission from the m PAH feature, see Figure 4 of Díaz-Santos et al. (2008).. The rest have ratios of between 0.1 and 0.5. For the nuclear spectra with only upper limits to the m PAH feature ratios are consistent with compact emission (ratios ).
For the 5 IR-weak quasars where the ground based spectra covered the m PAH feature (see Table 5), we only detected the feature in Mrk 509 (see also Hönig et al., 2010) with an EW of m. This lack of detections is not surprising as the EW of the m PAH feature measured from the Spitzer/IRS spectra for the PG quasars in our sample are in the range m for Mrk 509 and m for Mrk 335. The m PAH feature of PG0804+761 remained undetected even in the IRS spectrum. Since the ground-based slits are about times narrower than the IRS SL one, higher AGN contributions within the smaller slits would produce even smaller EW of the PAH features. As can be seen from Table 5, three quasars have formally nuclear upper limits to the m PAH fluxes larger than the IRS one due to the S/N ratio of the CanariCam spectra. Clearly, the nuclear to IRS ratios have to be lower than one.
In Fig. 7 we plot the nuclear m PAH feature luminosities from ground-based data against those measured from the Spitzer/IRS spectra for the IR-bright galaxy sample. From the slit widths and angular resolution we estimate that if the emission was uniformly distributed we would expect a ratio between the two luminosities for the GTC/CanariCam spectra of approximately 50. In this figure, for NGC 1614 we plot the nuclear (central pc) m PAH luminosity estimated by Pereira-Santaella et al. (2015) rather than our extraction, which leads to a nuclear to IRS ratio of approximately 0.1. As can be seen from this figure, the m PAH emission of the majority of the IR-bright galaxies while extended over several kpc is not uniformly distributed. It does not appear to be very compact either (approximately ratios of less than a few tenths), except perhaps for some of nuclei with nuclear upper limits and NGC 6240S. If the m PAH emission traces the recent star formation activity in IR-bright galaxies, this indicates that star formation is extended over several kiloparsecs and not taking place uniformly distributed. Indeed, near-IR HST and ground-based hydrogen recombination line observations show that in local (U)LIRGs star formation takes place in high surface brightness H ii regions (see e.g. Alonso-Herrero et al., 2006; Arribas et al., 2012; Piqueras López et al., 2016). The morphologies traced by the GTC/CanariCam m imaging observations of those IR-bright galaxies in our sample with clearly resolved nuclear regions (see Figs. 2 and 3, and also Díaz-Santos et al., 2008, for other lower IR luminosity LIRGs) also confirm this.
Our results agree with lower angular resolution Spitzer/IRS studies that measured the spatial extent of mid-IR spectral features in a complete sample local LIRGs from the Great Observatories All-sky LIRG survey (GOALS, Armus et al., 2009). While the extent of the [Ne ii]m line emission is restricted to the central few kpc of these galaxies, the PAH emission and in particular the m feature is clearly more extended (Díaz-Santos et al., 2010, 2011). Moreover, in (U)LIRGs with mid-IR AGN contributions %, like many of those those analyzed in this work, the mid-IR continuum is more compact than the PAH emission. This is especially prevalent in those systems experiencing the latest stages of an interaction (Díaz-Santos et al., 2011). This also agrees with our findings for some of the IR-bright galaxies in our sample studied in detail in Alonso-Herrero et al. (2014).
Using the calibrations of the SFR in terms of the luminosity of the m PAH luminosity (see Diamond-Stanic & Rieke, 2012; Shipley et al., 2016) we find nuclear (not corrected for extinction) SFR333We note that Diamond-Stanic & Rieke (2012) when deriving their SFR recipe measured the fluxes of the m PAH features using pahfit instead of a local continuum near the feature as in our work (Section 4.2). The pahfit fluxes are on average twice those measured with a local continuum (see Smith et al., 2007, for more details). We therefore multiplied our m PAH luminosities by this factor when deriving the nuclear SFRs. for the nuclei of IR-bright galaxies (see Table 5) between for IC 694 and for NGC 6240S assuming an initial mass function similar to that of Kroupa (2002). Taking into account the physical sizes covered by the ground-based slits, these translate into nuclear SFR per unit area between for IRAS 172080014 and for NGC 6240S. These values are typical of the nuclear values derived by Piqueras López et al. (2016) for a sample of local (U)LIRGs based on extinction-corrected Pa or Br luminosities.
Taking into account the estimated nuclear SFR per unit area in our sample of IR-bright galaxies and the AGN contributions to the nuclear emission, we suggest that NGC 1614, IC 694 and NGC 6240S would be potentially good candidates for starburst-driven powerful outflows based on the observed correlation between SFR per unit area and outflow velocity (Arribas et al., 2014; Heckman et al., 2015). Indeed, Feruglio et al. (2013) and García-Burillo et al. (2015) have confirmed the presence of starburst-driven outflows in the southern nucleus of NGC 6240 and the nuclear region of NGC 1614, respectively, using molecular gas data.
6 Evolutionary sequence of mid-IR properties between IR-bright galaxies and quasars?
6.1 Nuclear Obscuring Material
In this section we look for evidence for an evolution of the obscuring material around the AGN between the IR-bright galaxies, IR-bright quasars and IR-weak quasars. To do so, we use the derived mid-IR AGN properties, namely, the spectral index, the strength of the silicate feature, and the fractional contribution to the mid-IR emission. With regards to the AGN properties, Haas et al. (2003) predicted an evolutionary change of the mid-IR slope toward flatter indices from “warm” ULIRGs (those dominated by AGN emission) to young quasars, evolved quasars and finally dead quasars. “Cool” ULIRGs, even those hosting an AGN, are dominated by star formation, and emit most of their energy in the far-IR. In “cool” and “warm” ULIRG systems the dust is distributed in a more spherical configuration and as the system evolves to a quasar the dust distribution is predicted to develop a disk or torus-like configuration. From their figure 12 we can see that their predictions for the shape of the IR emission encompasses physical scales of less than 1 kpc which compare well with the physical sizes probed by our ground-based spectroscopy. Moreover, in the context of the predictions from clumpy torus models the mid-IR slope and the strength of the silicate feature provide information about the radial distribution of the clouds and the number of clouds along the equatorial direction in the torus (Hönig et al., 2010; Ramos Almeida et al., 2014).
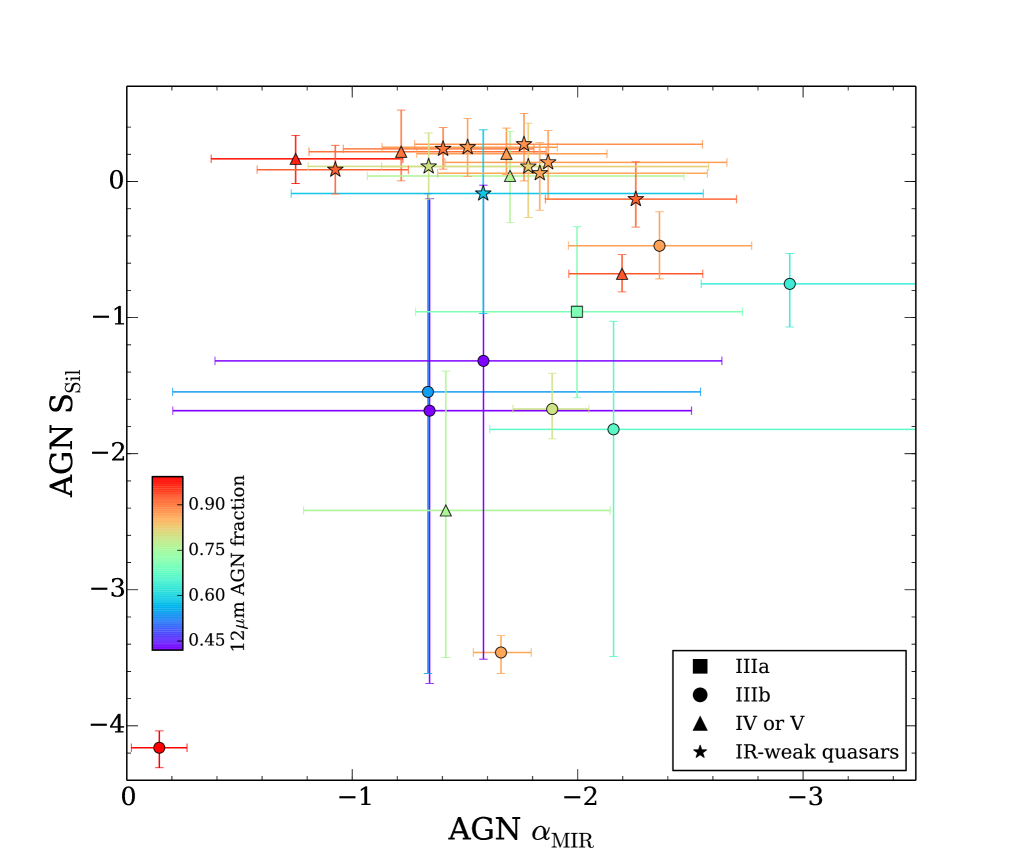
Figure 8 compares the AGN mid-IR spectral index to the AGN strength of the silicate feature for the IR-bright galaxies and quasars as derived with deblendIRS. The sources are color-coded by the fractional AGN contribution at m and the IR-bright galaxies are shown with their interaction class given in Table 1. Most of the IR-weak quasar sample and the IR-bright quasars (the latter recognised as having high AGN fractional contributions and IV or V morphologies) are located in the region around (see also Fig. 9) but span the same range of mid-IR spectral indices as the rest of the IR-bright galaxy sample. This indicates that in general the nuclear mid-IR emission of type 1 quasars can be explained with tori with a relatively low number of clouds along the equatorial direction (see Mor et al., 2009; Martínez-Paredes et al., 2016, for detailed modeling of the nuclear IR emission of PG quasars).
As we also showed in Section 5.2 for the combined PDF of and , the shapes of the AGN mid-IR emission of IR-bright and IR-weak quasars do not differ significantly (see also Fig.6). This seems to imply that the predicted evolution of the dust distribution around these two types of quasars is taking place in short time scales which cannot be resolved with our data. This agrees with the observational result that red quasars make up only of the quasar population (see e.g., Glikman et al., 2012). Moreover, our classification between IR-bright and IR-weak quasars is based on the IR to optical ratios which is likely reflecting different levels of star formation activity in their host galaxies as their far-IR emission is dominated by this process (Netzer et al., 2007). Finally, as discussed in Section 2, our sample of quasars is likely mid-IR bright and thus it is possible we are missing more evolved quasars with different mid-IR spectral shapes.
One exception in this mid-IR view might be the transition quasar Mrk 231 in our sample whose AGN silicate feature is intermediate between those of non-AGN dominated IR-bright galaxies and quasars suggesting the presence of extra dust components. In Mrk 231, the nuclear silicate feature (measured on physical scales of 400 pc) would indicate an extinction of mag, using a foreground dust screen, which is compatible with the value derived by Veilleux et al. (2013) for the obscuration of the broad absorption line region through which the broad line region is observed. The AGN in the other two candidates to buried quasars (Mrk 463E and IRAS 08572+3915N) have strengths of the silicate features which are not compatible with those measured in optically identified quasars, with IRAS 08572+3915N showing in fact the most extreme absorption feature in our sample of IR-bright galaxies and in general the local (U)LIRG population (Spoon et al., 2007). These three quasars could be perhaps just before the blowout phase of the quasar evolution (Hopkins et al., 2006).
As can be seen from Fig. 8, a large fraction of non-quasar IR-bright galaxies (8 out of 10) occupy a different region from that of the quasars, especially in terms of the silicate feature as we saw from the combined PDFs (see Fig. 5). There is no clear trend of the AGN m spectral index with the AGN fractional contribution for the IR-bright galaxy sample (see Fig. 9, lower right panel). This would be expected if the AGN fractional contribution were to give an indication of the evolutionary stage of the AGN. On the other hand, there is a tendency for the AGN component of IR-bright galaxy nuclei with low () AGN fractional contributions to the total IR luminosity of the system to show deeper silicate features (Fig. 9, lower left panel). These have a mean value of , whereas the nuclei with AGN fractional contributions above 10% have a mean value of . This is similar to the trend found by Veilleux et al. (2009a) for H ii-like optically classified ULIRGs to have deeper silicate features. As pointed out by many works (Levenson et al., 2007; González-Martín et al., 2013; Alonso-Herrero et al., 2011; Hatziminaoglou et al., 2015; Alonso-Herrero et al., 2016), deep silicate features () cannot be reproduced by clumpy torus models (see e.g. Nenkova et al., 2008; Hönig & Kishimoto, 2010), indicating either extended dust components in the host galaxies (see Goulding et al., 2012) and/or deeply embedded sources in more spherical configurations. This is consistent with Haas et al. (2003) evolutionary prediction of a more embedded dust distribution surrounding the AGN for the “cool” (i.e., star formation dominated) ULIRG phase.
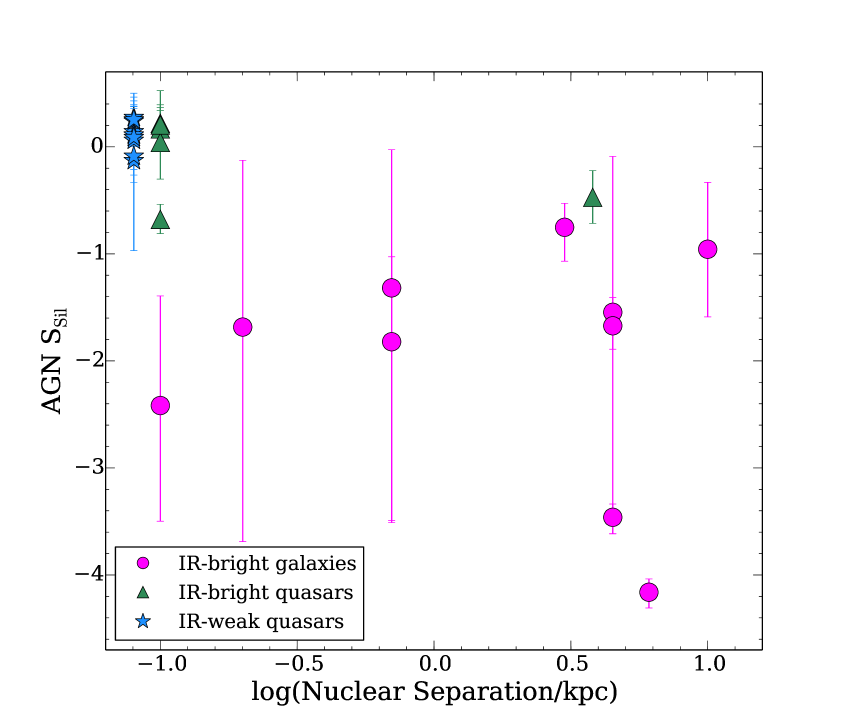
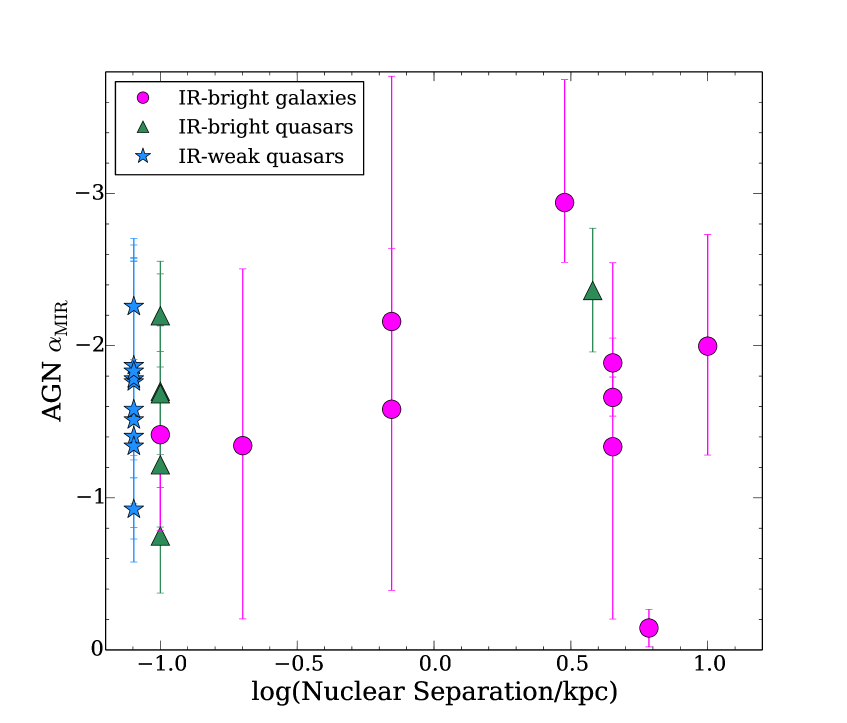
We do not find any clear trends of the AGN mid-IR properties in terms of the interaction stage (see Fig. 8) or the projected nuclear separation (see the upper panels of Fig. 9). For instance, the three AGN in the IR-bright galaxy sample with the deepest silicate features are in interacting galaxies which are not fully merged (that is classified as IIIb, with projected nuclear separations between the individual nuclei of less than 10 kpc). However, the LIRG NGC 7469 (not plotted here), which is classified as IIIa (its companion is IC 5283, located at a projected distance greater than 10 kpc) has an AGN silicate feature flat or slightly in emission (Hönig et al., 2010), which is similar to the values measured in the (fully merged) quasars in our sample and other Seyfert 1 nuclei (Thompson et al., 2009; Hönig et al., 2010; Alonso-Herrero et al., 2016). The other non-quasar IR bright nuclei whose AGN is fitted with a deep silicate feature is UGC 5101 which is believed to be fully merged.
In summary, since the AGN mid-IR spectral index and the silicate feature trace the properties of the obscuring material around the AGN (approximately the radial distribution of clouds and number of clouds in the context of the clumpy dusty torus, respectively, see Hönig & Kishimoto, 2010) the only clear trend is for both IR bright IR-weak quasars to show less obscuration than the rest of the nuclei in the IR-bright galaxy sample which tend to have lower AGN fractional contributions. We find no apparent relationship of these properties with the interaction class of the host galaxy or the projected nuclear separation between the nuclei. This confirms that there is not a single evolutionary path for the local IR-bright galaxies into AGN dominated systems, as already discussed in previous works (Rigopoulou et al., 1999; Veilleux et al., 2009a; Farrah et al., 2009).
6.2 Nuclear star formation vs. AGN luminosity
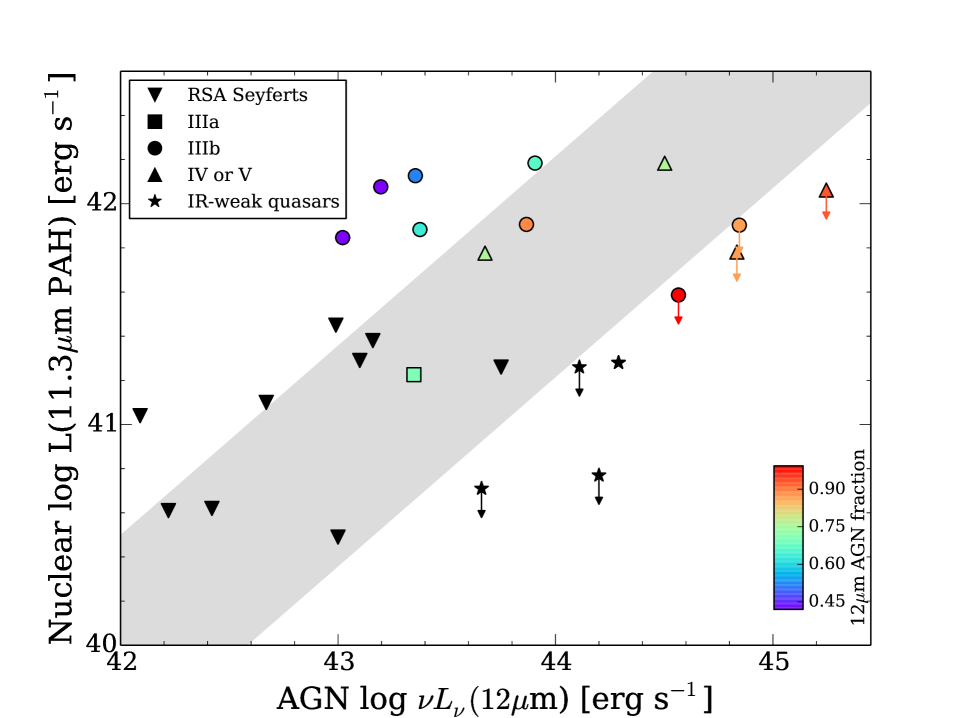
In the last part of this work we investigate the relation between the nuclear star formation activity and the AGN luminosity for our sample of local IR-bright galaxies. Numerical simulations for major gas-rich mergers (Hopkins et al., 2008) predict a relation between these two quantities with the correlation becoming more tightly coupled on smaller physical scales (Hopkins & Quataert, 2010). However, dynamical delays between the peaks of star formation activity and AGN activity are also predicted and are also a function of the physical scales where the star formation is measured (Hopkins, 2012). From the observational point of view this correlation has been observed for local Seyferts in the Shapley-Ames (RSA) sample for nuclear SFR measured on circumnuclear scales (radius of kpc, Diamond-Stanic & Rieke, 2012) and on 100-pc nuclear scales (Esquej et al., 2014). Also Netzer et al. (2007) found a similar correlation for PG quasars using the m PAH feature as measured from Spitzer/IRS spectra and probing several kpc scales.
Figure 10 shows the AGN rest-frame m monochromatic luminosity against the nuclear m PAH luminosity as proxies for the AGN luminosity (see Asmus et al., 2015, and references therein) and nuclear SFR, respectively, for our IR-bright galaxy and quasar samples. Given the distances of the IR-bright galaxies and quasars in our sample the ground-based mid-IR spectroscopy probes physical scales of a few hundred parsecs (see Table 5). For the nearest LIRG in our sample, Arp 299, instead of the ground-based mid-IR PAH luminosities we show the Spitzer/IRS one which probes physical scales of approximately 700 pc.
For a subset of Seyferts in the RSA sample, Esquej et al. (2014) showed that on nuclear scales (median of 60 pc) there is a nearly linear relation (with a 0.4 dex scatter) between the SFR (calculated from the m PAH luminosity) and the black hole accretion rate (derived from the AGN bolometric luminosity). The RSA Seyferts are drawn from a magnitude-limited catalog of galaxies and considered to be one of the least biased samples of local AGN. As a comparison we included in Fig. 10 those RSA Seyferts for which, depending on their distance, the ground-based or the Spitzer/IRS slits cover physical regions of a few hundred parsecs, as in our samples. We note that quasar Mrk 509 is also part of the RSA Seyfert sample.
Since most of the RSA Seyferts are not currently experiencing major merger processes, we can use them to define the locus of normal AGN (in the sense of their activity being driven probably by more secular processes) in the plot showing the AGN luminosity (that is, black hole accretion rate) and the nuclear m PAH luminosity (nuclear star formation rate). We plot this locus as a linear relation with a dex scatter, similar to the scatter measured on kpc scales, (see Diamond-Stanic & Rieke, 2012). As can be seen from Fig. 10, the quasars (both IR-bright and IR-weak) lie at the high luminosity end of this locus defined by the RSA Seyferts and are compatible with or lie just below the relation found for lower luminosity AGN. This may suggest that in some quasars the nuclear star formation activity is already dimming as predicted by numerical simulations. Some of the other IR-bright galaxy nuclei (e.g., IC 694, NGC 1614, NGC 6240N, IRAS 172080014) on the other hand, tend to show enhanced nuclear star formation when compared to normal AGN. This suggests they are in an earlier phase of the AGN evolution when star formation dominates the energetics of the system. Note that Alonso-Herrero et al. (2013a) reached a similar conclusion for a sample of local LIRGs at lower IR luminosities. However, this excess nuclear star formation activity can be observed for both fully-merged IR-bright galaxies as well as individual nuclei of close interacting systems.
7 Summary and conclusions
The evolutionary connection between IR-bright galaxies associated with gas-rich mergers and quasars was proposed nearly thirty years ago. We used ground-based mid-IR imaging and spectroscopy of a sample of 14 local (16 individual nuclei) IR-bright galaxies () and a comparison sample of 10 optical quasars to investigate this connection. Among the IR-bright galaxies, which are mostly in interacting or merger systems, five are classified as IR-bright quasars based on their IR luminosity to optical -band ratios. We took advantage of the high angular resolution (0.3-0.4 arcsec) afforded by mid-IR instruments on 8-10 m-class telescopes to study nuclear physical scales of hundreds of parsecs in both samples with an improvement of almost a factor of 10 with respect to Spitzer/IRS. This allows us to probe nuclear scales where the black hole growth and star formation activity are believed to be more tightly coupled.
Using the deblendIRS spectral decomposition tool we isolated the mid-IR emission due to dust heated by the AGN from that due to nuclear star formation for both samples. This allowed us to derive AGN mid-IR properties such as, the m spectral index (), the strength of the m silicate feature (), and the AGN rest-frame m monochromatic luminosities, which provide information about the nuclear dust distribution and the AGN contribution to the IR luminosity. We also measured the m PAH feature emission on nuclear and kiloparsec scales, the latter from Spitzer/IRS spectroscopy, as proxies for the star formation activity in both IR-bright galaxies and quasars.
Our main results are as follows,
-
•
IR-bright galaxies and quasars show similar high AGN mid-IR contributions (median ) within the slits. However, the AGN IR contribution to the total IR luminosity of IR-bright galaxies is significantly lower (between 1% and 70%, median 10%) than in quasars (median 60%) indicating that the former have significant contributions from star formation activity.
-
•
The shapes of the AGN mid-IR emission of IR-bright and IR-faint quasars do not differ significantly, as demonstrated by the similarity of the combined PDF of the derived AGN m spectral indices (medians and ) and strength of the m silicate feature (medians , that is, feature slightly in emission and , feature slightly in absorption). This seems to indicate that the predicted evolution of the nuclear dust distribution around these two types of quasars is taking place in short time scales and the differences in terms of IR to -band ratios are likely due to different levels of star formation activity in their host galaxies. However, our sample of quasars is likely to be mid-IR bright and therefore miss some of the more evolved quasars.
-
•
Based on the observed nuclear silicate features IR bright and IR-weak quasars are likely to contain less nuclear obscuring material than the rest of the nuclei in the IR-bright galaxy sample (median ). For the IR-bright galaxies we found no clear trend of the AGN mid-IR properties ( and ) with the interaction class of the host galaxy or the projected nuclear separation. This confirms that there is not a single evolutionary path for the evolution of the dust distribution around the AGN hosted by local IR-bright galaxies.
-
•
From the comparison of the m PAH fluxes between nuclear scales (ground-based spectroscopy) and kiloparsec scales (Spitzer/IRS spectroscopy), we concluded that star formation in many local IR-bright galaxies is extended over several kiloparsecs and not uniformly distributed but rather taking place in individual bright star forming regions. The nuclear SFR of the IR-bright galaxies in our sample range between for IC 694 and for NGC 6240S. For the physical sizes covered by the ground-based slits, these translate into nuclear SFR per unit area between for IRAS 172080014 and for NGC 6240S.
-
•
IR-bright and IR-weak quasars have more luminous AGN (using the AGN m luminosity as a proxy) and higher nuclear (a few hundred parsecs) SFR (using the m PAH luminosity as a proxy) than local Seyferts. For their luminosities and compared to local Seyferts, the nuclear star formation activity of some local quasars is already dimming, as predicted by numerical simulations of major mergers. Some of the other IR-bright galaxy nuclei, however, show enhanced nuclear star formation at a given AGN when compared to local Seyferts, indicating that they are in an earlier star-formation dominated phase of the interaction process. However, this excess nuclear star formation activity is observed in both fully-merged IR-bright galaxies as well as individual nuclei of close interacting systems.
The results of this paper highlight the evolutionary complexity of the AGN and star formation energetics in the the nuclear regions of local IR-bright galaxies and quasars. The integral field unit of the mid-IR MIRI instrument (Rieke et al., 2015; Wright et al., 2015) on the James Webb Space Telescope will produce sensitive observations with similar angular resolutions to the ground-based data analyzed here while providing a broad spectral range (m) and high spectral resolution (). This will allow us to observe direct indicators of the presence of an AGN (i.e., detection of high excitation emission lines), probe the nuclear star formation activity with different tracers, and obtain the kinematics of the nuclear regions of local IR-bright galaxies and quasars.
Acknowledgements
We thank an anonymous referee for valuable comments that helped improve the paper. We thank Santiago García-Burillo for insightful discussions and Sebastian Hönig and Leonard Burtscher for making their fully reduced spectra available to us. We acknowledge financial support from the Spanish Ministry of Economy and Competitiveness through the Plan Nacional de Astronomía y Astrofísica grants AYA2012-31447 (A.A.-H. and A.H.-C.), and AYA2015-64346-C2-1-P (A.A.-H.), which were partly funded by the FEDER programme, and AYA2015-70815-ERC and AYA2012-31277 (A.H.-C.) and AYA2012-32295 (M.P.-S. and L.C.). A.A.-H. is also partly funded by CSIC/PIE grant 201650E036. R.P. acknowledges the Oxford University Summer Research Programme. I.A. and M.M.-P. are partly supported by Mexican CONACyT through research grant CB-2011-01-167291. M.M.-P. acknowledges support by the CONACyT PhD fellowship programme. C.R.A. acknowledges the Ramón y Cajal Program of the Spanish Ministry of Economy and Competitiveness. N.A.L. is supported by the Gemini Observatory, which is operated by the Association of Universities for Research in Astronomy, Inc., on behalf of the international Gemini partnership of Argentina, Brazil, Canada, Chile, and the United States of America. T..D-S. acknowledges support from ALMA-CONICYT project 31130005 and FONDECYT 1151239."
Based on observations made with the GTC, installed in the Spanish Observatorio del Roque de los Muchachos of the Instituto de Astrofísica de Canarias, in the island of La Palma. This research has made use of the NASA/IPAC Extragalactic Database (NED) which is operated by JPL, Caltech, under contract with the National Aeronautics and Space Administration. This work is based in part on observations made with the Spitzer Space Telescope, which is operated by the Jet Propulsion Laboratory, California Institute of Technology under a contract with NASA.
References
- Alonso-Herrero et al. (2006) Alonso-Herrero A., Rieke, G. H. Rieke, M. J. et al. 2006, ApJ, 650, 835
- Alonso-Herrero et al. (2009) Alonso-Herrero A., et al. 2009, ApJ, 697, 660
- Alonso-Herrero et al. (2011) Alonso-Herrero A., et al. 2011, ApJ, 736, 82
- Alonso-Herrero et al. (2012) Alonso-Herrero A., Pereira-Santaella M., Rieke G. H., Rigopoulou D. 2012, ApJ, 744, 2
- Alonso-Herrero et al. (2013a) Alonso-Herrero A. et al., 2013a, ApJ, 765, 78
- Alonso-Herrero et al. (2013b) Alonso-Herrero A. et al., 2013b, ApJ, 779, L14
- Alonso-Herrero et al. (2014) Alonso-Herrero A. et al., 2014, MNRAS, 443, 2766
- Alonso-Herrero et al. (2016) Alonso-Herrero A. et al., 2016, MNRAS, 455, 563
- Armus et al. (2009) Armus L. et al. 2009, PASP, 121, 559
- Asmus et al. (2014) Asmus D., Hönig S. F., Gandhi P., Smette A., Duschl W. J., 2014, MNRAS, 439, 1648
- Asmus et al. (2015) Asmus D., Gandhi P., Hönig S. F., Smette A., Duschl W. J., 2015, MNRAS, 454, 766
- Arribas et al. (2012) Arribas S., et al. 2012, A&A, 541, A20
- Arribas et al. (2014) Arribas S., et al. 2014, A&A, 568, A14
- Boksenberg et al. (1977) Boksenberg A., Carswell R. F., Allen, D. A. et al. 1977, MNRAS, 178, 451
- Brandl et al. (2006) Brandl B. R. et al., 2006, ApJ, 653, 1129
- Burtscher et al. (2013) Burtscher L., et al. 2013, A&A, 558, A149
- Cao et al. (2008) Cao C., Xia X. Y., Wu H., Mao S., Hao C. N., Deng Z. G. 2008, MNRAS, 390, 336
- Di Matteo et al. (2005) Di Matteo T., Springel V., Hernquist L., 2005, Nature, 433, 604
- Diamond-Stanic & Rieke (2012) Diamond-Stanic A. M., Rieke G. H., 2012, ApJ, 746, 168
- Díaz-Santos et al. (2008) Díaz-Santos T., Alonso-Herrero A., Colina L., Packham C., Radomski J., Telesco C., 2008, ApJ, 684, 211
- Díaz-Santos et al. (2010) Díaz-Santos T., Alonso-Herrero A., Colina L., Packham C., Levenson N. A., Pereira-Santaella M., Roche P. F., Telesco C., 2010, ApJ, 711, 328
- Díaz-Santos et al. (2011) Díaz-Santos T. et al. 2011, ApJ, 741, 32
- Esquej et al. (2014) Esquej P. et al., 2014, ApJ, 780, 86
- Evans et al. (2006) Evans A. S., Solomon P. M., Tacconi L. J., Vavilkin T., Downes D., 2006, AJ, 132, 2398
- Farrah et al. (2007) Farrah D., et al. 2007, ApJ, 667, 149
- Farrah et al. (2009) Farrah D., Connolly B., Connolly N. et al. 2009, ApJ, 700, 395
- Fazio et al. (2004) Fazio G. et al. 2014, ApJS, 154, 10
- Feruglio et al. (2013) Feruglio C., Fiore F., Piconcelli E., Cicone C., Maiolino R., Davies R., Sturm E. 2013, A&A, 558, 87
- García-Burillo et al. (2015) García-Burillo S. et al. 2015, A&A, 580, A35
- García-Marín et al. (2006) García-Marín M., Colina L., Arribas S., Alonso-Herrero A., Mediavilla E. 2006, ApJ, 650, 850
- García-Marín (2007) García-Marín M., 2007, PhD, Universidad Autónoma de Madrid
- García-Marín et al. (2009) García-Marín M., Colina L., Arribas S., Monreal-Ibero A. 2009, A&A, 505, 1319
- Glikman et al. (2012) Glikman E. et al. 2012, ApJ, 757, 51
- González-Martín et al. (2009) González-Martín O. et al., 2009, ApJ, 704, 1570
- González-Martín et al. (2013) González-Martín O. et al., 2013, A&A, 553, A35
- Goulding et al. (2012) Goulding A. D. et al. 2012, ApJ, 755, 5
- Haas et al. (2003) Haas M. et al. 2003, A&A, 402, 87
- Hatziminaoglou et al. (2015) Hatziminaoglou E., Hernán-Caballero A., Feltre A., Piñol Ferrer N., 2015, ApJ, 803, 110
- Heckman et al. (2015) Heckman T., Alexandroff R. M., Borthakur S., Overzier R., Leitherer C. 2015, ApJ, 809, 147
- Hernán-Caballero & Hatziminaoglou (2011) Hernán-Caballero A., Hatziminaoglou E., 2011, MNRAS, 414, 500
- Hernán-Caballero et al. (2015) Hernán-Caballero A. et al. 2015, ApJ, 803, 109
- Hönig & Kishimoto (2010) Hönig S., Kishimoto M., 2010, A&A, 523, A27
- Hönig et al. (2010) Hönig S. F., Kishimoto M., Gandhi P., Smette A., Asmus D., Duschl W., Polletta M., Weigelt G., 2010, A&A, 515, 23
- Hopkins et al. (2006) Hopkins P. F., et al. 2006, ApJS, 163, 1
- Hopkins et al. (2008) Hopkins P. F., Hernquist L., Cox T. J., Keres D. 2008, ApJS, 175, 356
- Hopkins & Quataert (2010) Hopkins P. F., Quataert E., 2010, MNRAS, 407, 1529
- Hopkins (2012) Hopkins P. F. 2012, MNRAS, 420, L8
- Houck et al. (2004) Houck J. R., et al. 2004, ApJS, 154, 1
- Hung et al. (2014) Hung C.-L., et al. 2014, ApJ, 791, 63
- Ichikawa et al. (2015) Ichikawa K., et al. 2015, ApJ, 803, 57
- Imanishi et al. (2007) Imanishi M., Dudley C. C., Maiolino R., Maloney P. R., Nakagawa T., Risaliti G. 2007, ApJS, 171, 72
- Kim et al. (1995) Kim D.-C., Sanders D. B., Veilleux S., Mazzarella J. M., Soifer B. T. 1995, ApJS, 98, 129
- Komossa et al. (2003) Komossa S., Burwitz V., Hasinger G., Predehl P., Kaastra J. S., Ikebe Y., 2003, ApJ, 582, L15
- Kroupa (2002) Kroupa P. 2002, Science, 295, 82
- Lagage et al. (2004) Lagage P. O., Pel J. W., Authier M., et al. 2004, Msngr, 117, 12
- Larson et al. (2016) Larson K. L. et al. 2016, ApJ, in press (arXiV:1605.05417)
- Lebouteiller et al. (2011) Lebouteiller V., Barry D. J., Spoon H. W. W., et al. 2011, ApJS, 196, 8
- Levenson et al. (2001) Levenson N. A., Weaver K. A., Heckman T. M., 2001, ApJS, 133, 269
- Levenson et al. (2007) Levenson N. A., Sirocky M. M., Hao L., Spoon H. W. W., Marshall J. A., Elitzur M., Houck J. R., 2007, ApJ, 654, L45
- Low et al. (1989) Low F. J., Cutri R. M., Kleinmann S. G., Huchra J. P., 1989, ApJ, 340, L1
- Martínez-Paredes et al. (2015) Martínez Paredes M., Alonso-Herrero A., Aretxaga I. et al. 2015, MNRAS, 454, 3577
- Martínez-Paredes et al. (2016) Martínez Paredes M., Aretxaga I., Alonso-Herrero A., et al. 2016, MNRAS, in preparation
- Mateos et al. (2016) Mateos S., Carrera F., Alonso-Herrero A. et al. 2016, ApJ, 819, 166
- Mazzarella et al. (1991) Mazzarella J. et al. 1991, AJ, 102, 1241
- Medling et al. (2014) Medling A. M. et al. 2014, ApJ, 784, 70
- Medling et al. (2015) Medling A. M. et al. 2015, MNRAS, 448, 2301
- Mor et al. (2009) Mor R., Netzer H., Elitzur M. 2009, ApJ, 705, 298
- Mori et al. (2014) Mori T. I. et al. 2014, PASJ, 66, 93
- Mullaney et al. (2011) Mullaney J. R., Alexander D. M., Goulding A. D., Hickox R. 2011, MNRAS, 414, 1082
- Nardini et al. (2008) Nardini E., Risaliti G., Salvati M., et al. 2008, MNRAS, 385, L130
- Nardini et al. (2010) Nardini E., Risaliti G., Watabe Y., Salvati M., Sani E. 2010, MNRAS, 405, 2505
- Nenkova et al. (2008) Nenkova M., Sirocky M. M., Nikutta R., Ivezic Z., Elitzur M., 2008, ApJ, 685, 160
- Netzer et al. (2007) Netzer H. et al. 2007, ApJ, 666, 806
- Packham et al. (2005) Packham P., Telesco C. M., Hough J. H., Ftaclas C. 2005, Rev. Mex. de Astron. Astrof. Conference Series, 24, 7
- Pereira-Santaella et al. (2015) Pereira-Santaella M., et al. 2015, MNRAS, 454, 3679
- Petric et al. (2011) Petric A., et al. 2011, ApJ, 730, 28
- Piqueras López et al. (2016) Piqueras López J., Colina L., Arribas S., Pereira-Santaella M., Alonso-Herrero A., 2016, A&A, 590, A67
- Piqueras López et al. (2012) Piqueras López J., Colina L., Arribas S., Alonso-Herrero A., Bedregal A. G., 2012, A&A, 546, A64
- Ramos Almeida et al. (2010) Ramos Almeida C., Tadhunter C., Inskip K. J., Morganti R., Holt J., Dicken D., 2011a, MNRAS, 410, 1550
- Ramos Almeida et al. (2011) Ramos Almeida C. et al., 2011b, ApJ, 731, 92
- Ramos Almeida et al. (2014) Ramos Almeida C. et al., 2014, MNRAS, 439, 3847
- Rieke et al. (2015) Rieke G. H. et al. 2015, PASP, 127, 584
- Rigopoulou et al. (1999) Rigopoulou D., Spoon H. W. W., Genzel R., Lutz D., Moorwood A. F. M., Tran Q. D. 1999, AJ, 118, 2625
- Roche et al. (2015) Roche P. F., Alonso-Herrero A., González-Martín O. 2015, MNRAS, 449, 1309
- Sanders et al. (1988) Sanders D. B., Soifer, B. T., Elias J. H. et at., 1988, ApJ, 325, 74
- Sanders & Mirabel (1996) Sanders D. B., & Mirabel F. I., 1996, ARA&A, 34, 749
- Schmidt & Green (1983) Schmidt M., Green R. F., 1983, ApJ, 269, 352
- Shi et al. (2006) Shi Y. et al., 2006, ApJ, 653, 127
- Shi et al. (2007) Shi Y., Ogle P., Rieke G. H., Antonucci R., Hines D. C., et al. 2007, ApJ, 669, 841
- Shipley et al. (2016) Shipley H. V., Papovich C., Rieke G. H., Brown M. J. I., Moustakas J. 2016, ApJ, 818, 60
- Smith et al. (2007) Smith J. D. et al., 2007, ApJ, 656, 770
- Soifer et al. (2002) Soifer B. T., Neugebauer G., Matthews K., Egami E., Weinberger A. J., 2002, AJ, 124, 2980
- Spoon et al. (2007) Spoon H.W.W., Marshall J. A., Houck J. R., Elitzur M., Hao L., Armus L., Brandl B. R., Charmandaris V., 2007, ApJ, 654, L49
- Telesco et al. (2003) Telesco C. M., Ciardi D., French J., et al., 2003, in SPIE Conference Series, Vol. 4841, 913
- Thompson et al. (2009) Thompson G. D., Levenson N. A., Uddin S. A., Sirocky M. M., 2009, ApJ, 697, 182
- Veilleux et al. (1995) Veilleux S., Kim D.-C., Sanders D. B., Mazzarella J. M., Soifer B. T. 1995, ApJS, 98, 171
- Veilleux et al. (2002) Veilleux S., Kim D.-C., Sanders D. B., 2002, ApJS, 143, 315
- Veilleux et al. (2009a) Veilleux S., Rupke D. S. N., Kim D.-C., et al. 2009a, ApJS, 182, 628
- Veilleux et al. (2009b) Veilleux S., Kim D.-C., Rupke D. S. N., et al. 2009b, ApJ, 701, 587
- Veilleux et al. (2013) Veilleux S., Trippe M., Hamann F., et al. 2013, ApJ, 764, 15
- Weedman et al. (2012) Weedman D., Sargsyan L., Lebouteiller V., Houck J., Barry D. 2012, ApJ, 761, 184
- Wright et al. (2015) Wright G. S. et al. 2015, PASP, 127, 595
- Wu et al. (2009) Wu Y., Charmandaris V., Huang J., Spinoglio L., Tommasin S., 2009, ApJ, 701, 658
- Yuan et al. (2010) Yuan T-.T., Kewley L. J., Sanders D. B. 2010, ApJ, 709, 884
Appendix A Examples of spectral decomposition with deblendIRS
Even though deblendIRS was initially designed to perform the spectral decomposition of Spitzer/IRS spectra, it can also be used with ground-based data covering the approximate spectral range m. We only needed to change the spectral range in the deblendIRS configuration file to reflect that covered by the ground-based data. Additionally, from the list of AGN templates we removed those in our sample selected as such (see Hernán-Caballero et al., 2015, for more details). We note, however, that the mid-IR fractional contributions of the STR, PAH, and AGN components and the mid-IR spectral index are for the m spectral range.
We show in Fig. 11 examples of the deblendIRS graphical output of the spectral decomposition of the GTC/CanariCam spectra of two IR-bright galaxy nuclei in our sample, one dominated by the AGN emission (Mrk 463E) and one dominated by star-formation (IRAS 172080014).
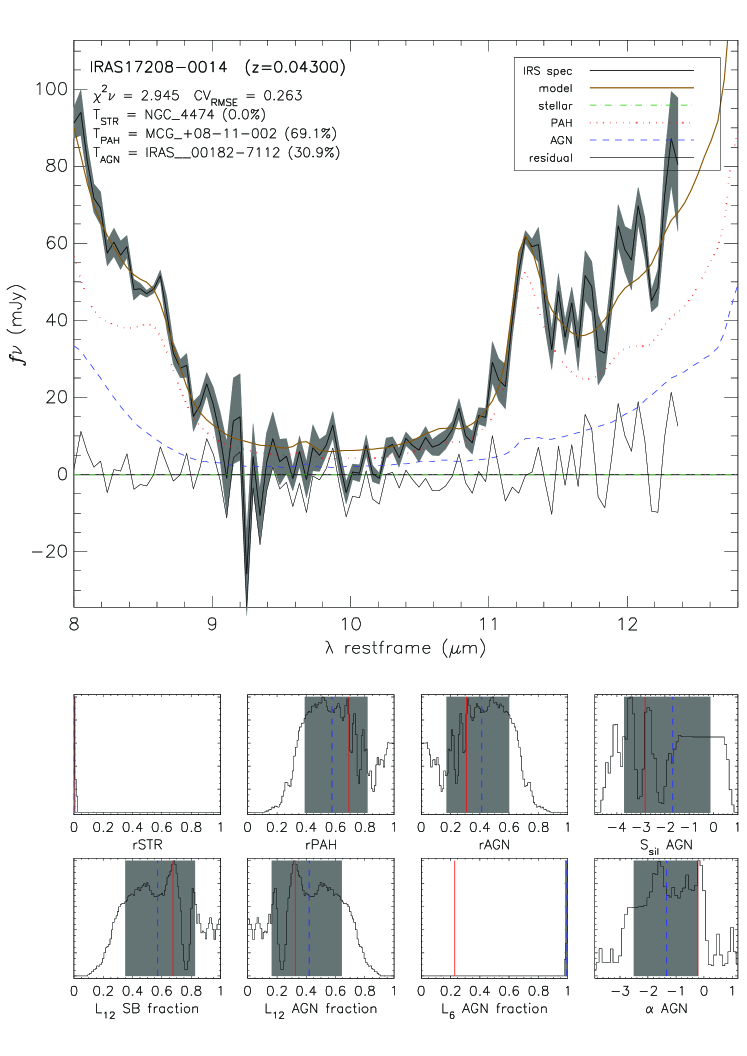
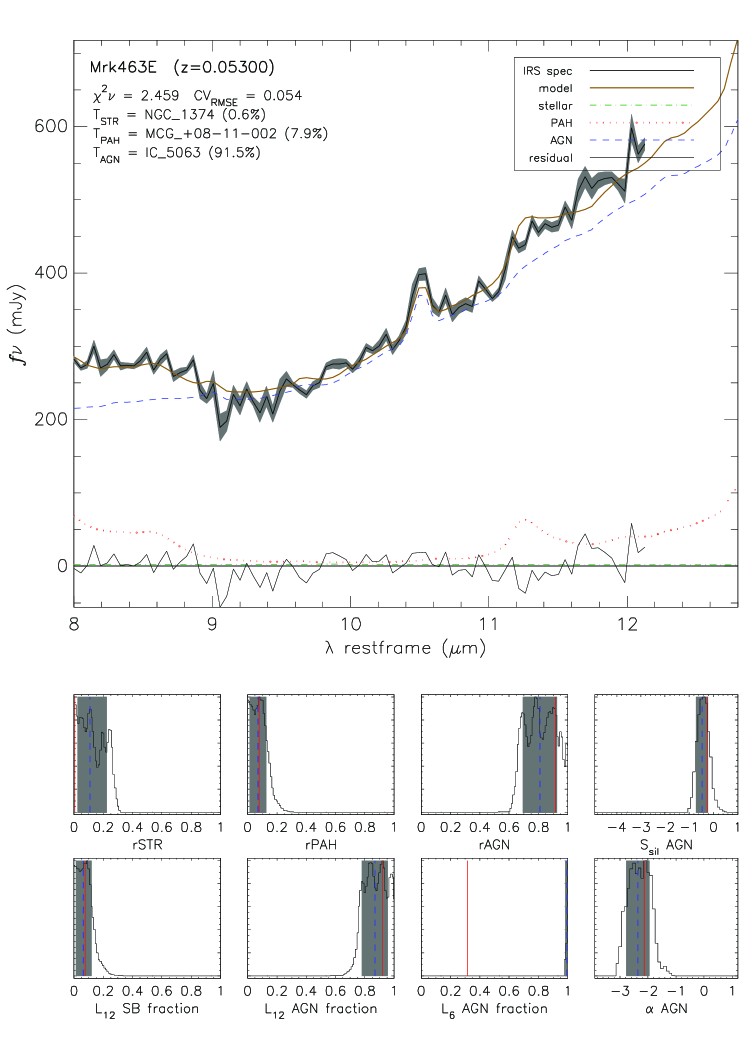
In Section 4.1 we remarked that based on the reduced values, the majority of the ground-based spectra of the IR-bright galaxies and the quasars were well fitted with deblendIRS using IRS templates. However, there are a few cases with relatively high values so we need to determine if this is due to the lack of appropriate spectral templates in the deblendIRS database to fit deep silicate features. In Fig. 12 we plot the reduced value of the best fit against the derived strength of the silicate feature of the AGN component. As can be seen from this figure, there is a tendency for worsening for deeper silicate features cod nuclei with having the deepest silicate feature (). This might be in part due to the limited number of “obscured AGN” templates (22) in the deblendIRS database versus the rest of “bonafide AGN” templates (159, see Hernán-Caballero et al., 2015, for further details). Also, the value does not only depend on the appropriateness of the templates but also the S/N ratio of the spectra.
In objects with very deep silicate absorption features, the flux near the silicate minimum at m is very weak and can be a factor of 100 lower than in the wings at 8 and m. The larger IRS aperture may admit substantially more diffuse emission from the host galaxy than the slits of the ground-based instruments, which can partially fill in the silicate absorption minimum and change the shape of the apparent silicate profile. This effect can be seen in the comparison of the IRS and ground-based TReCS spectra of NGC 4418 in Roche et al. (2015), where the absorption feature in the IRS spectrum is broader than the profile measured with the ground-based instrument TReCS because contributions from extra-nuclear emission flatten the minimum and broaden the wings of the silicate profile whilst enhancing the PAH emission. The same effects can be seen in the fit to IRAS 08572+3915N in Fig. 13. As more and higher quality ground-based spectra become available, it may be possible to employ them as templates, but the broader wavelength coverage available from space missions would not be available. In the same figure we also show the other two IR-bright nuclei whose fits have . IC 694 might suffer from the same problem with the silicate feature as IRAS 08572+3915N but it is not as extreme. Also the high value of is due to the relatively poor fits of the PAH features. In any case, both nuclei have small uncertainties in the derived AGN value due the above mentioned small number of “obscured AGN” templates. For NGC 6240S the high value of is likley caused by a bad atmospheric correction around m and at the edges of the spectrum. We conclude that for most objects in our sample the IRS templates are appropriate for the spectral decomposition of the nuclear mid-IR spectra.
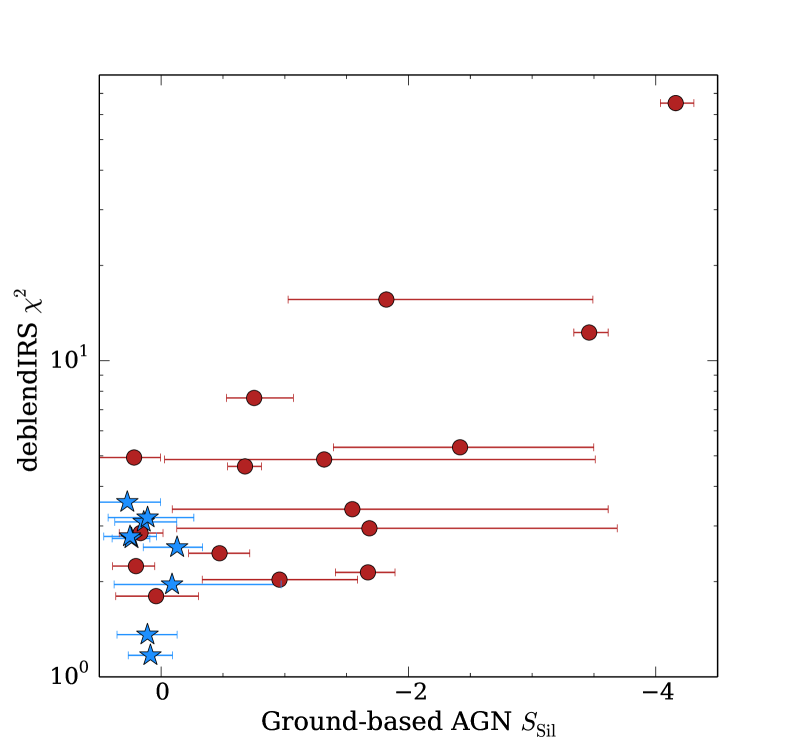
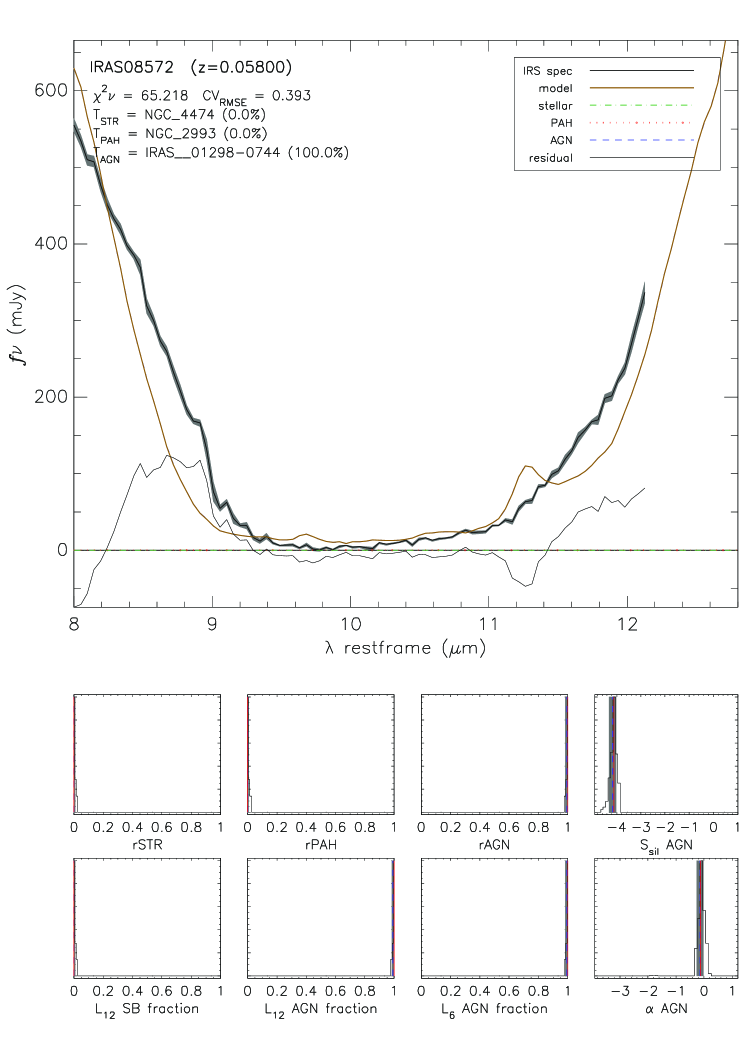
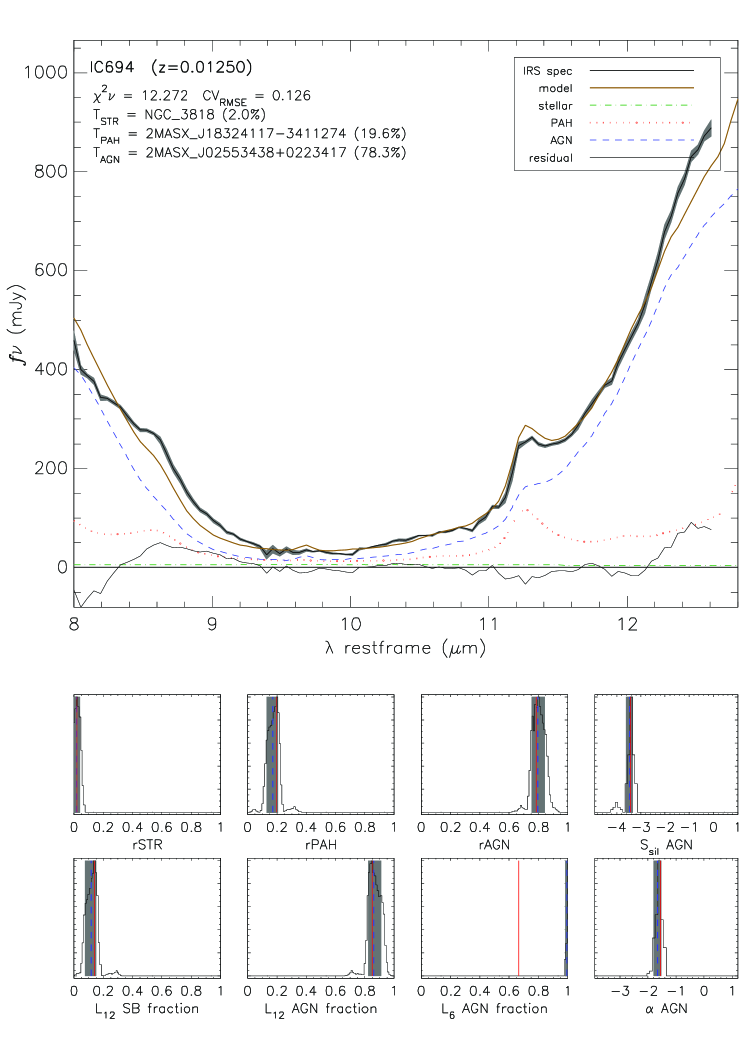
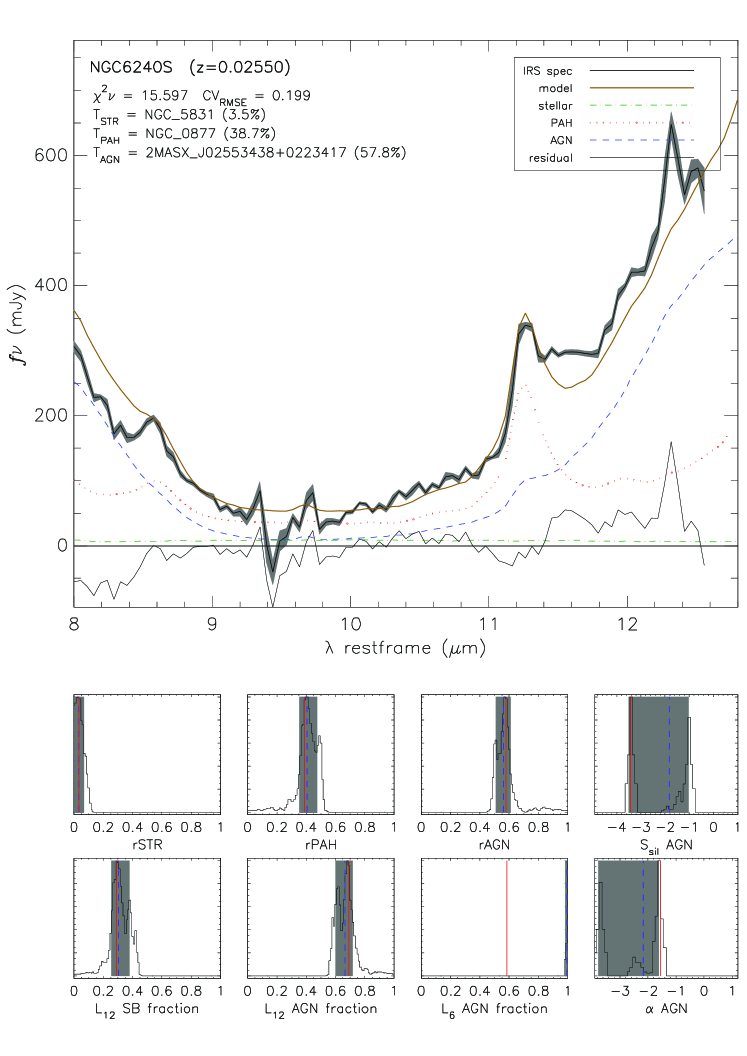
Appendix B Comparison of deblendIRS results for Spitzer/IRS and high angular resolution ground-based spectra
In this appendix we compare the AGN m spectral index and the strength of the silicate feature derived with deblendIRS using Spitzer/IRS SL spectroscopy (3.7 arcsec slit width) and high-angular resolution ground-based spectroscopy (slit widths between 0.52 and 0.75 arcsec) for the samples of IR-bright galaxies and quasars. As done for the ground-based data, for the Spitzer/IRS spectra we only fitted the approximate spectral range m with deblendIRS. We show the comparison between the derived AGN and in Fig. 14. As can be seen from this figure, the agreement between the derived AGN properties is good within the derived uncertainties. While the uncertainties of the derived AGN and for the quasars are similar for the ground-based and IRS spectra, in some IR-bright nuclei, especially those with low AGN fractional components, the IRS uncertainties are slightly smaller probably due to the higher S/N ratio of the IRS spectra. The most discrepant points correspond to some of the IR-bright nuclei with deep silicate features and/or for which the Spitzer/IRS spectroscopy could not isolate the individual nuclei (e.g., NGC 6240 and IRAS 143481447).