Resolving the planet-hosting inner regions of the LkCa 15 disk$\star$$\star$affiliation: Based on data collected at the European Southern Observatory, Chile (ESO Programme 096.C-0248(A)).
Abstract
LkCa 15 hosts a pre-transitional disk as well as at least one accreting protoplanet orbiting in its gap. Previous disk observations have focused mainly on the outer disk, which is cleared inward of 50 au. The planet candidates, on the other hand, reside at orbital radii around 15 au, where disk observations have been unreliable until recently. Here we present new -band imaging polarimetry of LkCa 15 with SPHERE IRDIS, yielding the most accurate and detailed scattered-light images of the disk to date down to the planet-hosting inner regions. We find what appear to be persistent asymmetric structures in the scattering material at the location of the planet candidates, which could be responsible at least for parts of the signals measured with sparse-aperture masking. These images further allow us to trace the gap edge in scattered light at all position angles and search the inner and outer disks for morphological substructure. The outer disk appears smooth with slight azimuthal variations in polarized surface brightness, which may be due to shadowing from the inner disk or a two-peaked polarized phase function. We find that the near-side gap edge revealed by polarimetry matches the sharp crescent seen in previous ADI imaging very well. Finally, the ratio of polarized disk to stellar flux is more than six times larger in -band than in the bands.
Subject headings:
circumstellar matter — planets and satellites: formation — protoplanetary disks — stars: individual (LkCa 15) — stars: pre-main sequence — techniques: high angular resolution1. Introduction
Transitional disks have properties that can be interpreted as intermediate between the protoplanetary and debris disk phases, with an optically thick outer disk and typically a wide (tens of au) gap within (e.g., Strom et al., 1989; Calvet et al., 2005). One possible origin for such gaps is dynamical clearing by forming planets. The transitional disk host LkCa 15 has emerged as a benchmark target for this scenario. LkCa 15 is a K5-type star at a distance of 140 pc located in the Taurus-Auriga star-forming region (Simon et al., 2000). Resolved imaging ranging from the visible to millimeter wavelengths (e.g., Andrews et al., 2011; Thalmann et al., 2014; Isella et al., 2014) confirmed the morphological structure implied from spectral energy distribution (SED) fitting (Espaillat et al., 2007), all showing an outer disk truncated inward of 50 au. Recent scattered light imaging also revealed an inner disk component within the gap structure (Thalmann et al., 2015; Oh et al., 2016).
LkCa 15 stands out in that directly imaged planet candidates have been reported in the system. The first candidate was published by Kraus & Ireland (2012), and subsequently two more were proposed by Sallum et al. (2015). We follow the three-object nomenclature of Sallum et al. (2015), in which ‘b’ refers to a candidate at 14.7 au which displays H emission, with ‘c’ and ‘d’ following counterclockwise. The H emission of ‘b’ makes a particularly compelling case for a protoplanet, as it implies active gas accretion.
Here we present new deep, high-contrast images of LkCa 15 with SPHERE (Spectro-Polarimetric High-contrast Exoplanet REsearch; Beuzit et al. 2008), offering the first full map of the gap’s outer edge and revealing the inner disk structures hinted at by earlier studies. These images also serve to complement the observations in which the planet candidates were discovered, where the precise morphology of the emission cannot be uniquely determined (with the exception of the H imaging), since they are based on sparse-aperture masking (SAM) and thus do not fully sample the pupil plane of the telescope.
2. Observations and data reduction
On 2015-12-19, we obtained two sets of imaging polarimetry data with the IRDIS branch (Dohlen et al., 2008; Langlois et al., 2014) of SPHERE at the European Southern Observatory’s Very Large Telescope. The extreme adaptive optics (SAXO; Fusco et al. 2006) yielded a point-spread function (PSF) with a FWHM of 4 pixels ( mas) in the broadband filter (BB_J, 1.26 m) under good conditions (seeing 06–08 in -band).
The first observation, hereafter named Deep, aimed at maximizing sensitivity for the faint disk structures and therefore employed the N_ALC_YJ_S coronagraph (apodized Lyot, inner working angle 80 mas) with long exposures (32 s). The observation comprised 15 polarimetric cycles of 2 exposures at each of the 4 standard half-wave plate positions for a total of 3840 s of exposure.
The second observation, Fast, was executed immediately afterwards without coronagraph and with minimal exposure times (0.85 s) to leave the star unsaturated and grant access to the innermost regions. Three polarimetric cycles with 40 exposures per position yielded 102 s of exposure.
Frame registration was performed on Fast by fitting two-dimensional Gaussians to the unsaturated target star in each frame. Since those measured star locations appeared stable (jitter 2 mas) with no visible drift, we adopted their median star location for all Deep frames. Apart from removing the coronagraph, no changes were made to the instrument setup between Deep and Fast runs.
The data were reduced using custom IDL routines implementing the double-ratio polarimetry and empirical correction of instrumental and stellar polarization from Avenhaus et al. (2014). We present the results as polar-coordinate Stokes components (, ), in which positive signals correspond to azimuthally oriented linear polarization (Quanz et al., 2013; Avenhaus et al., 2014; Thalmann et al., 2015). In face-on or mildly inclined circumstellar disks, this convention maps almost all scattered light into positive signal. However, due to LkCa 15’s inclination of 50∘ (Thalmann et al., 2014), multiple-scattering events also produce faint signals (Canovas et al., 2015). therefore provides an upper limit for the noise level.
Furthermore, on 2015-11-29, we obtained non-polarimetric imaging, hereafter named Full, with SPHERE IRDIS in dual-band imaging mode (DBI; Vigan et al. 2010) with the K1K2 filter ( m, m) as part of the SpHere INfrared survey for Exoplanets (SHINE; Chauvin et al. 2016 in prep). Pupil tracking was used to allow for angular differential imaging (ADI, Marois et al. 2006). We obtained a sequence of 4288 s totalling a field rotation of 24.5∘, using the N_ALC_YJH_S coronagraph (apodized Lyot, inner working angle 93 mas). Non-coronagraphic frames were obtained before and after the coronagraphic sequence for photometric calibration. All data were reduced with the SPHERE pipeline (Pavlov et al., 2008) and additional analysis tools implemented at the SPHERE data centre, including ADI with KLIP (5 subtracted modes, 24.5∘ field rotation; Soummer et al., 2012; Pueyo et al., 2015). However, since these observations are less sensitive to planets than previous studies, we only use them to complement our disk analysis (see Section 3.3).
3. Results and Discussion
3.1. Imagery
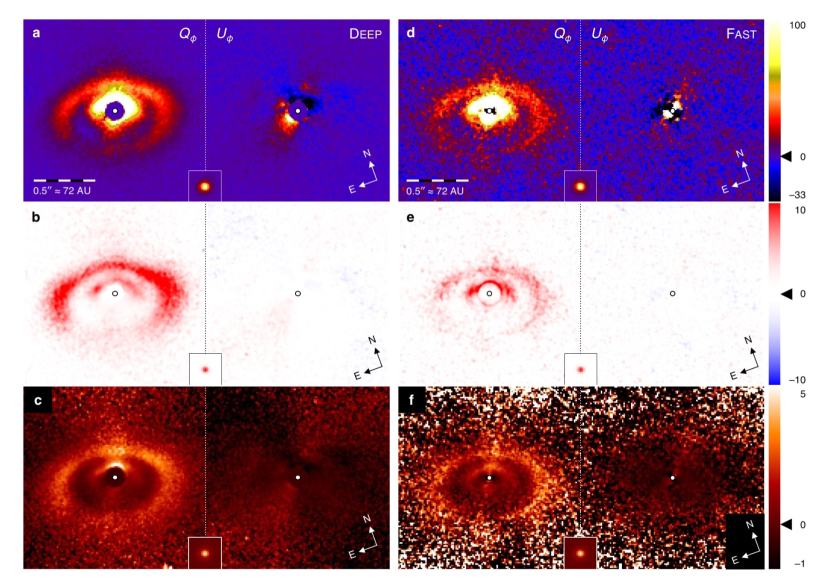
Our -band polarimetry of LkCa 15 is shown in Figure 1. The Deep images (Fig. 1a) reveal the inner and outer disk components and the gap between them at much higher S/N than previously achieved (Thalmann et al., 2015). To quantify the detection, we calculate S/N maps (Fig. 1b) by dividing the and images by a radial noise profile obtained by calculating the standard deviation of pixel values in concentric annuli in the image. Both disk components are detected at high significance in , with local S/N exceeding 5 over an area of 0.23 arcsec2 and peaking at 11 . Finally, we present the and images after scaling with an map, where represents the estimated physical distance of each pixel’s scattering material from the star, assuming it lies on the disk’s inclined midplane (50∘; Fig. 1c). This counteracts the dependency of the scattered-light intensity and thus reduces the dynamic range of the image, rendering disk components at different separations directly comparable. This reveals the inner edge of the outer disk as a sharp intensity step (60% over 1 FWHM, cf. Section 3.4) in , allowing us to trace the edge at all position angles for the first time. The residuals in the image appear as a faint quadrupole pattern diagonal to the principal axes of the projected disk, as expected from higher-order scattering (Canovas et al., 2015). The brightest structures in -scaled are 4 times fainter than those in -scaled .
Figures 1d–f show the same images for Fast. Despite the lower sensitivity, the same structures as in Deep can be discerned. The calculated S/N drops sharply within a radius of 80 mas, though this could be due to astrophysical signal from higher-order scattering dominating the image at those separations, causing the noise to be overestimated. For now, we assume that Fast does not detect the disk at smaller separations than Deep. However, the disk structures appear notably sharper in Fast. This may be due to the fact that those were registered on a frame-to-frame basis, whereas the long exposure times and global registration of Deep may have introduced some smearing.
3.2. Inner disk structure and planet candidates
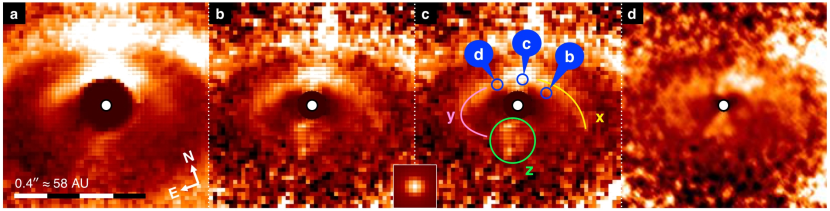
Whereas the imagery in Thalmann et al. (2015) and Oh et al. (2016) sufficed to discover and confirm the presence of scattered light from the inner disk, our new data now allow us to investigate its morphology. Figure 2 shows a comparison of the inner regions of the -scaled images from Deep (panel a) and Fast (b, c) as well as our previously published -band data (d; Thalmann et al. 2015).
All three images show the inner disk in strikingly similar morphology. The polarized flux is contained in a roughly elliptical area comparable in shape and orientation to the outer disk, but about half as large in each dimension. We note a number of morphological features that appear persistent between the three images, as marked in Figure 2c: a bright crescent on the near side of the disk, reminiscent of the full-intensity scattered-light appearance of the outer disk (Thalmann et al., 2010, 2013); a slight asymmetry between the two crescent arms, with the western arm (‘x’) seemingly trending outward while the eastern arm (‘y’) curls inward; and a local brightening along the far side of the minor axis (‘z’).
Furthermore, the area within this crescent appears darkened, giving the impression of another gap in the inner disk. However, we caution that polarimetric efficiency drops in the innermost resolution elements, where the positive/negative pattern in and is too small to be cleanly resolved (Avenhaus et al., 2014). This could mimic a gap.
Figure 2c also indicates the positions of the three proposed planet candidates (‘b’, ‘c’, ‘d’; cf. Sallum et al., 2015, LBT joint fit results), which coincide with the bright, forward-scattering side of the inner disk. The analysis and interpretation of SAM data is challenging and potentially even misleading in the presence of scattered light from a disk (e.g., Olofsson et al. 2013, Sallum et al. 2015, Cheetham et al. 2015, Caceres et al. in prep.); thus, the inner disk might account for some or even all of the SAM signal attributed to protoplanets. On the other hand, H imaging makes a strong case for a protoplanet at ‘b’, which could be confirmed with a re-detection in H showing orbital motion. Such a protoplanet could be responsible for the substructure in the inner disk.
3.3. Outer disk structure
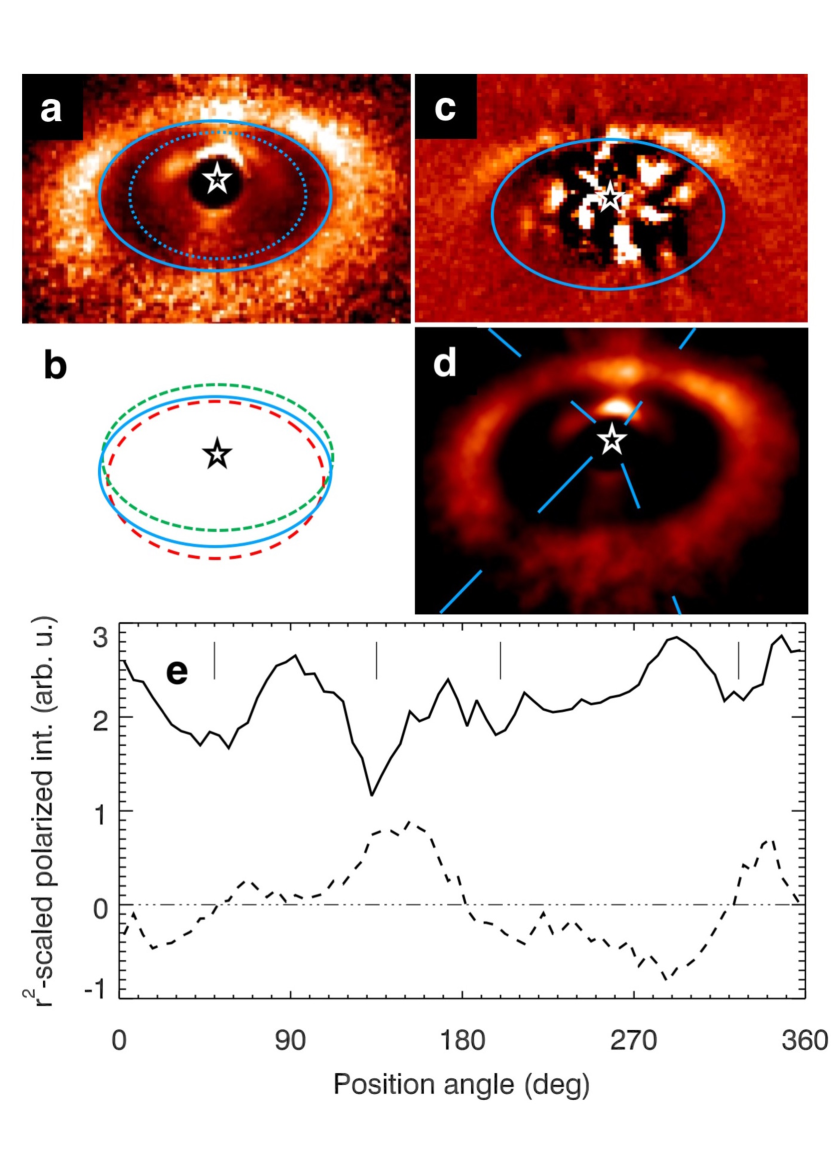
In the -scaled images, the outer disk appears as a diffuse region of roughly flat brightness bounded on the inside by a sharp elliptical edge. We employ the maximum merit method (Thalmann et al., 2011) to fit a parametric ellipse onto the Deep image that maximizes the brightness contrast between the annular regions immediately inside and outside of the ellipse, as detailed in Thalmann et al. (2015). We fix the position angle of the major axis to 60∘ (cf. Thalmann et al. 2014). The resulting ellipse is shown in solid blue in Figure 3a. The fit ellipse matches the perceived gap edge accurately.
To separate the inner and outer disk for further analysis, we also fit a second ellipse along which the -scaled intensity is minimized. This ellipse is shown in dotted blue in Figure 3a. The numerical parameter of both ellipses are given in Table 1. For errors, we “fit” similar ellipses to and measure the standard deviation of the resulting merits. The error intervals represent the family of ellipses whose merits are less than one standard deviation below the best fit.
Figure 3b compares the gap edge fit ellipses in -band polarimetry (this work; solid blue) to those in -band polarimetry (Thalmann et al. 2015; long-dashed red) and sub-millimeter interferometry (Isella et al. 2014; short-dashed green) with respect to the star’s position. Our new data confirm the eccentric scattered-light gap contrasting with the symmetric gap in sub-millimeter thermal emission. Due to the tapered gap wall, inclination cannot explain this eccentricity (Thalmann et al., 2014), whereas shadowing from the inner disk could (Thalmann et al., 2015). The eccentricity appears slightly lower than in -band. This could be due to the poorly constrained far-side edge in the -band data, color-dependent polarized reflectivity, chromatic filtering by the inner disk halo, or a temporal evolution of the shadowing postulated as the origin of the eccentric scattered-light gap.
Figure 3c shows the -band gap ellipse superimposed on the -band full-intensity KLIP image of the Full data. The ellipse coincides exactly with the sharp inner edge of the bright forward-scattering crescent, confirming the long-held assumption that such crescents in ADI images accurately trace the near-side gap edge even though the fainter parts of the disk suffer from oversubtraction effects.
The Deep data are sensitive enough to search for substructure in the outer disk. While we find no sign of spirals or structural asymmetries, we note significant variations in the azimuthal distribution. In particular, the disk appears locally dimmed in radial lanes around azimuths 50∘, 135∘, 200∘, and 325∘ (see Figure 3d, e). Furthermore, near-side gap edge shows similar substructure in the Full and Deep images.
One possible scenario is that these dark lanes indicate shadows cast by inner disk regions (Marino et al., 2015; Stolker et al., 2016) or magnetospheric accretion columns (Bodman et al., 2016). The inner and outer disks do have similar azimuthal structure.
An alternative explanation is that a polarized scattering phase function with peaks in both the forward and backward directions (e.g., Min et al., 2016) could brighten the projected disk along its minor axis (Stolker et al. in prep.). A case study for this scenario is HD100546 (Garufi et al., 2016), where a bright wedge surrounded by two dark wedges was detected along the near-side minor axis. Another analogy between these two datasets is the presence of a tenuous counterpart to the bright wedge in , which is roughly 45∘ displaced from it. This detection may suggest small departures from centrosymmetric scattering as expected from multiple scattering in inclined disks (Canovas et al., 2015).
3.4. Polarized surface brightness profiles
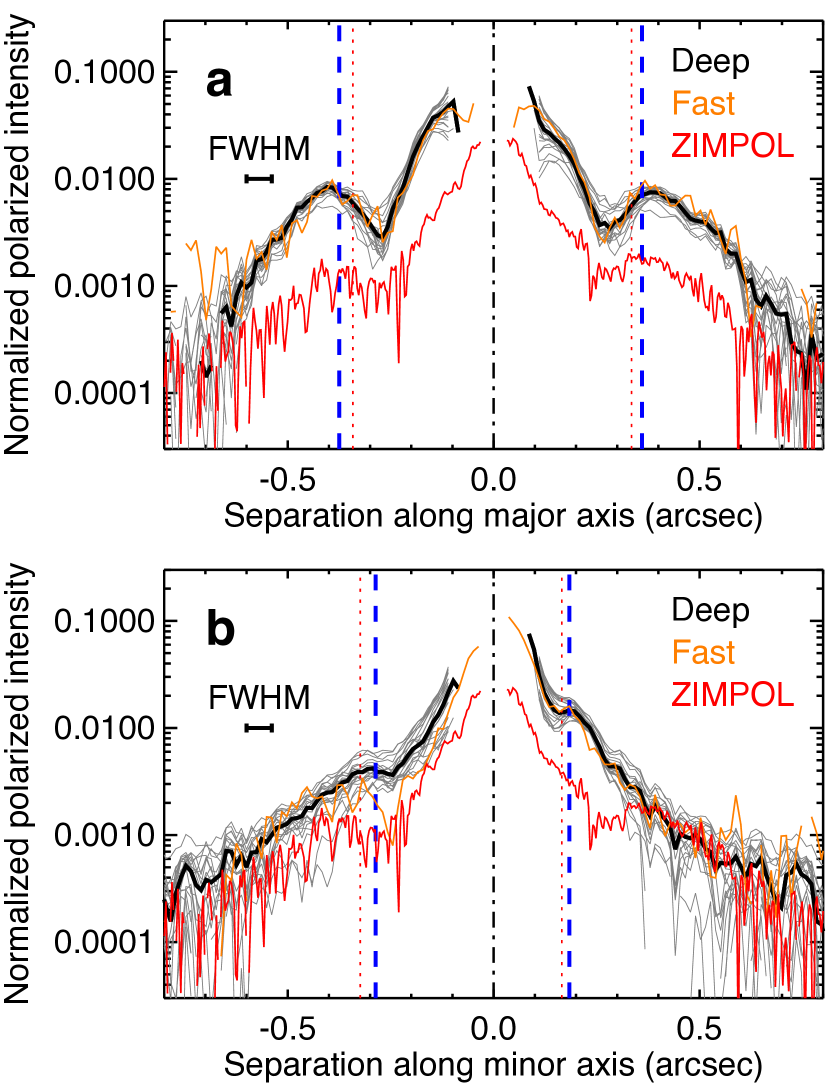
To quantify the amount of polarized light detected, we calculate surface brightness profiles in the image without scaling. We extract a 86 mas wide strip along the major axis of the projected disk (position angle 60∘; Thalmann et al. 2014) and a 257 mas wide strip along the minor axis, and average the pixel values across the width to obtain one-dimensional profiles. We then divide each profile by the sum of all pixel values in the unsaturated stellar full-intensity PSF (out to 123) and by the solid angle on sky corresponding to a pixel (001232). The values of the resulting profiles therefore measure the local polarized flux density of the disk in units of stellar flux per square arcsecond. The resulting values do not explicitly depend on pixel size or wavelength and therefore allow for direct comparison between optical and infrared measurements. (This differs from the normalization used in Thalmann et al. 2015.)
Figures 4a and b show the profiles for the major and minor axis, respectively. The solid black curve corresponds to Deep. To visualize the uncertainty level, we extract a number of equivalent profiles from the Deep image and add them to the measured profiles, yielding the family of grey curves. The thin orange curves are the profiles for Fast, which match the Deep results well. We also show the corresponding profiles for the -band data from Thalmann et al. (2015) as thin red curves. While the morphology of the - and -band profiles is similar, the latter is significantly brighter overall.
We investigate this effect by summing the image over the detectable parts of the inner and outer disks in each filter. We sample the inner disk from a radius of 70 mas out to the flux-minimum fit ellipse (dotted blue in Fig. 3a), and the outer disk from that ellipse out to a radius of 1225. We find that the polarized disk flux to stellar flux ratio is 6.4 times larger in than in for the inner disk, and 6.6 times for the outer disk. The polarized flux ratio between the inner and outer disk area appears stable with wavelength (0.70 in , 0.73 in ). Judging from the images, these figures are accurate on the order of 10%. The numerical results are summarized in Table 1.
| -band | -band | |||||
|---|---|---|---|---|---|---|
| Outer disk gap edge | ||||||
| Semimajor axis (mas) | 367 | 338 | ||||
| — (au) | 51.5 | 47.4 | ||||
| Semiminor axis (mas) | 235 | 245 | ||||
| — (au) | 32.9 | 34.3 | ||||
| Major-axis offset (mas) | ||||||
| — (au) | ||||||
| Minor-axis offset (mas) | ||||||
| — (au) | ||||||
| Gap minimum | ||||||
| Semimajor axis (mas) | 276 | |||||
| — (au) | 38.6 | |||||
| Semiminor axis (mas) | 196 | |||||
| — (au) | 27.4 | |||||
| Major-axis offset (mas) | ||||||
| — (au) | ||||||
| Minor-axis offset (mas) | ||||||
| — (au) | ||||||
| Polarized disk/star contrast | ||||||
| Inner disk | 0.0025 | 0.00040 | ||||
| Outer disk | 0.0036 | 0.00055 | ||||
| Inner/outer ratio | 0.70 | 0.73 | ||||
The photometry is likely affected by PSF-dependent loss of polarimetric sensitivity at small separations (Avenhaus et al., 2014). However, the fact that we measure consistent color ratios for the inner and outer disks indicates that the differential effect between the two bands is small, most likely because both data sets were taken with the same telescope and AO system.
A higher polarized disk flux at longer wavelengths was also observed for the transition disk HD 135344 B by Stolker et al. (2016), who measured a factor 2 between and bands. This color factor offers an additional diagnostic for the composition of scattering dust. Our ongoing SPHERE observations are measuring polarized colors for many protoplanetary disks, which will allow for a comparative study in the near future.
References
- Andrews et al. (2011) Andrews, S. M., Rosenfeld, K. A., Wilner, D. J., & Bremer, M. 2011, ApJ, 742, L5
- Avenhaus et al. (2014) Avenhaus, H., Quanz, S. P., Schmid, H. M., et al. 2014, ApJ, 781, 87
- Avenhaus et al. (2014) Avenhaus, H., Quanz, S. P., Meyer, M. R., et al. 2014, ApJ, 790, 56
- Beuzit et al. (2008) Beuzit, J.-L., Feldt, M., Dohlen, K., et al. 2008, Proc. SPIE, 7014, 701418
- Bodman et al. (2016) Bodman, E. H. L., Quillen, A. C., Ansdell, M., et al. 2016, arXiv:1605.03985
- Calvet et al. (2005) Calvet, N., D’Alessio, P., Watson, D. M., et al. 2005, ApJ, 630, L185
- Canovas et al. (2015) Canovas, H., Ménard, F., de Boer, J., et al. 2015, A&A, 582, L7
- Cheetham et al. (2015) Cheetham, A., Huélamo, N., Lacour, S., de Gregorio-Monsalvo, I., & Tuthill, P. 2015, MNRAS, 450, L1
- Dohlen et al. (2008) Dohlen, K., Langlois, M., Saisse, M., et al. 2008, Proc. SPIE, 7014, 70143L
- Espaillat et al. (2007) Espaillat, C., Calvet, N., D’Alessio, P., et al. 2007, ApJ, 670, L135
- Fusco et al. (2006) Fusco, T., Rousset, G., Sauvage, J.-F., et al. 2006, Optics Express, 14, 7515
- Garufi et al. (2016) Garufi, A., Quanz, S. P., Schmid, H. M., et al. 2016, A&A, 588, A8
- Isella et al. (2014) Isella, A., Chandler, C. J., Carpenter, J. M., Pérez, L. M., & Ricci, L. 2014, ApJ, 788, 129
- Kraus & Ireland (2012) Kraus, A. L., & Ireland, M. J. 2012, ApJ, 745, 5
- Marino et al. (2015) Marino, S., Perez, S., & Casassus, S. 2015, ApJ, 798, L44
- Marois et al. (2014) Marois, C., Correia, C., Galicher, R., et al. 2014, Proc. SPIE, 9148, 91480U
- Min et al. (2016) Min, M., Rab, C., Woitke, P., Dominik, C., & Ménard, F. 2016, A&A, 585, A13
- Langlois et al. (2014) Langlois, M., Dohlen, K., Vigan, A., et al. 2014, Proc. SPIE, 9147, 91471R
- Marois et al. (2006) Marois, C., Lafrenière, D., Doyon, R., Macintosh, B., & Nadeau, D. 2006, ApJ, 641, 556
- Oh et al. (2016) Oh, D., Hashimoto, J., Tamura, M., et al. 2016, PASJ, 68, L3
- Olofsson et al. (2013) Olofsson, J., Benisty, M., Le Bouquin, J.-B., et al. 2013, A&A, 552, A4
- Pavlov et al. (2008) Pavlov, A., Feldt, M., & Henning, T. 2008, Astronomical Data Analysis Software and Systems XVII, 394, 581
- Pueyo et al. (2015) Pueyo, L., Soummer, R., Hoffmann, J., et al. 2015, ApJ, 803, 31
- Quanz et al. (2013) Quanz, S. P., Avenhaus, H., Buenzli, E., et al. 2013, ApJ, 766, L2
- Sallum et al. (2015) Sallum, S., Follette, K. B., Eisner, J. A., et al. 2015, Nature, 527, 342
- Simon et al. (2000) Simon, M., Dutrey, A., & Guilloteau, S. 2000, ApJ, 545, 1034
- Soummer et al. (2012) Soummer, R., Pueyo, L., & Larkin, J. 2012, ApJ, 755, L28
- Stolker et al. (2016) Stolker, T., Dominik, C., Avenhaus, H., et al. 2016, arXiv:1603.00481
- Strom et al. (1989) Strom, K. M., Strom, S. E., Edwards, S., Cabrit, S., & Skrutskie, M. F. 1989, AJ, 97, 1451
- Thalmann et al. (2008) Thalmann, C., Schmid, H. M., Boccaletti, A., et al. 2008, Proc. SPIE, 7014, 70143F
- Thalmann et al. (2010) Thalmann, C., Grady, C. A., Goto, M., et al. 2010, ApJ, 718, L87
- Thalmann et al. (2011) Thalmann, C., Janson, M., Buenzli, E., et al. 2011, ApJ, 743, L6
- Thalmann et al. (2013) Thalmann, C., Janson, M., Buenzli, E., et al. 2013, ApJ, 763, L29
- Thalmann et al. (2014) Thalmann, C., Mulders, G. D., Hodapp, K., et al. 2014, A&A, 566, A51
- Thalmann et al. (2015) Thalmann, C., Mulders, G. D., Janson, M., et al. 2015, ApJ, 808, L41
- Vigan et al. (2010) Vigan, A., Moutou, C., Langlois, M., et al. 2010, MNRAS, 407, 71