Identification of milestone papers through time-balanced network centrality
Abstract
Citations between scientific papers and related bibliometric indices, such as the -index for authors and the impact factor for journals, are being increasingly used – often in controversial ways – as quantitative tools for research evaluation. Yet, a fundamental research question remains still open: to which extent do quantitative metrics capture the significance of scientific works? We analyze the network of citations among the papers published by the American Physical Society (APS) journals between and , and focus on the comparison of metrics built on the citation count with network-based metrics. We contrast five article-level metrics with respect to the rankings that they assign to a set of fundamental papers, called Milestone Letters, carefully selected by the APS editors for “making long-lived contributions to physics, either by announcing significant discoveries, or by initiating new areas of research”. A new metric, which combines PageRank centrality with the explicit requirement that paper score is not biased by paper age, is the best-performing metric overall in identifying the Milestone Letters. The lack of time bias in the new metric makes it also possible to use it to compare papers of different age on the same scale. We find that network-based metrics identify the Milestone Letters better than metrics based on the citation count, which suggests that the structure of the citation network contains information that can be used to improve the ranking of scientific publications. The methods and results presented here are relevant for all evolving systems where network centrality metrics are applied, for example the World Wide Web and online social networks. An interactive Web platform where it is possible to view the ranking of the APS papers by rescaled PageRank is available at the address http://www.sciencenow.info.
I Introduction
The notion of quantitative evaluation of scientific impact builds on the basic idea that the scientific merits of papers narin1976evaluative ; radicchi2008universality , scholars hirsch2005index ; egghe2006theory , journals pinski1976citation ; liebowitz1984assessing ; bollen2006journal , universities kinney2007national ; molinari2008new and countries king2004scientific ; cimini2014scientific can be gauged by metrics based on the received citations. The respective field, referred to as bibliometrics or scientometrics, is undergoing a rapid growth van2010metrics fueled by the increasing availability of massive citation datasets collected by both academic journals and online platforms, such as Google Scholar and Web of Science. The possible benefits, drawbacks and long-term effects of the use of bibliometric indices are being highly debated by scholars from diverse fields van2005fatal ; weingart2005impact ; lawrence2008lost ; hicks2015bibliometrics ; werner2015focus .
Although some effort has been devoted to contrast different metrics with respect to their ability to single out seminal papers dunaiski2012comparing ; yao2014ranking ; zhou2015ranking ; dunaiski2016evaluating , differences among the adopted benchmarking procedures and diverse conclusions of the mentioned references leave a fundamental question still open: which metric of scientific impact best agrees with expert-based perception of significance? In agreement with ref. wasserman2015cross , the significance of a scientific work is intended here as its enduring importance within the scientific community.
To address this question, we focus on a list of physics papers of outstanding significance – called Milestone Letters – recently made available by the American Physical Society (APS) [http://journals.aps.org/prl/50years/milestones, accessed 25-11-2015]. According to the APS editors’ description, the Milestone Letters “have made long-lived contributions to physics, either by announcing significant discoveries, or by initiating new areas of research”. These articles have been carefully selected by the editors of the APS, and the choices are motivated in detail in the webpage; the fact that a large fraction of them led to Nobel Prize for some of their authors is an indication of the exceptional level of the selected works.
In this work, we analyze the network of citations between the papers published in APS journals from until to compare five article-level metrics with respect to the ranking position they assign to the Milestone Letters. A reliable expert-based evaluation of the significance (intended as enduring importance, as in ref. wasserman2015cross ) of a paper necessarily requires a time lag between the paper’s publication date and the expert’s judgment. For example, there is a time interval of years between the most recent Milestone Letter (from ) and the year at which the list of Milestone Letters was released (). However, we show that a well-designed quantitative metric offers us the opportunity to detect potentially significant papers relatively short after their publication – an aspect often neglected in the evaluation of bibliometric indicators. To show this, we study how the ability of the different metrics to identify the Milestone Letters changes with paper age.
A plethora of quantitative metrics exist and could be studied in principle. Our focus here is narrowed to metrics that rely on a diffusion process on the underlying network of citations between papers and their comparison with simple citation count. The five metrics considered in this work are thus: the citation count, PageRank brin1998anatomy , CiteRank walker2007ranking , rescaled citation count newman2009first , and novel rescaled PageRank. PageRank is a classical network centrality metric which combines a random walk along network links with a random teleportation process. The metric has been applied to a broad range of real-world problems (see refs. franceschet2011pagerank ; gleich2015pagerank ; ermann2015google for a review), including ranking academic papers chen2007finding ; yao2014ranking , journals bollen2006journal ; gonzalez2010new and authors radicchi2009diffusion ; yan2009applying ; nykl2014pagerank (see ref. waltman2014pagerank for a review of the applications of PageRank-related methods to bibliometric analysis).
To overcome the well-known PageRank’s bias toward old nodes in citation data (detailedly studied in refs. chen2007finding ; mariani2015ranking ), the CiteRank algorithm introduces exponential penalization of old nodes, resulting in a node score that well captures the future citation count increase of the papers and, for this reason, can be considered as a reasonable proxy for network traffic, as shown by walker2007ranking . However, we show below that CiteRank score does not allow one to fairly compare papers of different age. Rescaled citation count and rescaled PageRank are derived from citation count and PageRank score, respectively, by explicitly requiring that paper score is not biased by age – the adopted rescaling procedure is conceptually close to the methods recently developed in refs. radicchi2008universality ; newman2009first ; radicchi2011rescaling ; newman2014prediction ; radicchi2012testing ; radicchi2012reverse ; crespo2012citation ; kaur2015quality to suppress biases by age and field in the evaluation of academic agents. We find that the rankings produced by the rescaled scores are indeed consistent with the hypothesis that the rankings are not biased by age.
We find that PageRank can compete and even outperform rescaled PageRank in identifying old milestone papers, but completely fails to identify recent milestone papers due to its temporal bias. CiteRank can compete and even outperform rescaled PageRank in identifying recent milestone papers, but markedly underperforms in identifying old milestone papers due to its built-in exponential penalization for older papers. Indicators based on simple citation count are outperformed by rescaled PageRank for papers of every age. This leads us to the conclusion that rescaled PageRank is the best-performing metric overall. With respect to previous works chen2007finding ; dunaiski2012comparing ; fiala2012time ; dunaiski2016evaluating that claimed the superiority of network-based metrics in identifying important papers, our results clarify the essential role of paper age in determining the metrics’ performance: rescaled PageRank excels and PageRank performs poorly in identifying MLs short after their publication, and the performance of the two methods becomes comparable only years after the MLs are published. Qualitatively similar results are found for an alternative list of APS outstanding papers which only includes works that have led to Nobel prize for some of the authors (the list is provided in the Table S1).
Our results indicate that network centrality and time-balance are two essential ingredients – though neglected by popular bibliometric indicators such as the -index for scholars hirsch2005index and impact factor for journals garfield1972citation – for an effective detection of significant papers. This sets a new benchmark for article-level metrics and quantitatively support the paradigm that considering the whole network instead of simple citation count can bring substantial benefits to the ranking of academic agents. In a broader context, our results show that a direct rescaling of PageRank scores is an effective method to solve the PageRank’s well-known bias against recent network nodes. We emphasize that while scientific papers are the focus of this work, the addressed research question is general and can emerge when estimating the importance of any creative work – such as movies spitz2014measuring ; wasserman2015cross – for which quantitative impact metrics and expert-based significance assessments are simultaneously available. The potential broader applications and possible limitations of our results are discussed in the Discussion section.
II Metrics
We consider five article-level metrics: citation count , PageRank score , CiteRank score , rescaled PageRank score , and rescaled citation count .
II.1 Citation count
We denote by the network’s adjacency matrix ( is one if node points to node and zero otherwise). Citation count (referred to as indegree in network science literature newman2010networks ) is one of the simplest metrics to infer node centrality in a network, being simply defined as for a node . Citation count is the building block of the majority of metrics for assessing the impact of single papers, authors, journals (for a review of citation-based impact indicators see ref. waltman2016review ).
II.2 PageRank
The PageRank score vector brin1998anatomy can be defined as the stationary state of a process which combines a random walk along the network links and random teleportation. In a directed monopartite network composed of nodes, the vector of PageRank scores can be found as the stationary solution of the following set of recursive linear equations
| (1) |
where is the outdegree of node , is the teleportation parameter, and is the iteration number. Eq. (1) represents the master equation of a diffusion process on the network, which converges to a unique stationary state independently of the initial condition (see ref. berkhin2005survey for the mathematical details). The PageRank score of node can be interpreted as the average fraction of time spent on node by a random walker who with probability follows the network’s links and with probability teleports to a random node. Throughout this paper, we set which is the usual choice for citation data chen2007finding .
II.3 CiteRank
To correct the PageRank’s strong temporal bias in citation networks, the CiteRank algorithm walker2007ranking introduces ad-hoc penalization for older nodes. The CiteRank score is defined similarly as PageRank; differently from PageRank, in CiteRank equations the teleportation probability decays exponentially with paper age with a certain timescale . According to refs. walker2007ranking ; maslov2008promise , this choice of the teleportation vector is intended to favor the recent nodes and thus lead to a score that better represents papers’ relevance for the current lines of research. Using the same notation as Eq. (1), the vector of CiteRank scores can be found as the stationary solution of the following set of recursive linear equations
| (2) |
where we denote by the publication date of paper and the time at which the scores are computed. Throughout this paper we set and years, which are the parameters chosen in ref. walker2007ranking . The performance of the algorithm for other values of the parameter is discussed in the caption of Fig. 10, in E. We show below that exponential penalization of older nodes is not effective in removing PageRank’s bias, and propose instead a rescaled PageRank score whose average value and standard deviation do not depend on paper age.
| Metric | Properties | |
|---|---|---|
| Citation count | Local metric | |
| PageRank score | Network-based metric | |
| CiteRank | Network-based metric, time-aware | |
| Rescaled PageRank | Network-based metric, time-aware | |
| Rescaled citation count | Local metric, time-aware |
II.4 Rescaled PageRank and rescaled citation count
To compute the rescaled PageRank score for a given paper , we evaluate the paper’s PageRank score as well as the mean and standard deviation of PageRank score for papers published in a similar time as . Time is not measured in days or years, but in number of published papers; after labeling the papers in order of decreasing age, and are computed over papers . The parameter represents the number of papers in the averaging window of each paper111In order to have the same number of papers in each averaging window, a different definition of averaging window is needed for the oldest and the most recent papers, for which we compute and over the papers and , respectively.. The rescaled score of paper is then computed as
| (3) |
Values of larger or smaller than zero indicate whether the paper is out- or under-performing, respectively, with respect to papers of similar age. represents the -score kreyszig2010advanced of paper within its averaging window. For the sake of completeness, we have also tested a simpler rescaled score in the form ; however, fails to produce a time-balanced ranking due to the fact that strongly depends on paper age (see C for details). In addition, we tested a rescaled score based on Eq. (3) where and are computed over the papers published in the same year as paper . We found that while is able to suppress large part of PageRank’s temporal bias, its ranking is much less in agreement with the hypothesis of unbiased ranking than the ranking by (see C for details). For this reason, we use an averaging window based on number of publications and not on real time. This choice is also supported by the findings of refs. newman2009first and parolo2015attention which suggest that the role of time in citation networks is better captured by the number of published papers than by real time.
We define the rescaled citation count analogously as
| (4) |
where and represent the mean and the standard deviation of computed over papers . Citation count rescaling was used in refs. newman2009first ; newman2014prediction to identify papers that accrue more citations than expected for papers of similar age under the hypothesis of pure preferential attachment.
The choice of the size of the temporal window deserves some attention: if the size of the temporal window is too large, one would fall again in a time-biased ranking that is one of the issues that motivate the present paper. On the other hand, if we choose a too small averaging window, the papers would be only compared with few other papers and the resulting scores would be too volatile. Throughout this paper, we set ; we refer to D for further details on the dependence of ranking properties on the averaging window size. We stress that the rankings by and are only weakly dependent on and (see Fig. 9), and the correlation between the rankings by obtained with different values of PageRank’s teleportation parameter is close to one (Spearman’s rank correlation coefficient between the rankings obtained with and is equal to ). These results indicate that the proposed rescaling metrics are robust with respect to variations of their parameters.
III Results
We analyzed the network composed of citations among papers published in APS journals (). The dataset was directly provided by the APS following our request at the webpage http://journals.aps.org/datasets, and was also studied in ref. medo2011temporal , among others.
III.1 Time balance of the rankings
Before comparing the performances of the five metrics in recognizing the Milestone Letters (MLs), we want to determine whether the metrics are biased by age and, if yes, then to which extent. In agreement with refs. radicchi2008universality ; radicchi2011rescaling , we assume that a fair ranking of scientific papers should be time-balanced in the sense that old and recent papers should be equally likely to appear at the top of the ranking by the metric. Caveats and possible weak points of this assumption are examined in the Discussion section.
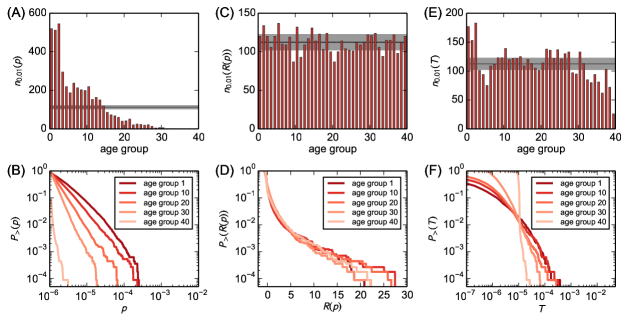
To assess the degree of time balance of the five metrics, we perform a statistical test similar to those proposed in refs. radicchi2011rescaling ; radicchi2012testing . We divide the papers into different groups according to their age and, for each metric, we compute the number of top- papers by the metric for each age group , and quantitatively compare the resulting histogram with the expected histogram under the hypothesis that the ranking is temporally unbiased. We set ; results for other small values of are qualitatively similar.
Fig. 1A shows that the observed values of for PageRank are far from their expected values under the hypothesis of unbiased ranking. For instance, for the age group that contains the oldest papers, as opposed to for the age group composed of the most recent papers. To quantify the degree of time balance of a metric, we compare the standard deviation of the observed histogram with the expected standard deviation under the hypothesis of unbiased ranking. For a perfectly unbiased ranking, the number of nodes from age group in the top- by the ranking obeys the multivariate hypergeometric distribution radicchi2012testing . Therefore, we expect on average top- papers for each set, with the standard deviation
| (5) |
The observed standard deviation is computed as
| (6) |
The ratio between observed and expected standard deviation quantifies the degree of time balance of the ranking – we expect this ratio to be close to or lower than (due to fluctuations) one for an unbiased ranking, and significantly larger than one for a ranking biased by age. To quantify to which extent the observed values of are consistent with the hypothesis of unbiased ranking, we run a simulation where papers are randomly assigned to one among groups, and compute the standard deviation of the observed deviation according to Eq. (6). With realizations, we obtain . We always express the observed values of as multiples of in the following.
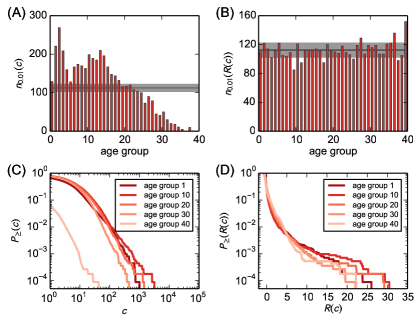
We obtain for PageRank, which indicates that the ranking is heavily biased. The heavy bias of PageRank score is also revealed by a comparison of its distribution for nodes from different age groups, which shows a clear advantage for old nodes (Fig. 1B). Fig. 1C shows that the ranking by the score is in good agreement with the hypothesis that the ranking is unbiased; we find . The time balance of rescaled PageRank score manifests itself in the collapse of the distributions of the score for different age groups on a unique curve, which means that the score allows us to compare papers of any age on the same scale (Fig. 1D). In a similar way, the rescaling procedure suppresses the temporal bias of citation count [ for as compared to for , see Fig. 2]. We observe a qualitatively similar suppression of time bias for different choices of the number of age groups (not shown here).
With respect to the histogram obtained with , the histogram obtained with the CiteRank algorithm (with the parameters chosen in ref. maslov2008promise ) presents much larger deviation from the histogram expected under the hypothesis of time-balanced ranking (see Fig. 1E). As a result, the value of obtained for CiteRank ( with the parameters chosen in ref. walker2007ranking ) is larger than the value obtained for . The distributions of CiteRank score for different age groups do not collapse on a single curve (see Fig. 1F), which is directly due to the built-in exponential decay of the teleportation term. The failure of CiteRank in producing a time-balanced ranking is well exemplified by the behavior of the score distribution for the most recent age group, whose minimum score (i.e., the smallest score value such that deviates from one) is much larger than for the other distributions, due to a larger teleportation term. These findings show that CiteRank score does not allow us to fairly compare papers of different age.
The values of for the five metrics are summarized in Table 1.
| Rank () | Rank () | Title | Year | Journal | ||||||||
|---|---|---|---|---|---|---|---|---|---|---|---|---|
| \endhead | Self-consistent equations including exchange and correlation effects (W. Kohn, L. Sham) | 1965 | Phys. Rev. | |||||||||
| Theory of superconductivity (J. Bardeen, L. Cooper, J. Schrieffer) | 1957 | Phys. Rev. | ||||||||||
| Inhomogeneous electron gas (P. Hohenberg) | 1964 | Phys. Rev. | ||||||||||
| Stochastic problems in physics and astronomy (S. Chandrasekhar) | 1943 | Rev. Mod. Phys. | ||||||||||
| The theory of complex spectra (J. Slater) | 1929 | Phys. Rev. | ||||||||||
| ∗A model of leptons (S. Weinberg) | 1967 | Phys. Rev. Lett. | ||||||||||
| Can quantum-mechanical description of physical reality be considered complete? (A. Einstein, B. Podolsky, N. Rosen) | 1935 | Phys. Rev. | ||||||||||
| Crystal statistics. i. A two-dimensional model with an order-disorder transition (L. Onsager) | 1944 | Phys. Rev. | ||||||||||
| Self-interaction correction to density-functional approximations for many-electron systems (J. Perdew) | 1981 | Phys. Rev. B | ||||||||||
| Absence of diffusion in certain random lattices (P. Anderson) | 1958 | Phys. Rev. | ||||||||||
| Scaling theory of localization: absence of quantum diffusion in two dimensions (E. Abrahams) | 1979 | Phys. Rev. Lett. | ||||||||||
| Effects of configuration interaction on intensities and phase shifts (U. Fano) | 1961 | Phys. Rev. | ||||||||||
| On the constitution of metallic sodium (E. Wigner, F. Seitz) | 1933 | Phys. Rev. | ||||||||||
| On the interaction of electrons in metals (E. Wigner) | 1934 | Phys. Rev. | ||||||||||
| Cohesion in monovalent metals (J. Slater) | 1930 | Phys. Rev. | ||||||||||
| Rank () | Rank () | Title | Year | Journal | ||||||||
|---|---|---|---|---|---|---|---|---|---|---|---|---|
| \endhead | Self-consistent equations including exchange and correlation effects (W. Kohn, L. Sham) | 1965 | Phys. Rev. | |||||||||
| ∗Bose-einstein condensation in a gas of sodium atoms (K. Davis et al.) | 1995 | Phys. Rev. Lett. | ||||||||||
| Self-organized criticality: an explanation of the 1/f noise (P. Bak, C. Tang, K. Wiesenfeld) | 1987 | Phys. Rev. Lett. | ||||||||||
| ∗Large mass hierarchy from a small extra dimension (L. Randall) | 1999 | Phys. Rev. Lett. | ||||||||||
| Pattern formation outside of equilibrium (M. Cross) | 1993 | Rev. Mod. Phys. | ||||||||||
| Statistical mechanics of complex networks (R. Albert, A.-L. Barabási) | 2002 | Rev. Mod. Phys. | ||||||||||
| Review of particle properties (K. Hagiwara et al) | 2002 | Phys. Rev. D | ||||||||||
| Inhomogeneous electron gas (P. Hohenberg) | 1964 | Phys. Rev. | ||||||||||
| Evidence of Bose-Einstein condensation in an atomic gas with attractive interactions (C. Bradley et al.) | 1995 | Phys. Rev. Lett. | ||||||||||
| Efficient pseudopotentials for plane-wave calculations (N. Troullier, J. Martins) | 1991 | Phys. Rev. B | ||||||||||
| ∗Teleporting an unknown quantum state via dual classical and Einstein-Podolsky-Rosen channels (C. Bennett et al.) | 1993 | Phys. Rev. Lett. | ||||||||||
| ∗Negative refraction makes a perfect lens (J. Pendry) | 2000 | Phys. Rev. Lett. | ||||||||||
| Tev scale superstring and extra dimensions (G. Shiu, S.-H. Tye) | 1998 | Phys. Rev. D | ||||||||||
| Diffusion-limited aggregation, a kinetic critical phenomenon (T. Witten) | 1981 | Phys. Rev. Lett. | ||||||||||
| Self-interaction correction to density-functional approximations for many-electron systems (J. Perdew, A. Zunger) | 1981 | Phys. Rev. B | ||||||||||
III.2 Identification of the Milestone Letters
In the previous section, we have shown that the rankings by the rescaled metrics and are consistent with the hypothesis that the ranking is not biased by paper age. While different works have recently emphasized the importance of removing the bias by age of citation-performance metrics for a fair ranking of scientific publications radicchi2008universality ; radicchi2011rescaling and researchers kaur2013universality , the possible positive effects of time-balanced rankings with respect to biased rankings remain largely unexplored.
Ref. chen2007finding analyzed the APS dataset and found that PageRank is able to recognize old papers that are universally important for physics. They also noted that PageRank is based on a diffusion process that drifts towards old papers (see ref. mariani2015ranking for a general analysis of this aspect) and, as a consequence, it inevitably favors old papers. Since the rescaling procedure that we propose solves this issue, it is thus plausible to conjecture that with respect to the PageRank algorithm, rescaled PageRank allows us to identify seminal papers earlier.
In this section, we use the APS dataset and the list of Milestone Letters (MLs) chosen by editors of Physical Review Letters (see Supplementary Table S1 for the list of MLs. Supplementary material for this manuscript is available at http://www.sciencedirect.com/science/article/pii/S1751157716301729). to address the two following research questions:
-
1.
Is there a significant gap between the performance of rescaled PageRank and PageRank in identifying the MLs short after publication? If there is a substantial gap, does it close down after a certain number of years after publication?
-
2.
Do network-based indicators outperform indicators based on simple citation count in recognizing the MLs?
To compare the ranking positions of the MLs by the five different metrics, the ranking of Milestone Letter is computed years after its publication. We calculate the ratio of ’s ranking position by metric and ’s best ranking position among all considered metrics. To characterize the overall performance of metric in ranking the MLs, we average the ranking ratio over and obtain (see F for computation details). The resulting quantity is referred to as the average ranking ratio of metric for the Milestone Letters years after their publication. A good metric is expected to have as low as possible – the minimum value is only achieved by a metric that always outperforms the others in ranking the milestone papers of age . Note that the average ranking ratio reduces to average ranking position if we do not normalize the ranking position by . However, the average ranking position of the target papers by a certain metric is extremely sensitive to the ranking positions of the least-cited target papers, as opposed to the robustness of the average ranking ratio with respect to removal of the least-cited papers from the set of target papers (see A for details). This property motivates the use of ranking ratio to compare the ranking positions of the MLs by the different metrics.
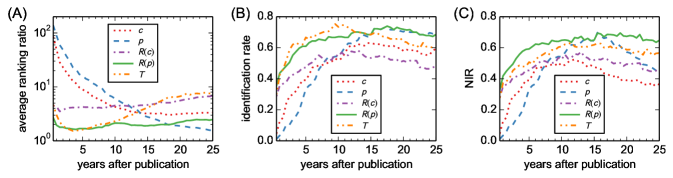
The dependence of on paper age measured in years after publication is shown in Fig. 3A. Due to the suppression of time bias, rescaled PageRank score has a large advantage with respect to the original PageRank score for papers of small age. Since the PageRank algorithm is biased towards old nodes, the performance gap between and gradually decreases with age and vanishes years after publication. By contrast, the CiteRank algorithm exponentially penalizes older nodes and, as a consequence, the performance gap between and is minimal for recent papers, and CiteRank score can even outperform during the first six years after publication. When paper age becomes sufficiently larger than CiteRank’s temporal timescale ( years here, as chosen in refs. walker2007ranking ; maslov2008promise ), older papers are strongly penalized by the CiteRank’s teleportation term and, as a result, CiteRank is markedly outperformed by rescaled PageRank. The same behavior is observed also for other values of CiteRank time-decay parameter (see E). The local metrics and are outperformed by in ranking the MLs of every age, which indicates that network centrality brings a substantial advantage in ranking highly significant papers with respect to simple and rescaled citation count.
While the average ranking ratio takes into account all the MLs, it is also interesting to measure the age-dependence of the identification rates of the metrics, defined as the fraction of MLs that were ranked among the top papers by the metric when they were years old 222The identification rate is related to recall, a standard measure in the literature of recommendation systems lu2012recommender . (see Fig. 3B). Rescaled PageRank and CiteRank score markedly outperform the other metrics in identifying the milestone papers in the first years after publication. The performance gap between and the citation-based indicators and remains significant during the whole observation lapse. Analogously to what we observed for the average ranking ratio, the performance gap between and gradually decreases with paper age and vanishes years after publication, which is similar to the crossing point at years after publication observed for the average ranking ratio. CiteRank has a small advantage with respect to rescaled PageRank in the first years after publication, whereas for older papers CiteRank’s identification rate drops to the value achieved by simple citation count .
It is worth to observe that the temporal bias of a certain metric affects the behavior of both and for that metric: as we observe in B, a metric biased towards old (like PageRank) or recent papers naturally performs better in identifying old or recent MLs, respectively. One natural way to understand this effect is to consider a normalized identification rate (hereafter abbreviated as NIR), such that the contribution of each identified ML of age (i.e., a ML ranked in the top of the ranking) to is smaller than one if the metric favors papers that belong to the same age group as paper (see F for the mathematical definition). In other words, when evaluating the performance of a given metric, the normalized identification rate takes into account both the temporal balance and the identification power of the metric. The behavior of for the five metrics is shown in Fig. 3C. After an initial increasing trend for all the metrics, the normalized identification rate of both and decline due to their temporal bias; by contrast, the same quantity remains relatively stable for both and . According to , rescaled PageRank outperforms CiteRank for papers of every age. This is due to the fact that the ranking by CiteRank is not unbiased and, as a consequence, CiteRank’s performance is often penalized by the NIR for small age due to the algorithm’s bias towards recent nodes.
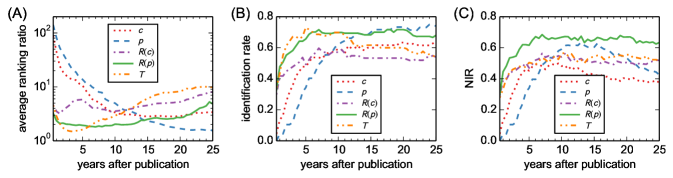
Our analysis assumes that a ML should be ranked as high as possible by a good metric for scientific significance. On the other hand, many outstanding contributions to physics are not included in the list of MLs. To show that our results also hold for an alternative choice of groundbreaking papers, we consider a list of APS papers that led to Nobel Prize for some of the authors (see Supplementary Table S1 for the list of papers). The results for this list of benchmark papers are shown in Fig. 4 and are qualitatively similar to those shown in Fig. 3, which indicates that our findings are robust with respect to modifications of the benchmark papers’ list.
While Fig. 3 concerns the metrics’ performance averaged over the whole set of MLs, the Supplementary Movie available at our webpage [http://www.ddp.fmph.uniba.sk/~medo/physics/RPR/] shows the simultaneous dynamics of the ranking positions by and of all individual MLs for the first years after publication333Accordingly, only the MLs that are at least years old at the end of the dataset are included in the movie.. The movie shows that rescaled score has a clear advantage with respect to PageRank score in the first years after publication for most of the MLs. As the MLs become sufficiently old, their position in the plane gradually tends to converge to the diagonal where the ranking position by is equal to the ranking position by , which is in agreement with the crossing between PageRank’s and rescaled PageRank’s performance curves observed in Figs. 3A-3B.
In principle, one might consider a comparison of the final ranking positions (i.e., the ranking positions computed on the whole dataset) of the target papers by a certain metric dunaiski2012comparing ; dunaiski2016evaluating instead of the age-dependent evaluation of the metrics introduced above. But this kind of comparison would miss our key point – the strong dependence of metrics’ performance on paper age. In addition, the strong dependence of metrics’ performance on paper age shown in this section makes the outcome of such evaluation strongly dependent on the age distribution of the target papers we aim to identify. This issue is discussed in B and potentially concerns any performance evaluation carried out on a fixed snapshot of the network. By contrast, the outcomes presented in this paragraph (how well do the different metrics perform as a function of paper age) are little sensitive to the exact age distribution of the target papers.
III.3 Top papers by PageRank and rescaled PageRank
To get an intuitive understanding of the properties of PageRank and its rescaled version, it is instructive to look at the top- papers according to and computed on the whole dataset, reported in Table II and Table III, respectively. Although only one ML appears in the top by (ranked th, see Table II), among the non-MLs there are papers of exceptional significance, such as the letter that proposed the popular Einstein-Podolsky-Rosen experiment (ranked th); the paper that introduced a fundamental tool in many-body systems, Slater’s determinant (ranked th); the paper that presented the famous exact solution of the two-dimensional Ising model (ranked th). This confirms that PageRank is highly effective in finding relatively old papers of outstanding significance – referred to as “scientific gems” in ref. chen2007finding – which has led to the interpretation of PageRank score as a “lifetime achievement award“ for a paper maslov2008promise . Nevertheless, the most recent paper in Table II is from – years old with respect to the dataset’s ending point in .
In the top- by , we find both old papers (the oldest is from , years old in ) and recent papers (the most recent is from , years old in ). Four out of top-papers are MLs, which is an additional confirmation of the quality of the ranking by . We emphasize that while both PageRank and rescaled PageRank feature prominent papers in their top-, the detailed performance analysis described in the previous section is essential in order to fully understand the behavior of the two metrics.
IV Discussion
Motivated by the recent publication of the list of Milestone Letters by the Physical Review Letters editors, we performed an extensive cross-evaluation of different data-driven metrics of scientific impact of research papers with respect to their ability to identify papers of exceptional significance. We studied the network of citations between papers in the Physical Review corpus, which is recognized to be a comprehensive proxy for scientific research in physics redner2005citation ; radicchi2009diffusion ; radicchi2011rescaling . The main assumption of our analysis is that although not all the most important papers in the Physical Review corpus are covered by the Milestone Letters list, a good paper-level metric is expected to rank the Milestone Letters as high as possible due to their outstanding significance. We find a clear performance gap between network-based metrics () and local metrics based only on the number of received citations (). This finding suggests that the use of citation counts to rank scientific papers is sub-optimal; additional research will be needed to assess whether network-based article-level metrics can be used to construct author-level metrics more effective than the currently used metrics – such as the popular -index hirsch2005index – that are only based on citation counts and neglect network centrality.
We have shown that the proposed rescaled PageRank suppresses PageRank’s well-known bias against recent papers much better than the CiteRank algorithm does. As a result, the proposed rescaled PageRank provides a superior performance than PageRank and CiteRank in ranking recent and old milestone papers, respectively. There are still two possible ranking errors—false positives and false negatives—that have not been addressed in this manuscript. Young papers at the top of the ranking by the rescaled PageRank may be false positives because the citation spurt that they have experienced may stop which will eventually force them out of the ranking’s top as well as out from the group of possibly highly significant papers. By contrast, the so-called ”sleeping beauties“ that receive a large part of citations long after they are published ke2015defining are likely to be under-evaluated by the rescaled PageRank. Assessing the extent to which false positives and false negatives affect the ranking by rescaled PageRank, and by other relevant metrics as well, goes beyond the scope of our paper yet it constitutes a much needed step in future research. The analysis of larger datasets which include papers from diverse fields is another natural next step for future research. As different academic disciplines adopt different citation practices bornmann2008citation , the rescaling procedure proposed in this paper may need to be extended to also remove possible ranking biases by academic field.
The assumptions behind our definition of time balance and the computation of the rescaled scores deserve attention as well. In agreement with refs. radicchi2008universality ; radicchi2011rescaling , the definition of time balance of a ranking adopted in this article requires that the likelihood that a paper is ranked at the top by a time-balanced metric is independent of paper age. Our definition of ranking time balance is implicitly based on the assumption that the number of highly significant papers grows linearly with system size. While this assumption seems reasonable for the Physical Review corpus whose journals apply strict acceptance criteria for submitted papers, it might need to be reconsidered when analyzing larger datasets which include recently emerging high-acceptance journals (both mega-journals bjork2015have and predatory journals xia2015publishes ). In other words, the exponential growth of the number of published papers redner2005citation ; wang2013quantifying ; sinatra2015century does not necessarily correspond to an exponential growth of the number of highly significant papers. The issue is delicate (see ref. sarewitz2016pressure for a recent insight) and will need to be addressed in future research on bibliometric indicators.
An important general question remains open: which inherent properties of a network determine if PageRank-like methods will outperform local metrics or not? We conjecture that in citation networks, the observed success of network-based metrics in identifying highly significant papers might be related to the tendency of high-impact papers to cite other high-impact papers bornmann2010scientific . Despite recent efforts mariani2015ranking ; medo2015identification ; ghoshal2011ranking ; fortunato2008approximating , which network properties make the PageRank algorithm succeed or fail remains a largely unexplored problem which we will further investigate in future research.
Our work constitutes a particular instance of a general methodology – the comparison of the outcomes of quantitative variables with a ground-truth established by experts – which can be applied for metric evaluation in several kinds of systems, such as movies spitz2014measuring ; wasserman2015cross or the network of scientific authors radicchi2009diffusion . In the domain of research evaluation, this methodology is particularly relevant since bibliometric indices are increasingly used in practice – often uncritically and in questionable ways wilsdon2015we ; hicks2015bibliometrics – and scholars from diverse field have produced a plethora of possible impact metrics van2010metrics , especially those aimed at assessing researchers’ productivity and impact. Motivated by the results obtained in this article, we encourage the creation of lists of groundbreaking papers also for other scientific domains, which can lead to a richer understanding and more accurate benchmarking of quantitative metrics for scientific significance. Our findings constitute a benchmark for article-level metrics of scientific significance, and can be used as a baseline to assess the performance of new indicators in future research.
From a practical point of view, improving the effectiveness of paper impact metrics has the potential to improve not only the current bibliometric practices, but also our ability to discover relevant papers in online platforms that collect academic papers and use automated methods to sort them. In this respect, our findings suggest that rescaled PageRank can be used as an operational tool to identify the most significant papers on a given topic. Suppose that a researcher enters a new research field and wants to study the most important works in that field. If we provide him/her with the top papers as ranked by PageRank, the researcher will only know the oldest papers and will not be informed about recent lines of research. On the other hand, by providing him/her with the top papers as ranked by rescaled PageRank, he/she will know both old significant papers and recent works that have attracted considerable attention, leading to a more complete overview of the field. To allow researchers to experience the benefits of a time-balanced ranking method, we developed an interactive Web platform which is available at the address http://www.sciencenow.info. In this platform, users can browse the rankings of the APS papers by year by year, investigate the historical evolution of each paper’s ranking position by , and check the ranking positions and the scores of each researcher’s publications.
V Conclusions
We presented a detailed analysis of the performance of different quantitative metrics with respect to their ability to identify the Milestone Letters selected by the Physical Review Letters editors. Our findings indicate that: (1) a direct rescaling of citation count and PageRank score is an effective way to suppress the temporal bias of these two metrics; (2) rescaled PageRank is the best-performing metric overall, as it outperforms PageRank and CiteRank in identifying recent and old milestone papers, respectively, and it outperform citation-based indicators for papers of every age. The presented results indicate that the combination of network centrality and time holds promise for improving some of the tools currently used to rank scientific publications, which could bring valuable benefits for quantitative research assessment and design of Web academic platforms.
Acknowledgements
We wish to thank Giulio Cimini, Matthieu Cristelli, Luciano Pietronero, Zhuo-Ming Ren, Andrea Tacchella, Giacomo Vaccario, Alexandre Vidmer and Andrea Zaccaria for inspiring discussions and useful suggestions. This work was supported by the EU FET-Open Grant No. 611272 (project Growthcom). The authors declare that they have no competing financial interests. Correspondence and requests for materials should be addressed to M. S. Mariani (email: manuel.mariani@unifr.ch).
References
- (1) F. Narin, et al., Evaluative bibliometrics: The use of publication and citation analysis in the evaluation of scientific activity, Computer Horizons Washington, D. C, 1976.
- (2) F. Radicchi, S. Fortunato, C. Castellano, Universality of citation distributions: Toward an objective measure of scientific impact, Proceedings of the National Academy of Sciences 105 (45) (2008) 17268–17272.
- (3) J. E. Hirsch, An index to quantify an individual’s scientific research output, Proceedings of the National academy of Sciences of the United States of America 102 (46) (2005) 16569–16572.
- (4) L. Egghe, Theory and practise of the g-index, Scientometrics 69 (1) (2006) 131–152.
- (5) G. Pinski, F. Narin, Citation influence for journal aggregates of scientific publications: Theory, with application to the literature of physics, Information Processing & Management 12 (5) (1976) 297–312.
- (6) S. J. Liebowitz, J. P. Palmer, Assessing the relative impacts of economics journals, Journal of Economic Literature 22 (1) (1984) 77–88.
- (7) J. Bollen, M. A. Rodriquez, H. Van de Sompel, Journal status, Scientometrics 69 (3) (2006) 669–687.
- (8) A. Kinney, National scientific facilities and their science impact on nonbiomedical research, Proceedings of the National Academy of Sciences 104 (46) (2007) 17943–17947.
- (9) J.-F. Molinari, A. Molinari, A new methodology for ranking scientific institutions, Scientometrics 75 (1) (2008) 163–174.
- (10) D. A. King, The scientific impact of nations, Nature 430 (6997) (2004) 311–316.
- (11) G. Cimini, A. Gabrielli, F. S. Labini, The scientific competitiveness of nations, PLoS One 9 (12) (2014) e113470.
- (12) R. Van Noorden, Metrics: A profusion of measures., Nature 465 (7300) (2010) 864–866.
- (13) A. F. Van Raan, Fatal attraction: Conceptual and methodological problems in the ranking of universities by bibliometric methods, Scientometrics 62 (1) (2005) 133–143.
- (14) P. Weingart, Impact of bibliometrics upon the science system: Inadvertent consequences?, Scientometrics 62 (1) (2005) 117–131.
- (15) P. Lawrence, Lost in publication: how measurement harms science, Ethics in Science and Environmental Politics 8 (2008) 9–11.
- (16) D. Hicks, P. Wouters, L. Waltman, S. de Rijcke, I. Rafols, Bibliometrics: The leiden manifesto for research metrics, Nature 520 (2015) 429–431.
- (17) R. Werner, The focus on bibliometrics makes papers less useful., Nature 517 (7534) (2015) 245.
- (18) M. Dunaiski, W. Visser, Comparing paper ranking algorithms, in: Proceedings of the South African Institute for Computer Scientists and Information Technologists Conference, ACM, 2012, pp. 21–30.
- (19) L. Yao, T. Wei, A. Zeng, Y. Fan, Z. Di, Ranking scientific publications: the effect of nonlinearity, Scientific Reports 4 (2014) 6663.
- (20) J. Zhou, A. Zeng, Y. Fan, Z. Di, Ranking scientific publications with similarity-preferential mechanism, Scientometrics (2015) 1–12.
- (21) M. Dunaiski, W. Visser, J. Geldenhuys, Evaluating paper and author ranking algorithms using impact and contribution awards, Journal of Informetrics 10 (2) (2016) 392–407.
- (22) M. Wasserman, X. H. T. Zeng, L. A. N. Amaral, Cross-evaluation of metrics to estimate the significance of creative works, Proceedings of the National Academy of Sciences 112 (5) (2015) 1281–1286.
- (23) S. Brin, L. Page, The anatomy of a large-scale hypertextual web search engine, Computer Networks and ISDN Systems 30 (1) (1998) 107–117.
- (24) D. Walker, H. Xie, K.-K. Yan, S. Maslov, Ranking scientific publications using a model of network traffic, Journal of Statistical Mechanics: Theory and Experiment 2007 (06) (2007) P06010.
- (25) M. Newman, The first-mover advantage in scientific publication, Europhys. Lett. 86 (6) (2009) 68001.
- (26) M. Franceschet, Pagerank: Standing on the shoulders of giants, Communications of the ACM 54 (6) (2011) 92–101.
- (27) D. F. Gleich, Pagerank beyond the web, SIAM Rev. 57 (3) (2015) 321––363.
- (28) L. Ermann, K. M. Frahm, D. L. Shepelyansky, Google matrix analysis of directed networks, Reviews of Modern Physics 87 (4) (2015) 1261.
- (29) P. Chen, H. Xie, S. Maslov, S. Redner, Finding scientific gems with google’s pagerank algorithm, Journal of Informetrics 1 (1) (2007) 8–15.
- (30) B. González-Pereira, V. P. Guerrero-Bote, F. Moya-Anegón, A new approach to the metric of journals’ scientific prestige: The sjr indicator, Journal of Informetrics 4 (3) (2010) 379–391.
- (31) F. Radicchi, S. Fortunato, B. Markines, A. Vespignani, Diffusion of scientific credits and the ranking of scientists, Physical Review E 80 (5) (2009) 056103.
- (32) E. Yan, Y. Ding, Applying centrality measures to impact analysis: A coauthorship network analysis, Journal of the American Society for Information Science and Technology 60 (10) (2009) 2107–2118.
- (33) M. Nykl, K. Ježek, D. Fiala, M. Dostal, Pagerank variants in the evaluation of citation networks, Journal of Informetrics 8 (3) (2014) 683–692.
- (34) L. Waltman, E. Yan, Pagerank-related methods for analyzing citation networks, in: Measuring scholarly impact, Springer, 2014, pp. 83–100.
- (35) M. S. Mariani, M. Medo, Y.-C. Zhang, Ranking nodes in growing networks: When pagerank fails, Scientific Reports 5.
- (36) F. Radicchi, C. Castellano, Rescaling citations of publications in physics, Physical Review E 83 (4) (2011) 046116.
- (37) M. Newman, Prediction of highly cited papers, Europhys. Lett. 105 (2) (2014) 28002.
- (38) F. Radicchi, C. Castellano, Testing the fairness of citation indicators for comparison across scientific domains: The case of fractional citation counts, Journal of Informetrics 6 (1) (2012) 121–130.
- (39) F. Radicchi, C. Castellano, A reverse engineering approach to the suppression of citation biases reveals universal properties of citation distributions, PLoS One 7 (3) (2012) e33833.
- (40) J. A. Crespo, I. Ortuño-Ortín, J. Ruiz-Castillo, The citation merit of scientific publications, PloS one 7 (11) (2012) e49156.
- (41) J. Kaur, E. Ferrara, F. Menczer, A. Flammini, F. Radicchi, Quality versus quantity in scientific impact, Journal of Informetrics 9 (4) (2015) 800–808.
- (42) D. Fiala, Time-aware pagerank for bibliographic networks, Journal of Informetrics 6 (3) (2012) 370–388.
- (43) E. Garfield, Citation analysis as a tool in journal evaluation, Science 178 (4060) (1972) 471–479.
- (44) A. Spitz, E.-Á. Horvát, Measuring long-term impact based on network centrality: Unraveling cinematic citations, PLoS One 9 (10) (2014) e108857.
- (45) M. Newman, Networks: an introduction, Oxford University Press, 2010.
- (46) L. Waltman, A review of the literature on citation impact indicators, Journal of Informetrics 10 (2) (2016) 365–391.
- (47) P. Berkhin, A survey on pagerank computing, Internet Mathematics 2 (1) (2005) 73–120.
- (48) S. Maslov, S. Redner, Promise and pitfalls of extending google’s pagerank algorithm to citation networks, The Journal of Neuroscience 28 (44) (2008) 11103–11105.
- (49) In order to have the same number of papers in each averaging window, a different definition of averaging window is needed for the oldest and the most recent papers, for which we compute and over the papers and , respectively.
- (50) E. Kreyszig, Advanced engineering mathematics, John Wiley & Sons, 2010.
- (51) P. D. B. Parolo, R. K. Pan, R. Ghosh, B. A. Huberman, K. Kaski, S. Fortunato, Attention decay in science, Journal of Informetrics 9 (4) (2015) 734–745.
- (52) M. Medo, G. Cimini, S. Gualdi, Temporal effects in the growth of networks, Physical Review Letters 107 (23) (2011) 238701.
- (53) J. Kaur, F. Radicchi, F. Menczer, Universality of scholarly impact metrics, Journal of Informetrics 7 (4) (2013) 924–932.
- (54) The identification rate is related to recall, a standard measure in the literature of recommendation systems lu2012recommender .
- (55) Accordingly, only the MLs that are at least years old at the end of the dataset are included in the movie.
- (56) S. Redner, Citation statistics from 110 years of physical review, Physics Today 58 (2005) 49.
- (57) Q. Ke, E. Ferrara, F. Radicchi, A. Flammini, Defining and identifying sleeping beauties in science, Proceedings of the National Academy of Sciences 112 (24) (2015) 7426–7431.
- (58) L. Bornmann, H.-D. Daniel, What do citation counts measure? a review of studies on citing behavior, Journal of Documentation 64 (1) (2008) 45–80.
- (59) B.-C. Björk, Have the “mega-journals” reached the limits to growth?, PeerJ 3 (2015) e981.
- (60) J. Xia, J. L. Harmon, K. G. Connolly, R. M. Donnelly, M. R. Anderson, H. A. Howard, Who publishes in “predatory” journals?, Journal of the Association for Information Science and Technology 66 (7) (2015) 1406–1417.
- (61) D. Wang, C. Song, A.-L. Barabási, Quantifying long-term scientific impact, Science 342 (6154) (2013) 127–132.
- (62) R. Sinatra, P. Deville, M. Szell, D. Wang, A.-L. Barabási, A century of physics, Nature Physics 11 (10) (2015) 791–796.
- (63) D. Sarewitz, The pressure to publish pushes down quality, Nature 533 (7602) (2016) 147–147.
- (64) L. Bornmann, F. de Moya Anegón, L. Leydesdorff, Do scientific advancements lean on the shoulders of giants? a bibliometric investigation of the ortega hypothesis, PLoS One 5 (10) (2010) e13327.
- (65) M. Medo, M. S. Mariani, A. Zeng, Y.-C. Zhang, Identification and modeling of discoverers in online social systems, arXiv preprint arXiv:1509.01477.
- (66) G. Ghoshal, A.-L. Barabási, Ranking stability and super-stable nodes in complex networks, Nature Communications 2 (2011) 394.
- (67) S. Fortunato, M. Boguñá, A. Flammini, F. Menczer, Approximating pagerank from in-degree, in: Algorithms and Models for the Web-Graph, Springer, 2008, pp. 59–71.
- (68) J. Wilsdon, We need a measured approach to metrics., Nature 523 (7559) (2015) 129–129.
- (69) L. Lü, M. Medo, C. H. Yeung, Y.-C. Zhang, Z.-K. Zhang, T. Zhou, Recommender systems, Physics Reports 519 (1) (2012) 1–49.
- (70) Note that the ranking by is perfectly correlated with the ranking by for .
Appendix A Average ranking position vs. average ranking ratio
We show here that the average ranking position of the MLs is extremely sensitive to the ranking position of the least-cited MLs, whereas the average ranking ratio is stable with respect to removal of the least-cited MLs. For simplicity, in this Appendix we consider the rankings computed on the whole dataset. In formulas, the average ranking position of the MLs by metric is defined as
| (7) |
where denotes the ranking position of paper by metric normalized by the total number of papers: and correspond to the best and the worst paper in the ranking, respectively.
In section III.2, we mention that little-cited papers can bias the average ranking position of the target papers by a certain metric. To illustrate this point, consider first the following ideal example. Consider two target papers and . Paper is ranked th by metric and th by metric , whereas paper is ranked by metric and by metric . The average ranking position for the set of papers is equal to and to for metric and , respectively. This means that according to average ranking position, metric outperforms metric , despite having not been able to place any of the two papers in the top-.
A qualitatively similar situation occurs also in the APS dataset, as the following example shows. The milestone letter ”Element No. 102“ [Phys. Rev. Lett. 1.1 (1958): 18] is cited only five times within the APS data. Its ranking position by () is thus much larger than the MLs’ average ranking position by . Only few MLs are little cited – for instance, only four out of MLs are not among the top- papers by citation count. To which extent do these little-cited papers affect for the different metrics? By denoting with the average computed on the subset of MLs which does not include the four least-cited MLs, we obtain , which is smaller than by a factor around . The effect is even larger for citation count: we have against the original value – the ratio between the two averages is larger than two.
By using the average ranking ratio, we only compare the ranking within the chosen set of metrics for each individual paper and, as a consequence, the average is stable with respect to removal of the least-cited MLs. This can be illustrated by again excluding the four least-cited MLs from the computation of , and by comparing the corresponding values of the average ranking ratio with the values computed over all the MLs. Among the five metrics, the largest variation is observed for PageRank, for which – i.e., the removal of the least-cited MLs has only a small effect on the average ranking ratios for the five metrics.
Appendix B Assessing the metrics’ performance on the whole dataset
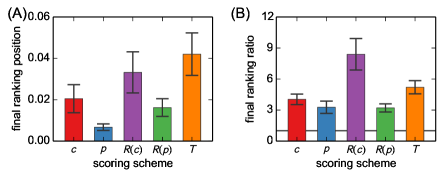
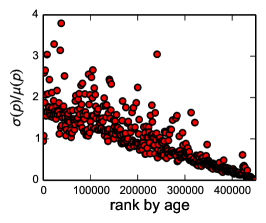
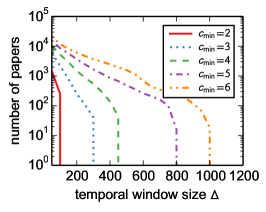
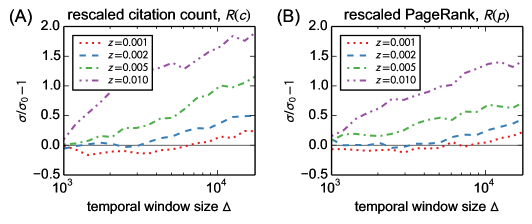
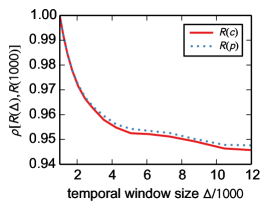
Fig. 5A shows the values of the average ranking position for the five metrics computed on the whole dataset: according to , PageRank and rescaled PageRank outperform the other metrics.
While the average ranking position of the MLs is a simple quantity to evaluate the metrics, some MLs are relatively little cited and, as a result, their low ranking position can strongly bias the average ranking position. We refer to A for a detailed discussion of this issue. To solve this problem, we defined the ranking ratio in the main text. Fig. 5B shows the measured values of the average ranking ratio based on the rankings computed on the whole dataset. This simple measure would suggest that and, to a lesser extent, and outperform and CiteRank. Given the small gap between and , one might be tempted to conclude that the rescaling procedure does not bring substantial benefits in the identification of significant papers. However, the rank analysis presented in Fig. 5 includes the contribution of both old and recent MLs, whereas a close inspection reveals that the metrics perform in a drastically different way depending on the age of the target papers, as shown in Figure 3 and discussed in Section III.2.
This point can be also illustrated by using the rankings computed on the whole dataset. To show this, we divide the MLs into three equally-sized groups of MLs according to their age. By considering only the oldest MLs as target papers, we obtain whereas . By contrast, by considering only the most recent MLs as target papers, we obtain whereas . While this result shows a clear advantage of PageRank and rescaled PageRank for the oldest and for the most recent MLs, respectively, there exists a fundamental difference between the performance gaps observed for the oldest and the most recent MLs. The bias of PageRank towards old nodes (Fig. 1A) makes it indeed easier for the metric to find old significant papers. On the other hand, rescaled PageRank does not benefit from any bias in ranking the most recent MLs as the ranking by the metric is not biased by paper age (Fig. 1C). It is thus crucial to realize that when we compute the rankings on the whole dataset, the value of the average ranking ratio by the metrics depends on the age distribution of the important papers that we aim to identify. Were we using the rankings computed on the whole dataset for evaluation and were we only considering the oldest (most recent) MLs as target papers, we would have concluded that PageRank (rescaled PageRank) is by far the best-performing metric. These observations demonstrate that an evaluation of the metrics based on the whole dataset is strongly biased by the age distribution of the target items and, for this reason, unreliable as a tool to assess metrics’ performance.
Appendix C Alternative rescaling equations
Eq. (3) forces the rescaled score of a paper to have mean value equal to zero and standard deviation equal to one, independently of its age (i.e., independently of ). Fig. 2C shows that this rescaling is sufficient to achieve a time-balanced ranking of the papers. We consider now a simple rescaling in the form . While the mean value of this score is equal to one, one can show that its standard deviation is given by
| (8) |
where denotes the expectation value within the averaging window of paper . Fig. B.6 shows that strongly depends on node age in the APS dataset. As a result, the ranking by is strong biased towards old nodes ().
We also considered a variant of our method where the rescaled scores are still computed with Eq. (3), but and are computed over the papers published in the same year as paper . The resulting rescaled score produces a ranking that is much less in agreement with the hypothesis of unbiased ranking () than the ranking by . For this reason, the definition of papers’ averaging window adopted in the main text is based on number of publications and not on real time. However, is still preferable to the original scores when the aim is to compare papers of different age. Also note that might be preferable if one is interested in a ranking of the papers where each publication year is represented by the same number of papers, apart from statistical fluctuations.
Appendix D Dependence of the properties of the rankings by and on the temporal window size
As described in the main text, the rescaled scores and of a certain paper are obtained by comparing its score with the scores of the nodes that belong to its “averaging windows“ and , respectively. To motivate the choice adopted in the main text, we start by observing that the size of the averaging window should be neither too large nor too small. A large window would include papers of significantly different age, which would turn out to be ineffective in removing the temporal biases of the metrics – note that the ranking by is perfectly correlated with the ranking by for . On the other hand, we want and to be sufficiently large to avoid that some papers are only compared with little-cited papers, which is likely to happen for a small window due to the skewed shape of the citation count distribution medo2011temporal .
To understand the possible drawbacks of a too small averaging window, we compute the number of papers whose averaging windows contain less than five papers that received at least citations. The results are shown in Fig. 7. For , the averaging windows of a nonzero number of papers have less than five papers with at least five received citations. We restrict our choice to the range , for which no paper’s average window has less than five papers cited at least five times.
To evaluate the ability of the rescaling procedure to suppress the bias of the metrics, we estimate the deviation of the standard deviation ratio from the expected value (one) for an unbiased ranking (see the main text for details). Fig. 8 reports the behavior of the deviation as a function of and for different selectivity values . The upward trends of Fig. 8 suggest that in order to reduce the ratio , it is convenient to choose and as small as possible. Hence, the choice allows us to obtain an histogram close to the expected unbiased histogram – values are close to one for all the values of represented in the figure – and, at the same time, to avoid that some nodes are only compared with little cited nodes, as discussed above for 7.
An important observation is that the correlations between the rankings obtained with different values of and the ranking obtained with are close to one (Fig. 9), which means that the rescaling procedure is robust against variation of the averaging window sizes and .
Appendix E Dependence of CiteRank performance on its parameter
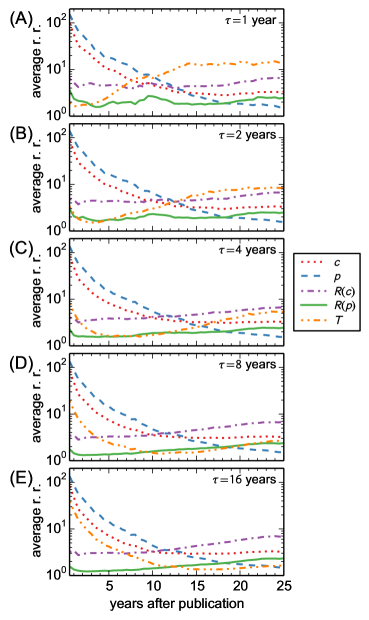
Fig. 10 shows the dependence of the average ranking ratio on paper age, for five different values of CiteRank parameter . The figure shows that the behavior of CiteRank’s performance strongly depends on the choice of its parameter. When the parameter is small (panel A, year), CiteRank performance is optimal (lowest average ranking ratio) for very recent papers, and gradually worsens with paper age. As increases (moving from panel A to E), the minimum point of CiteRank’s average ranking ratio gradually shifts toward older nodes. When is sufficiently large (panel E, years), CiteRank behavior is qualitatively similar to that of PageRank, and its performance gradually improves with paper age – this is indeed consistent with the fact that in the limit .
Appendix F Dependence of ranking ratio and identification rate on paper age
To assess the ranking of each Milestone Letter years after its publication, we compute the rankings each days (results for different choices of are qualitatively similar). At each computation time , only the papers (with their links) published before time are considered for the scores’ and rankings’ computation, and each ML contributes to the ranking ratio corresponding to its age at time . This procedure allows us to save computational time with respect to computing the rankings of each ML exactly years after its publication, because it requires fewer ranking computations.
In formulas, the average ranking ratio for -years old papers is defined as
| (9) |
where we used for Fig. 3B; in the equation above, denotes the ranking position of ML at time according to metric , denotes the number of MLs that are at least years old at the end of the dataset, denotes the largest integer smaller than or equal to , denotes the Kronecker delta function of and . Hence, at each computation time , each ML published before time gives a contribution to the average ranking ratio for papers of age . Similarly, the identification rate is computed as
| (10) |
where is equal to one if paper is among the top papers in the ranking by metric at time , equal to zero otherwise.
To define the normalized identification rate (NIR) of a metric, at each computation time we divide the papers into groups according to their age, analogously to what we did in section III.1 to evaluate the temporal balance of the metrics. The NIR of metric is then defined as
| (11) |
where is a decreasing function of the fraction of nodes that belong to the same age group of node and are ranked among the top by metric . Denoting by the expected value of for an unbiased ranking, we set if (i.e., if the metric tends to favor papers that belong to the same age group as paper ), whereas if . According to Eq. (11), if the identified ML belongs to an age group which is over-represented in top by the factor of four, it only counts as in the normalized identification rate.