Material Screening with HPGe Counting Station for PandaX Experiment
Abstract
A gamma counting station based on high-purity germanium (HPGe) detector was set up for the material screening of the PandaX dark matter experiments in the China Jinping Underground Laboratory. Low background gamma rate of 2.6 counts/min within the energy range of 20 to 2700 keV is achieved due to the well-designed passive shield. The sentivities of the HPGe detetector reach mBq/kg level for isotopes like K, U, Th, and even better for Co and Cs, resulted from the low-background rate and the high relative detection efficiency of . The structure and performance of the counting station are described in this article. Detailed counting results for the radioactivity in materials used by the PandaX dark-matter experiment are presented. The upgrading plan of the counting station is also discussed.
keywords:
Radiation assay; Dark Matter; PandaX; gamma counting station; HPGe detector1 Introduction
The PandaX[1] project, located in the China Jinping Underground Laboratory (CJPL)[2], was initiated for searching rare physical events in particle and astrophysical physics with xenon detectors. Its first and second stage (PandaX-I[3] and PandaX-II[4]) experiments are for dark matter search[5, 6]. Low-background rate is required for the detection of rare dark matter signals, thus the low radioactive background controlling is one of the most critical issues. The radioactivity in the materials used for the detectors must be sufficiently low to ensure a good sensitivity for physical signals. Measurements of the material backgrounds are the first step for the constructions of the detectors. Various techniques have been developed to measure the low-level radioactivities, such as neutron activation analysis (NAA), inductively coupled mass spectrometry (ICP-MS), and high purity germanium (HPGe) gamma counting. Because of its wide energy window (several keV to tens of MeV) and high energy resolution, HPGe detector can be used to measure the most radioactive isotopes, such as 60Co, Cs, 40K and the decay products from the uranium and thorium chains. HPGe counting uses a nondestructive method, so it is not only useful in screening samples, but also in assaying of finished products.
A HPGe counting station has been set up for the material screening of PandaX-I and PandaX-II in CJPL. In this paper, we describe the construction of the counting station in Sec. 2 and discuss its performance in Sec. 3. The calibration and material assay process for the PandaX experiment is described in Sec. 4, and the results are presented in Sec. 5. A summary is given in the last section, together with an upgrading plan of the counting system.
2 Overview of the Counting Station
The PandaX gamma counting station is comprised of a HPGe detector and a passive shielding system.
The HPGe detector was fabricated by Ortec, customarily designed for the purpose of radiation counting. It consists of a P-type coaxial HPGe crystal, a cooling system and a pre-amplifier electronics. The sensitive mass of the crystal is 3.69 kg, resulting in a relative detection efficiency of 175% (to a standard NaI scintillator detector). The large sensitive mass makes it very effective for the detection of photons within the energy range of 0.01 to 20 MeV. The specification of the detector provided by the manufacturer is given in Tab. 1.
| Manufacturer | ORTEC |
| Detector model No. | GEM-MX94100-LB-C-HJ-S |
| Performance | |
| Relative efficiency | 175 |
| Threshold | 10 keV |
| FWHM at 1.33 MeV, 60Co | 2.3 keV |
| FWHM at 122 keV, 57Co | 1300 eV |
| FWHM at 14.4 keV, 57Co | 1280 eV |
| Crystal | |
| Sensitive crystal mass | 3.69 kg |
| Crystal diameter | 93.8 mm |
| Crystal length | 103.7 mm |
| Hole diameter | 11.2 mm |
| Hole depth | 89.9 mm |
| Dead layer thickness | 0.015 - 0.7 mm |
| Cryostat | |
| End cap diameter | 108 mm |
| End cap thickness | 0.9 mm |
| End cap to crystal | 5 mm |
| End cap material | Carbon fiber |
The main purpose of the passive shielding system is to reduce the background-radiation level resulting from the ambient environment. Since the cosmic muon flux inside CJPL is very low[7], a cosmic muon veto is unnecessary.
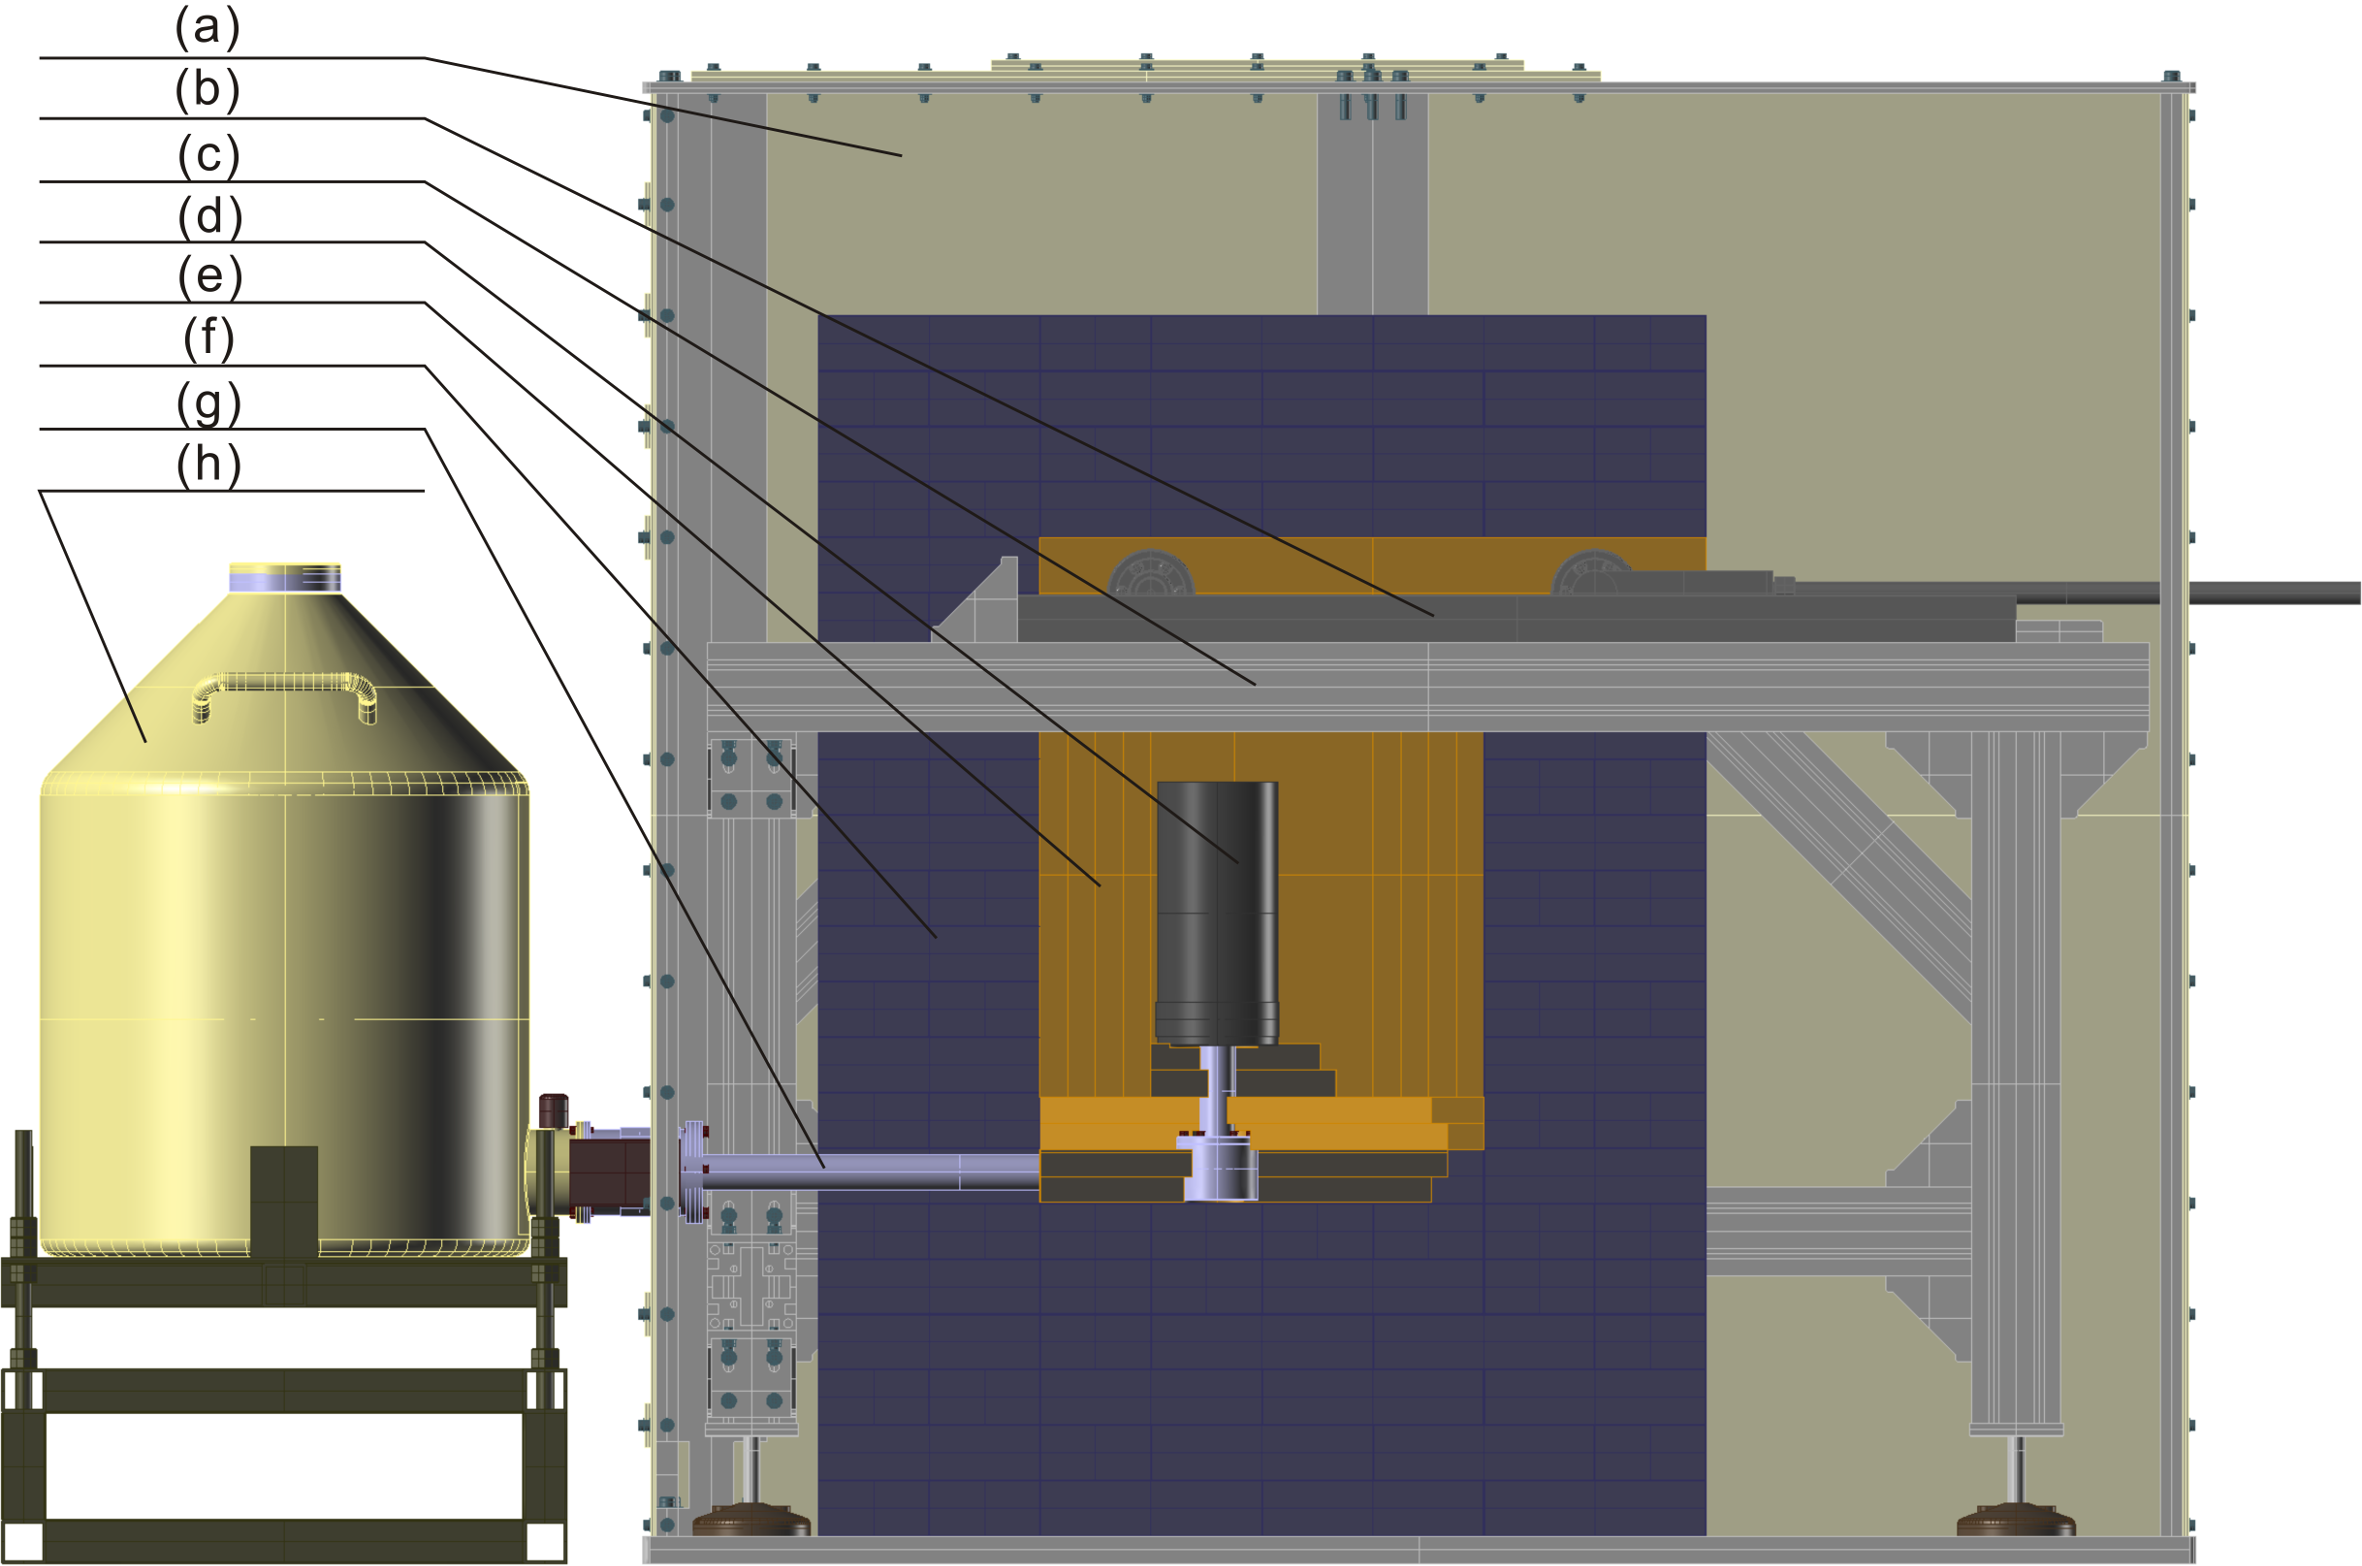
A schematic view of the counting station is shown in Fig. 1. The HPGe crystal together with a cover of carbon fiber is located in a chamber made of high-purity oxygen free (OFHC) copper at the center of the shielding system (part d). The dimension of the chamber is cm3 and the thickness of the chamber Cu wall is 10 cm. Samples to be counted will be placed in the chamber during operation, and the available space is 11.92 L. An OFHC copper stand with a height of 5 cm is placed at the bottom the chamber to support the HPGe crystal. The bottom of the chamber and the stand were designed to match the curvature of the HPGe cryostat finger seamlessly, providing protection to the finger and background shielding. The chamber is enclosed by a lead shield, which is made of more than 500 lead bricks, and each brick has a dimension of cm3. The bottom of the lead shield has 30 cm in thinness and the other faces are 20 cm thick, respectively. The top of the lead shield and the copper chamber are fixed on a guiding rail of aluminum alloy, so they can move along the rail horizontally, enabling the physical access to the chamber. The guiding rail is supported by an aluminum-alloy structure. An air-tight acrylic shell covers the whole shielding system to prevent Rn leaking from the air. The cooling system for the detector consists a liquid nitrogen dewar with a capacity of 30 L, a cooling finger with a length of 63 cm. Since the dewar is placed outside the shielding system, the long cooling finger ensures enough shielding space for the HPGe crystal.
The lead and OFHC copper used for the construction of the shielding system were screened by the present counting station and the HPGe counting facility[8] at Laboratori Nazionali del Gran Sasso (LNGS), respectively. The counting results of the main radioactive isotopes are summarized in Tab. 2. They provide one of the important constrains on the sensitivity of this detector.
| Material | Radioactive Isotope | Radioactivity [mBq/kg] |
|---|---|---|
| Copper | 60Co | 0.200.09 |
| 56Co | 0.200.07 | |
| 58Co | 1.20.2 | |
| 40K | 41 | |
| 137Cs | 0.16 | |
| 54Mn | 0.190.08 | |
| 238U | 0.38 | |
| 232Th | 0.51 | |
| 235U | 0.86 | |
| Lead | 210Pb | 300 |
Rn is purged by flushing the chamber continuously with boiled-off nitrogen gas. The acrylic shell is not entirely gas-tight, therefore after opening the chamber and exchanging samples, it usually takes about 12 hours for the Rn to drop to its lowest level. Assume all background in the measurement come from the Rn, its level inside the chamber is calculated to about 1.5 Bq/m3, which is two-order of magnitude lower than without purging.
A detailed analysis of the background sources along with a full Monte Carlo simulation is discussed in Appendix.
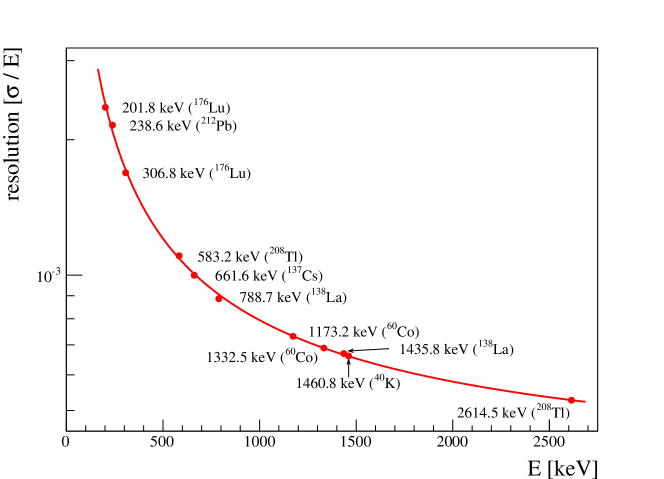
The energy resolutions of the detector are calibrated with different characteristic lines from the standard sources of 137Cs, 60Co and natural mineral powder of La2O3, where is the measured variance for an energy. The isotopes of 176Lu, 212Pb, 208Tl, 137Cs, 60Co, 138La and 40K have been seen from the gamma spectrum. The calibration results are shown in Fig. 2. The relation between the variance and the energy (in keV) can be expressed by a polynomial
| (1) |
where keV2, keV and . The fitted result agrees well with the manufacturer’s specification listed in Tab. 1, providing a functional form for the variance within [20, 2700] keV range, and the basic information for gamma-peak-counts finding and correlated analysis below.
3 Performance of the Counting Station
The most important parameters of a counting station are the detection sensitivities at different energies, normally reported in the unit of Bq/kg. The sensitivities define the ability of the counting station to distinguish candidate signals from backgrounds. Lower value of sensitivity means better performance.
For a given isotope with a characteristic gamma peak with energy , the sensitivity is calculated from following equation [9],
| (2) |
where is the mass of the sample to be measured, is the time of the sample counting, is the time of background-only counting, and is the corresponding HPGe detection efficiency to be discussed later. Taking into account the detector energy resolution, is generally taken as the number of background counts collected within the [-3, +3] window[10], where the is deduced from Eq. 1.
The parameter is a property related to the detector and the sample. It is mainly determined by the size of the HPGe crystal. The counting station has an excellent detection efficiency due to the large crystal mass, which, to our knowledge, is the largest one used currently in assaying facilities around the world. To improve the sensitivity, one can either increase the sample-counting time and the sample mass , or suppress the background rate .
Four possible sources of backgrounds for the counting station have been studied. First of all, high energy cosmic muons can introduce particle showers, serving as one source of the backgrounds. CJPL is the deepest underground laboratory around the world, providing excellent cosmic muon shielding. The muon flux inside the laboratory was measured to be cm-2s-1[7]. So the background contribution from cosmic muons is negligible. The second source of backgrounds comes from the radioactive isotopes inside the rocks and concrete. According to the measurement in [11], the maximum effective radioactivities in the rock and concrete are 19.880 Bq/kg for 238U, 8.15 Bq/kg for 232Th, and 36.669 Bq/kg for 40K. With the helping of the passive shield, only a tiny fraction of these radiations can enter the counting station, thus they are also negligible. The third is the unstable isotopes in the copper and lead for the construction of the shield, which is an important limitation of the detection sensitivities. Finally, an important background is expected to come from either the rest Rn inside the counting chamber or from the detector itself, like the electronics or the cryostat that are in close proximity.
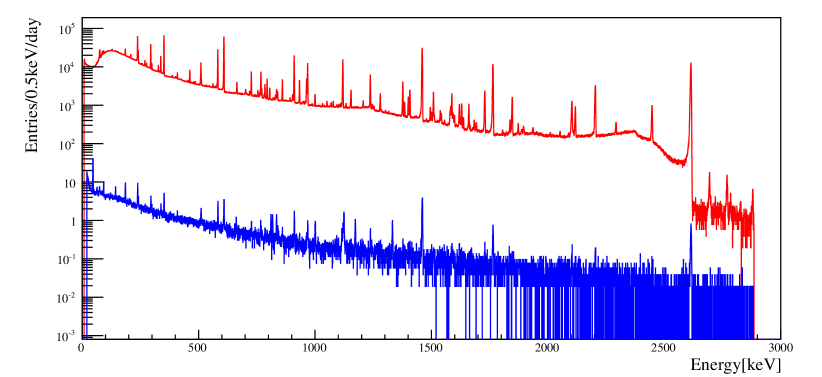
Fig. 3 shows the background gamma spectrum measured by the HPGe detector with the passive shield and Rn purging system. The spectrum measured without those is also shown for a comparison. It is seen that the shielding and Rn purging help to suppress the background level by more than 3 orders of magnitude. Specially, tn the energy range of 20 to 2700 keV, a background rate of counts/min had been obtained without the shielding, while a much lower rate of 2.59 counts/min was acquired with the background control measures.
For comparison, the background rate of the radioactive isotopes with characteristic energies are summarized in Tab. 3, averaged over with the background-only counting time days. Typically, the sample counting time is about 710 days, and the sample mass is between 0.3 to 1.5 kg. The detection efficiency varies from 0.2 to 10 depending on the geometrical factors and materials of samples, as well as the energy and branching ratios of the specific isotopes. Correspondingly, the sensitivities of the counting station can reach mBq/kg level for the isotopes such as K, U and Th, and even better for Co and Cs in normal operations.
| Isotope/chain | Energy [keV] | Background rate [counts/day] |
|---|---|---|
| 137Cs | 661.6 | 7.30.4 |
| 60Co | 1173.2 | 6.50.4 |
| 60Co | 1332.5 | 5.50.3 |
| 40K | 1460.8 | 22.60.7 |
| 235U | 143.8 | 32.10.8 |
| 235U | 185.7 | 37.50.8 |
| 235U | 205.3 | 18.20.6 |
| 238U/226Ra | 186.2 | 60.31.1 |
| 238U/214Pb | 295.2 | 30.00.8 |
| 238U/214Pb | 351.9 | 31.10.8 |
| 238U/214Bi | 609.3 | 20.90.6 |
| 238U/214Bi | 1120.3 | 7.80.4 |
| 238U/214Bi | 1764.5 | 4.50.3 |
| 232Th/228Th | 238.6 | 67.61.1 |
| 232Th/228Ac | 338.3 | 16.80.6 |
| 232Th/208Tl | 583.2 | 20.40.6 |
| 232Th/228Ac | 911.2 | 8.30.4 |
| 232Th/228Ac | 968.9 | 5.50.3 |
| 232Th/208Tl | 2614.5 | 5.60.3 |
There are many low-background HPGe counting facilities running successfully around the world [12]. The properties of the representative ones are summarized in Tab. 4. The background rate of the PandaX counting station is comparable with those in MELISSA[13] and CORRADO[14], but higher than Gator[10]and GeMPI[15, 16]. The higher rate may come from the higher detection efficiency introduced by the large HPGe crystal mass, and may also come from the radioactive contaminations inside the readout electronics and cryostat.
| Name | Laboratory | Crystal mass (kg) | Energy range (keV) | Background rate (counts/min) |
| MELISSA | KURF | 1.1 | 40 - 2700 | 5.42 |
| CORRADO | MPI-K | 0.93 | 100 - 2700 | |
| Gator | LNGS | 2.2 | 100 - 2700 | |
| GeMPI | LNGS | 2.15 | 100 - 2740 | |
| PandaX | CJPL | 3.69 | 100 - 2700 | 1.79 |
| 20 - 2700 | 2.59 |
4 Calibration and Sample Counting
In this section, we discuss how to calibrate our detector systems using standard either gamma sources or gammas from residual Rn gas. We will also discuss procedures and analysis in sample counting.
4.1 Energy Calibration
The detector is calibrated using the Rn gamma lines in the energy spectrum after 24 hours of data collection. Ortec DSPEC-502 is used as the data aquisition (DAQ) system. A rise time of 12 s and flat top of 0.8 s are used for the energy filter designed for vetoing pile-up events, which are rare in our data taking. Event energy, , is calculated by the trapezoidal-energy-filter output of the DAQ, , using the following equation,
| (3) |
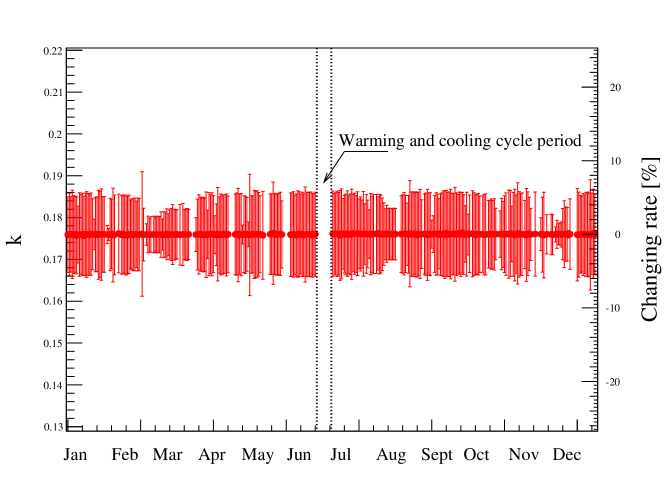
where is the calibration constant and the parameter is for possible offset. The fluctuation of the calibration constant can be used to monitor the stability of the detector. The values of obtained in 2014 is shown in Fig. 4. Due to the low count rate, there is a large statistical uncertainty in . Except for the period of warming up and cooling down cycle from June 20 to July 2, 2014 and a few days when data storage problems happened, all the data in that year are recorded. With an average uncertainty of 6, the is kept roughly at a constant 0.176, indicating a stable status of the detector. The data from energy calibration are also used to monitor the upper limit of Rn concentration within the detector chamber, which is stable at 1.5 Bq/m3 during the normal operation. Finally, is a very small number having little effect on the energy calibration.
4.2 Detection Efficiency Study
The detection efficiency changes with various samples due to their different geometrical structure and material composition. For each sample, the value is estimated with a Monte Carlo (MC) simulation program based on the Geant4 toolkit. However, we can also calibrate the simulation with standard radiation sources.
For a given sample with the known activity of a concerned isotope as well as the sample counting time , the number of total radiation events = is expected. For the gamma peak with characteristic energy , the number of sample counts in duration detected by the counting station is simulated, integrated within the [-3, +3] region. consists of the net radiation counts by the concerned gamma peak, and a certain amount of Compton background counts from higher energy gammas. To find the latter, the average value of sample counts and within [-9, -3] and [+3, +9] windows is taken as an approximation, assuming the Compton background has a linear slope in the whole 9 region. Thus, after removing the Compton background, the net radiation counts is calculated as,
| (4) |
and thererefore is calculated as
| (5) |
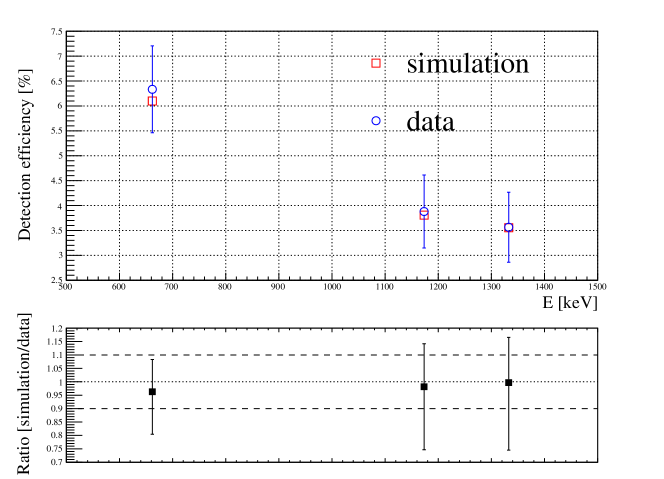
The dominant uncertainty in the MC simulation comes from the relative position of the crystal with respect to the carbon fiber entrance window, or the distance of the crystal top surface to the entrance window. Based on the value provided by the fabricator, this distance as implemented in the MC simulation is calibrated by using two standard 137Cs and 60Co sources with known activities, as shown in Fig. 5. The predictions from MC simulations agree well with the data. The maximum difference is smaller than 5.
4.3 Actual Sample Counting and Analysis
Samples should be pre-treated to remove possible contaminations on the surface. In general, following procedures for the counting have been performed in PandaX:
-
•
wash the sample with a type of solvent in ultrasonic for 30 - 60 minutes;
-
•
dry the sample with nitrogen gas;
-
•
seal the sample with clean plastic bag;
-
•
measure the weight and geometrical parameters of the sample and make a record;
-
•
place the sample (with bag) into the station’s copper chamber;
-
•
start counting after 12 hours of Rn purging.
For the -th characteristic gamma peak with energy of a concerned isotope, the characteristic activity is defined by
| (6) |
where and are the number of net radiation counts at energy in sample counting time and background counting time , respectively. The detailed calculation of is described in Eq. 4, as for the basic principle is the same. The activity of the isotope is the weighted average of all its values. The weight for one characteristic gamma is determined by both the branching ratio and the detection efficiency.
5 Screening Results for PandaX experiments
The materials used for the construction of the PandaX-I/II experiments have been screened with the counting station. The detailed counting results are presented in Tab. 5. The use of the materials and the results are discussed in the following sections.
| Material | Supplier | Use | Amount | Unit | 226Ra | 228Ac | 228Th | 235U | 137Cs | 60Co | 40K | |
| PMTs | ||||||||||||
| 1. | 3" R11410-MOD KA0049 PMT | Hamamatsu | PandaX-II topbottom arrays, PandaX-I bottom array | 1 pc | mBq/pc | 2.401.22 | 5.182.50 | 4.712.09 | 2.70 | 0.72 | 2.660.57 | 17.33 |
| 2. | 3" R11410-MOD KA0051 PMT | Hamamatsu | PandaX-II topbottom arrays, PandaX-I bottom array | 1 pc | mBq/pc | 1.880.97 | 1.75 | 1.63 | 1.17 | 0.39 | 4.230.53 | 16.069.39 |
| 3. | 1" R8520-406 PMT | Hamamatsu | PandaX-II veto, PandaX-I top array | 7 pcs | mBq/pc | 0.12 | 0.14 | 0.15 | 0.11 | 0.170.04 | 0.520.05 | 9.940.98 |
| 4. | 3" PMT base | Fralock | PandaX-II topbottom arrays | 3 pcs | mBq/pc | 3.030.40 | 0.48 | 0.390.28 | 0.640.34 | 0.14 | 0.10 | 3.48 |
| 5. | 3" PMT base | Fralock | PandaX-I bottom array | 3 pcs | mBq/pc | 1.140.14 | 0.29 | 0.160.15 | 0.370.19 | 0.330.08 | 0.06 | 1.25 |
| 6. | 1" PMT base | Fralock | PandaX-II veto, PandaX-I top array | 2 pcs | mBq/pc | 0.730.18 | 0.29 | 0.32 | 0.18 | 0.350.09 | 0.07 | 2.44 |
| Metal | ||||||||||||
| 7. | Stainless steel 304L P03 | TISCO | PandaX-II inner vessel | 1.043 kg | mBq/kg | 1.341.11 | 1.73 | 6.091.89 | 1.68 | 0.47 | 0.970.45 | 8.10 |
| 8. | Stainless steel 304L P04 | TISCO | PandaX-II over flow chamber | 0.411 kg | mBq/kg | 1.43 | 2.41 | 1.90 | 2.00 | 0.68 | 0.750.63 | 11.63 |
| 9. | Stainless steel 304L P05-1 | CISRI | PandaX-II electrodes | 0.40 kg | mBq/kg | 1.28 | 1.93 | 1.53 | 2.35 | 0.600.58 | 0.53 | 13.43 |
| 10. | Stainless steel 304L P05-2 | CISRI | PandaX-II electrodes | 0.55 kg | mBq/kg | 1.45 | 1.64 | 1.27 | 1.67 | 0.490.45 | 0.40 | 9.248.76 |
| 11. | Stainless steel 304L P07-1 | CISRI | PandaX-II CF flange | 0.729 kg | mBq/kg | 1.9 | 3.0 | 3.4 | 2.7 | 1.41.0 | 0.7 | 16.2 |
| 12. | Stainless steel 304L P07-2 | CISRI | PandaX-II CF flange | 0.261 kg | mBq/kg | 1.70 | 2.74 | 1.71 | 2.43 | 2.360.96 | 1.030.75 | 13.95 |
| 13. | Stainless steel 316Ti | Changrong | PandaX-I inner vessel | 0.738 kg | mBq/kg | 1.68 | 4.222.71 | 2.17 | 4.882.73 | 0.93 | 5.950.83 | 12.80 |
| 14. | Stainless steel 316Ti | Custom | screws for PandaX-I top PMT array installation | 525 pins | mBq/pin | 0.001(3) | 0.004(6) | 0.004(3) | 0.009(2) | 0.002 | 0.004 | 0.020(9) |
| 15. | Carbon steel GB/T699-1999 | Custom | bolts for PandaX-II inner vessel sealing | 0.48 kg | mBq/kg | 19.27.5 | 9.6 | 5.5 | 8.5 | 3.63.1 | 2.5 | 92.8 |
| 16. | OFHC copper | CHINALCO | PandaX-IPandaX-II outer vessel, shaping rings, TPC plates | 2.836 kg | mBq/kg | 0.38 | 0.36 | 0.51 | 0.86 | 0.16 | 0.200.09 | 4.001.00 |
| Plastic | ||||||||||||
| 17. | PTFE | McMaster | PandaX-II TPC reflectors, PandaX-I TPC top reflectors | 0.955 kg | mBq/kg | 3.160.96 | 1.49 | 1.41 | 1.26 | 1.300.44 | 0.34 | 7.37 |
| 18. | PTFE | Sanxin | PandaX-I TPC sidebottom reflectors | 0.129 kg | mBq/kg | 6.16 | 9.48 | 8.94 | 9.946.47 | 5.862.77 | 2.31 | 88.6751.31 |
| 19. | Epoxy | Hanko | PandaX-II PMT insulation, PandaX-I feedthrough sealing | 0.036 kg | mBq/kg | 35718 | 14330 | 25932 | 2516 | 217 | 11 | 311125 |
| Cablesconnectors | ||||||||||||
| 20. | HV cable | Matsusada | PandaX-IPandaX-II high voltage | 2.6 m | mBq/m | 3.20 | 3.57 | 2.69 | 2.74 | 0.89 | 0.70 | 14.77 |
| 21. | Kapton cable | Accu-Glass | PandaX-IPandaX-II signal | 22.2 m | mBq/m | 0.124 | 0.199 | 0.116 | 0.063 | 0.066 | 0.049 | 1.586 |
| 22. | RG316D cable | Accu-Glass | PandaX-IPandaX-II signal | 51 m | mBq/m | 0.078 | 0.179 | 0.071 | 0.042 | 0.037 | 0.025 | 1.001 |
| 23. | Optical fiber | Accu-Glass | PandaX-IPandaX-II photon signal calibration | 1 pc | mBq/pc | 2.33 | 1.93 | 2.04 | 3.50 | 1.470.60 | 0.57 | 16.3610.18 |
| 24. | Socket | Accu-Glass | PandaX-IPandaX-II PMT base | 100 pins | mBq/pin | 0.002(9) | 0.005(2) | 0.002(2) | 0.005(7) | 0.003(8) | 0.001(3) | 0.049(1) |
| 25. | Socket | Kyocera | PandaX-IPandaX-II inner vessel feedthrough | 99 pins | mBq/pin | 0.003(9) | 0.006(9) | 0.004(6) | 0.008 | 0.002(1) | 0.001(8) | 0.035(6) |
| 26. | Capacitor | Kyocera | PandaX-IPandaX-II PMT base | 1000 pcs | mBq/pc | 0.150.04 | 0.10 | 0.04 | 0.14 | 0.03 | 0.02 | 0.31 |
| 27. | Resistor | Kyocera | PandaX-IPandaX-II electric field | 18 pcs | mBq/pc | 0.030(4) | 0.058(9) | 0.023(7) | 0.026(8) | 0.011(9) | 0.011(6) | 0.344 |
| 28. | Soldering tin 3mm | Lucas-Milhaupt | PandaX-IPandaX-II device welding | 0.454 kg | mBq/kg | 8.811.67 | 38.553.75 | 30.983.41 | 2.39 | 1.81 | 0.96 | 26.17 |
| 29. | Soldering tin 1mm | Lucas-Milhaupt | PandaX-IPandaX-II device welding | 0.124 kg | mBq/kg | 9.59 | 7.74 | 23.693.11 | 52.30 | 5.564.11 | 2.01 | 40.29 |
5.1 Stainless Steel
Stainless steel is used for the building of the inner vessels, which serve as the containers of xenon and the detector, in the PandaX dark matter experiments. The large mass and the close distance from the sensitive volume make the inner vessel one of the major sources of background events. In the PandaX-I experiment, the inner vessel consumed 525 kg of stainless steel while only 257 kg was used in PandaX-II, in which no bottom flange was built. In PandaX-I, the steel was chosen from the market with the lowest background radiation. MC simulation shows that about 1/4 of the electron-recoil (ER) background was contributed by the inner vessel in PandaX-I as shown in Tab. 6. In PandaX-II, a new inner vessel was constructed with steel made specially by the China Iron and Steel Research Institute Group (CISRI) from selected raw materials, resulting in much lower background radiation. The screening results indicate that the 60Co activity in PandaX-II steel was only about 1/6 of that in PandaX-I. Stainless steel used in PandaX-II is the purest used in the xenon dark matter experiments around the world thus far[17, 18].
| Item | PandaX-I [mDRU] | PandaX-II [mDRU] |
|---|---|---|
| PMTs+bases | 6.96 | 0.097 |
| Inner vessel | 3.62 | 0.045 |
| PTFE panels | 0.64 | 0.021 |
| Copper outer vessel | 0.87 | 0.016 |
| Other IV components | 1.47 | 0.026 |
| Total | 13.56 | 0.205 |
5.2 Polytetrafluoroethylene (PTFE)
PTFE was used to build the field cage of the detector, mainly the shaping ring supporters and photon reflectors. PandaX-I used 13 kg of PTFE, and PandaX-II used 51 kg due to the larger detector and additional layer of photon reflector. The PTFE used in PandaX-II had lower level of 137Cs and 40K contamination, leading to lower ER background.
The alpha-capture process of and produce neutrons, which are the most dangerous background in dark matter search. The particles are generated by the uranium and thorium decay chain. High abundance of 13C (1.07 in natural carbon) and 19F (almost 100 in natural fluorine) in PTFE (CF3-(C2F4)n-CF3) make them the main sources of neutron background in PandaX dark matter experiments. Lower levels of 235U, 238U and 232Th contaminations in PTFE were found in PandaX-II in comparison with PandaX-I.
5.3 Photonmultiplier Tubes (PMTs)
The technique of dual phase xenon time projection chamber is employed in both PandaX-I and PandaX-II. Two arrays of PMTs were constructed to detect the primary and proportional light from the collisions in liquid xenon. The top PMT array of PandaX-I consisted 143 PMTs of Hamamatsu R8520-406 (1-inch), and the bottom array consisted 37 PMTs of Hamamatsu R11410-MOD (3-inch). PandaX-II used 55 R11410-MOD PMTs in the top and bottom array, respectively, and additional 48 R8520-406 PMTs for veto purpose. These models of PMTs were fabricated specifically for low radioactive background application. The R8520-406 PMT has the same level of radioactivity as those used in the XENON100 experiments[17]. Considering the larger size, the R11410-MOD PMTs also showed good radiopurity. MC simulation indicates that PMTs are the main source of ER background in both PandaX-I and PandaX-II (Tab. 6).
5.4 Miscellaneous Components
More than 80 samples, including copper, cables and connectors, had been screened by the gamma counting station for PandaX experiments. Radiopure OFHC copper provided by the China Luoyang Copper Co. LTD (CHINALCO) was selected to build the outer vessel and shaping rings of the detector. Clean cables and connectors were selected based on the counting results. The ER background budgets of the components estimated by MC simulation are summarized in Tab. 6 by applying the same data selection cuts as used in the data analysis. PandaX-II has much lower background level than PandaX-I due to its larger detector so that the self-shielding effect of liquid xenon helps to shield more external radiations.
6 Summary and Outlook
A gamma counting station had been set up in the CJPL for the background counting of the PandaX-I/II dark matter experiments. An excellent counting sensitivity has been achieved due to the muon-free environment, the well-designed passive shielding, and the large sensitive HPGe mass. The counting station has screened various of materials and component samples for the construction of the PandaX infrastructure and detectors. The results are used to keep the background in accepted levels for the different stages of the PandaX experiments.
An upgrade of the counting station is planned. The acrylic shell will be replaced by a stainless steel shell, which is able to hold a vacuum of 0.1 Pa. By vacuuming the shell and filling boiling nitrogen gas, the Rn level inside the station will reach desired value much faster, improving the Rn puring efficiency.
The counting station will be working continually for the current and upcoming PandaX experiments. It will work not only for dark matter research, but also for other low background rare event searching experiments.
Acknowledgement
The PandaX project has been supported by a 985-III grant from Shanghai Jiao Tong University, a 973 grant from Ministry of Science and Technology of China (No. 2010CB833005), and grants from National Science Foundation of China (Nos. 11055003, 11375114, 11435008, 11455001, 11505112 and 11525522). This work is supported in part by the Shandong University, Shanghai Key Laboratory for Particle Physics and Cosmology, Grant No. 15DZ2272100, and the CAS Center for Excellence in Particle Physics. The work has also been sponsored by Peking University and the University of Maryland. We thank the LNGS, especially Dr. Matthias Laubenstein, for helping us screen some Cu and Ti samples in the beginning.
References
- [1] XiGuang Cao et al. PandaX: A Liquid Xenon Dark Matter Experiment at CJPL. Sci. China Phys. Mech. Astron., 57:1476–1494, 2014.
- [2] K J Kang, J P Cheng, Y H Chen, Y J Li, M B Shen, S Y Wu, and Q Yue. Status and prospects of a deep underground laboratory in china. Journal of Physics: Conference Series, 203(1):012028, 2010.
- [3] Xiang Xiao et al. Low-mass dark matter search results from full exposure of the PandaX-I experiment. Phys. Rev., D92(5):052004, 2015.
- [4] Andi Tan et al. Dark Matter Search Results from the Commissioning Run of PandaX-II. Phys. Rev., D93(12):122009, 2016.
- [5] D. S. Akerib et al. Improved Limits on Scattering of Weakly Interacting Massive Particles from Reanalysis of 2013 LUX Data. Phys. Rev. Lett., 116(16):161301, 2016.
- [6] Laura Baudis. Results from the XENON100 Dark Matter Search Experiment. 2012.
- [7] Yu-Cheng Wu et al. Measurement of Cosmic Ray Flux in China JinPing underground Laboratory. Chin. Phys., C37(8):086001, 2013.
- [8] C. Arpesella. Proceedings of the international committee for radionuclide metrology conference on low-level measurement techniques a low background counting facility at laboratori nazionali del gran sasso. Applied Radiation and Isotopes, 47(9):991 – 996, 1996.
- [9] F Knoll Glenn et al. Radiation detection and measurement. John Wiley&Sons, New York, 1989.
- [10] L Baudis, A D Ferella, A Askin, J Angle, E Aprile, T Bruch, A Kish, M Laubenstein, A Manalaysay, T Marrodán Undagoitia, and M Schumann. Gator: a low-background counting facility at the gran sasso underground laboratory. Journal of Instrumentation, 6(08):P08010, 2011.
- [11] Zhi Zeng, Jian Su, Hao Ma, Hengguan Yi, Jianping Cheng, Qian Yue, Junli Li, and Hui Zhang. Environmental gamma background measurements in china jinping underground laboratory. Journal of Radioanalytical and Nuclear Chemistry, 301(2):443–450, 2014.
- [12] http://www.hep.umn.edu/aarm/facilities-detectorslist.php.
- [13] P. Finnerty, S. MacMullin, H. O. Back, R. Henning, A. Long, K. T. Macon, J. Strain, R. M. Lindstrom, and R. B. Vogelaar. Low-Background gamma counting at the Kimballton Underground Research Facility. Nucl. Instrum. Meth., A642:65–69, 2011.
- [14] D. Budjas et al. Highly Sensitive Gamma-Spectrometers of GERDA for Material Screening: Part 2. 2007.
- [15] H. Neder, G. Heusser, and M. Laubenstein. Low level γ-ray germanium-spectrometer to measure very low primordial radionuclide concentrations. Applied Radiation and Isotopes, 53(1–2):191 – 195, 2000.
- [16] G. Heusser, M. Laubenstein, and H. Neder. Low-level germanium gamma-ray spectrometry at the μbq/kg level and future developments towards higher sensitivity. In P.P. Povinec and J.A. Sanchez-Cabeza, editors, Radionuclides in the EnvironmentInt. Conf. On Isotopes in Env. Studies, volume 8 of Radioactivity in the Environment, pages 495 – 510. Elsevier, 2006.
- [17] E. Aprile et al. Material screening and selection for XENON100. Astropart. Phys., 35:43–49, 2011.
- [18] D. S. Akerib et al. Radiogenic and Muon-Induced Backgrounds in the LUX Dark Matter Detector. Astropart. Phys., 62:33–46, 2015.
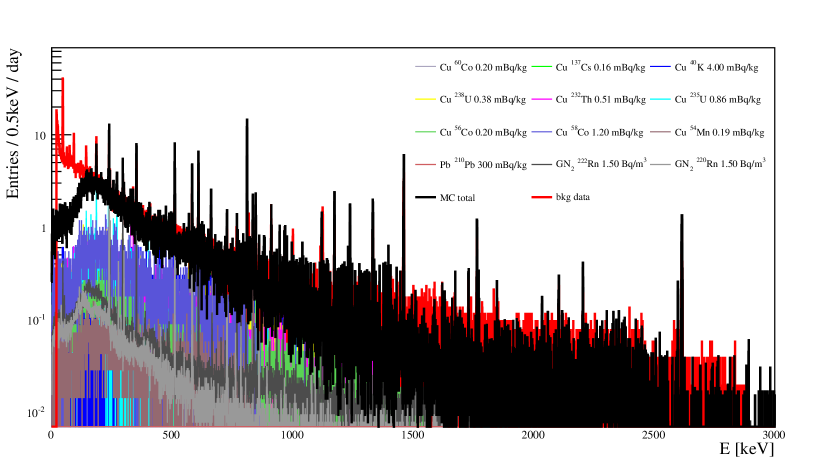
Appendix
In this Appendix, we use Geant4 MC to do a full simulation of the detector background from all the shielding components and Rn gas inside the counting chamber, as shown in the lower panel(blue) of Fig. 6. We use the screening results listed in Tab. 2 and 1.5 Bq/m3 level of Rn gas as inputs, while the background from the HPGe detector itself is omitted. Fig. 6 shows the energy spectra from the actual measurement (red) and MC simulations (black), respectively. For the MC simulation, individual contributions from different isotopes are shown as curves with different colors. A good agreement is seen between the data and simulation within [150, 3000] keV region. The discrepancy at the low-energy region (below 150 keV) may come from the noise produced by the internal electronics and signal cables of the detector.