1
Light from spiral galaxies is considered by two different observational techniques. The first, photometry, is a measure of total luminosity in specific wavelength bands used to trace mass fractions (specific star populations, gas fractions, dust, etc.). From the photometry, mass is associated with total light by population synthesis modeling (PSM). PSM is under-constrained (Conroy et al., 2009) precisely because the second observation of light, Doppler-shifted spectra, yielded the dark matter problem.
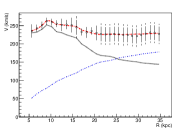
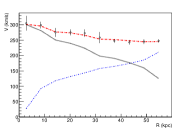
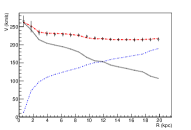
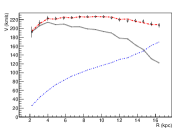
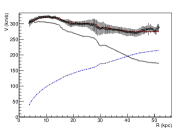
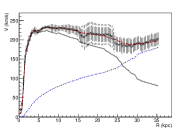
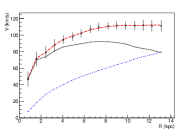
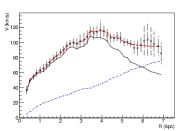
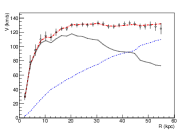
PSM returns mass-to-light ratios (M/L) for galaxies, based on a complex suite of model-based assumptions regarding chemical composition, evolution, dust, gas fractions, metallicity, etc. Finding a M/L ratio relies upon distance estimates, based on underconstrained standard candles. The M/L for a given galaxy parametrizes enclosed mass as a function of radius, which then gives test particle motion by the Poisson equation. Resulting rotation curves are the expected Keplerian, declining velocities seen in Fig. (3).
The conflicting observation, Doppler-shifted spectra of characteristic atomic transitions, is interpreted in the Lorentz framework as a relative velocity between frames. The resulting velocity parameter can be seen to be essentially constant at large radii, beyond all stars (Fig. 3). The divergence of the velocities implied by shifted spectra and photometry gave rise to the dark matter problem in spiral galaxies, discovered by Rubin et al. (1978) and Bosma (1978). The mismatch between dynamical mass and the luminous mass is generally explained by a class of cold, dark matter halo models (Navarro et al., 1997). There have been successful attempts to test alternate theories such as Modified Newtonian Dynamics (MOND) (Milgrom, 1983) and Conformal Gravity (Mannheim and O’Brien, 2012). Since dark matter halo models have two free parameters, they do little to constrain population synthesis models at the present time (Conroy et al., 2009), and hence serve as a possible interpretation, not as a prediction.
Soon after the discovery of the flat-rotation curve problem, another curious trend was noted by Rubin et al. (1980). In Persic et al. (1996), it was shown with exquisite precision—in a sample of 1,100 galaxies—that rotation curves fall into a spectrum inflected about the Milky Way’s rotation curve. This spectrum is known as the Universal Rotation Curve (URC); it is interpreted that galaxies smaller than the Milky Way are dark matter dominated, and those larger require only minimal dark matter halos.
As dark matter particles are hypothesized to interact in the standard gravitational manner, there exists no physical reason for smaller galaxies to accrete dark matter halos more successfully than larger galaxies. Likewise, the unexplained position of the Milky Way in the middle of the URC spectrum is suggestive. Thus, we instead interpret the URC as indicative of frame-dependent effects due to our observing frame, the Milky Way Galaxy, in the heuristic construction of the Luminous Convolution Model (LCM). This will serve as the starting point for the LCM interaction, and we show that the URC spectrum can be explained compactly based on this model prescription.
The LCM is a fitting prescription, with one free parameter , which we show in this work can be reduced to a constant dependent on the specific choice of the Milky Way luminous mass model. The LCM ansatz is that the relative, very small gravitational curvatures of very large frames are convolved in our observations of shifted spectra. This statement is reminiscent of the MOND paradigm (Milgrom, 1983), though it exploits changing relative curvatures (LCM) as opposed to modified accelerations (MOND).
Usually, relative galaxy curvature effects are ignored in the flat-rotation curve problem, as they are about four orders of magnitude smaller than the relative velocity effects when phrased kinematically. Commonly, relative curvature effects are evaluated (and obviated) by taking the algebraic difference of the gravitational redshifts of a galaxy from those of the Milky Way (Misner et al., 1970). This is a Galilean transformation of frames, and the photon wave-vector should instead transform within the Lorentz group. Hence, we instead use photon redshift frequencies to define relative galaxy frames, related through the Lorentz boost architecture to quantify the relationship kinematically. Kinematic phrasing of gravitational redshifts is common in astrophysics, what is new is the treatment of relative curvatures.
In this paper, the chosen sample of 25 galaxies is selected in an effort to represent a full spectrum of galaxy sizes and morphologies, and no other bias was placed on selection. This sample was used to both identify the LCM free parameter and constrain the Milky Way luminous mass model. We propose that when the LCM reproduces rotation curve data perfectly, as is the case in the current sample, that the resulting luminous mass profiles demonstrate agreement between the two observations of Dopper-shifted spectra and photometry. Hence, the LCM introduces a constraint to luminous mass modeling directly from Doppler-shifted spectra, using luminous matter estimates within the range defined by photometry. By considering the small frame effects due to relative curvatures of spiral galaxies, the LCM is a successful fitting formula which offers a simple explanation for the URC spectrum based on luminous mass estimates.
2 LCM fitting formula
Dark matter (DM) theories interpret the discrepancy between rotation curve data and Keplerian photometry predictions as the missing mass problem. The dark mass is hypothesized to interact only gravitationally with ordinary baryonic matter. This assumption is treated with the rotation curve formula,
| (1) |
where the prediction is fitted to reported rotation curve velocity data ( from shifted spectra ). The term is the contribution to rotation due to a spherically symmetric dark matter halo, and is from the baryonic contribution. The rotation curve formula is a mass sum , as terms in represent centripetal accelerations due to enclosed mass as a function of radius. The functional forms of the terms in Eq. (1) have been well-established (Mannheim (2006)) and usually provide an accurate statistical fit to the data due to the presence of two free parameters per galaxy in .
2.1 LCM construction
The LCM modifies Eq. (1), by replacing the DM halo velocity contributions, , with the relative curvature convolution, , in the fitting formula:
| (2) |
where is a dimensionless fitting parameter and is a function of luminous mass only.
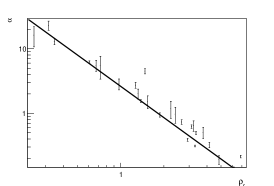
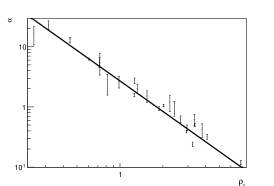
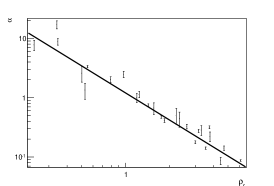
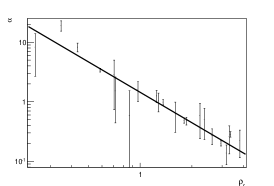
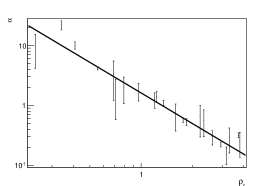
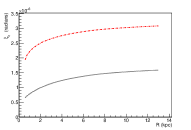
We find in this work (see Fig. 2) that the free parameter is correlated with the dimensionless ratio,
| (3) |
The subscript indicates the galaxy receiving the photon and the subscript indicates the photon emitting galaxy. Radial densities and are defined by:
| (4) |
where the total integrated luminous mass at the limit of the photometric data is , and is the exponential galactic disk scale length from fitting the resulting LCM luminous mass profile with the standard form of the galactic thin disk. Hence, for a given choice of the MW we can establish the free parameter space and fit for the exponent , as shown in Fig. 2. We report for a given Milky Way the exponent appears to be a constant.
The LCM mapping is a convolution of two Lorentz-type transforms and :
| (5) |
scaled by a curvature ratio ,
| (6) |
Coordinate light speeds and are defined by the pseudo-index of refraction (Narayan et al., 1997),
| (7) |
and represent deviations from flatness for some mass distribution which is symmetric about a central value of . The term is defined as the Schwarzschild time metric coefficient.
The term is the relative galaxy-to-galaxy transform. It is based on comparing the standard frequency form of the Lorentz Doppler shift formula to its hyperbolic form,
| (8) |
and identifying the Lorentz boost exponential with the frequencies sent and received, respectively and .
We define slightly curved galaxy manifolds by the Schwarzschild gravitational redshift frequencies
| (9) |
where is the characteristic photon frequency.
We use the the weak field form of the time metric coefficient (Hartle, 2003)
| (10) |
where is the Newtonian scalar gravitational potential defined by the luminous mass reported from photometry.
In Special Relativity, the two frames involved in Lorentz transformation are perfectly symmetric, so there is no distinction between who is the emitter and who is the receiver of the photon. However, as we transition to slightly curved galaxy frames, we pin the Lorentz frames with redshift frequencies emitted and received
| (11) |
for consistency. It is common practice to use the functional form in Eq. 8 to rephrase gravitational redshifts kinematically (Cisneros et al. (2015); Radosz et al. (2013)).
So, the term is based on the Lorentz exponential term:
| (12) |
Here and , are compared one-to-one in radii, and are the gravitational redshifts for the receiving galaxy (MW) and the photon emitting galaxy. It is this pseudo-rapidity angle which explains trends in the Universal Rotation Curve of Persic et al. (1996).
The transformation is
| (13) |
which can be interpreted as the difference from unity of the coordinate time of the galaxy emitting the photons with respect to the proper time of the Milky Way.
The second transformation, , is a Lorentz boost which transforms between the curved -frame (Eq. 12) to the flat -frame where observations are made. By the constancy of the speed of light, it is evident that observations are always made in flat-frames. The term defines the flat-frames involved in our observations, and is defined by , the expected frequency shifts for Keplerian orbital velocities predicted from photometry:
| (14) |
Keplerian rotations are our best estimates of what would be observed in the absence of relative curvature effects, as evidenced by the Solar System orbital velocity profiles which do not require dark matter.
According to the convention established in Eq. 11, the Lorentz mapping term is defined by the curved -frame into flat -frame
| (15) |
The term is defined as per Eq. 12.
The transformation —found to be the most robust across the sample—is the a ratio of the hyperbolic Lorentz boost evaluated at the limit of the data, , to the same boost at each radii, ,
| (16) |
The value at the limit of the data is a good approximation of the final extent of the baryon profile. The form of the hyperbolic boost is
| (17) |
3 Method
The LCM rotation curve velocity prediction, (Eq.2), is fit to reported rotation curve data , and the is minimized to best match the luminous mass profile to the data. We use the MINUIT minimization software as implemented in the ROOT data-analysis package (Brun and Rademakers, 1997), as follows:
-
1.
A database of modern estimates of the luminous mass components (gas, disk, bulge) are collected from the cited references.
-
2.
The associated Newtonian gravitational potential is calculated for each component and summed by superposition to parametrize Eq. 10;
-
3.
The convolution function, , is calculated using a choice of the Milky Way luminous mass profile;
-
4.
The fit is performed, and the procedure iterated to find the optimal luminous profile () which best reflects the rotation curve data ();
-
5.
the value for the LCM free parameter is recorded and added to our parameter space to constrain the ansatz in Eq. 3.
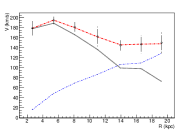
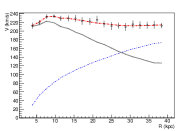
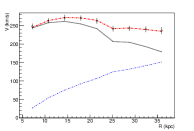
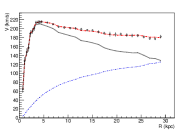
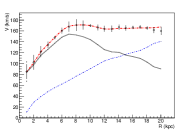
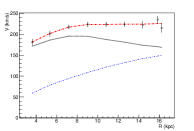
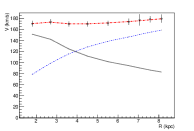
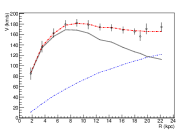
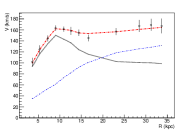
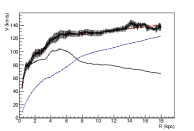
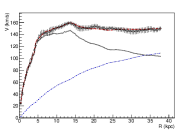
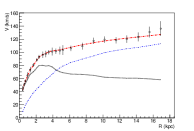
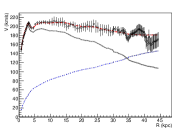
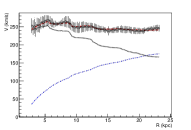
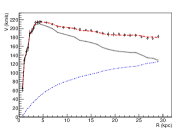
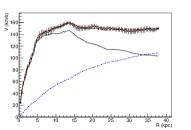
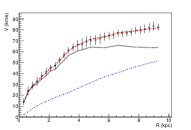
By iterating the luminous mass within bounds imposed by photometry, we reproduce rotation curve data almost exactly (see Fig. 3). The fits and resulting free parameter space reported here represent this LCM prescription.
4 Discussion & Analysis
4.1 A constraint to the Milky Way and the LCM free parameter
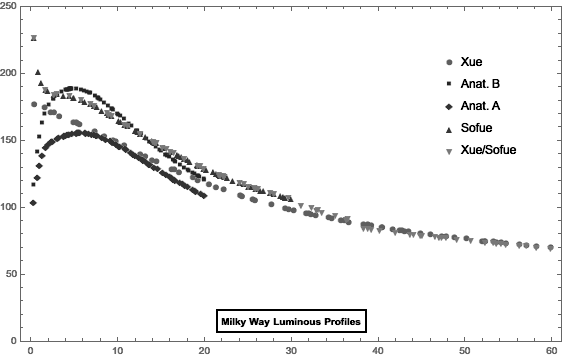
The LCM is sensitive to both the emitter and receiver galaxies, so the choice of input Milky Way data is essential. Since we make observations from within the system, the Milky Way luminous mass profile is notoriously difficult to determine (Carignan and Chemin, 2006). We have compared each of the galaxies in our sample to different, well studied Milky Way (MW) luminous mass models; Sofue (2013), Xue et al. (2008), and two models from Klypin et al. (2002). Table 2 and Fig. 1 compare the salient features of the MW models.
The sample of galaxies reported here encompasses a large variation in estimication of the common physical trends in the free parameter space. The complete set of individual emitter galaxy results are reported in Cisneros et al. (2015), and include , M/L, , the LCM reduced , the reduced values for the DM or alternative gravity model which were originally used to fit to the same data in the cited texts. The LCM luminous mass results for the 25 galaxies are consistent with documented bounds from photometry (de Blok et al., 2008).
In Fig. 2, we show the free parameter space for each MW model. Each dot in the figures represents one galaxy fit result, against thet specified MW. To test the correlation of with the ansatz , in Eq. 3, we fit the luminous profiles which result in each LCM fit with a thin disk, and use the resulting fit value of the scale length and an integrated total mass to parametrize . This process also gives the mass to light ratio (M/L) reported previously (Cisneros et al., 2015), using modern reports of the distance and luminosities (see Fig. 2). Plots of the distribution versus the guess for each MW choice are shown in in Fig. 2. The exponent found for each MW choice appears to be constant. Interesting, but beyond the scope of the current work, is that the exponents for the MW models in our sample are very similar to the exponents commonlly reported for dark matter halo density profiles (Navarro et al., 1997). Iin a future blind study the LCM free parameter will be tested as a constant for a given MW choice against a new sample. Currently, the most robust MW model by far across the current sample is the Sofue (2013) MW, which has an associated value of .
The Sofue (2013) MW model is by far the most centrally peaked velocity profile within the first kpc. This is an LCM prediction which can be falsified when the Large Event Horizon tightens the photometric constraints on this region of our galaxy.
We find that the MW models in our sample which are less centrally dense can not fit the bulge dominated galaxies such as NGC 2841, NGC 7814, NGC 7331 and NGC 5055 without artificial bounding on the model’s free parameter. Even when bounding is imposed artificially in the fitting process, the remain very centrally dense galaxies such as NGC 7814 which can only be fit using the Sofue MW. Fits using the less centrally dense MW models fail completely for this galaxy. In fact, it is the sensitivity to MW choice for these type of galaxy which allows degeneracy breaking of our central MW baryon gradient. In this paper, all rotation curve figures reflect the hybrid MW choice of the Sofue stellar bulge, and the Xue et al. (2008) stellar disk. The Xue stellar disk is used due to it’s high radial extent which allows LCM galaxy fits out to kpc in reported rotation curve data. The stellar disks of all four MW model reported here are asymptotically very similar.
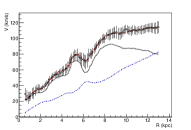
It is also interesting to note that the two galaxies NGC 891 and NGC 7814 from Fraternali et al. (2011) in can be compared as an example of galaxies with very similar enclosed mass at the limit of the data, but very different distributions of that mass. In Fig. 3, it is clear that the slope of the relative curvature contributions for these two galaxy reflect the different density gradients. The ulta-sensitivity of NGC 7814 to small changes in the input luminous mass profile (within a tolerance of s of m/sec ) is not mimicked by the NGC 891 fits, which is robust to a range of MW choices. We believe the sensitivity of NGC 7814 fits, and for similar galaxies, is due to when a galaxy being observed is very similar to the curvature of our own MW in some region. For NGC 7814, that region is the central one kpc.
| Galaxy | |||||||
|---|---|---|---|---|---|---|---|
| Xue/Sofue | 60 | 3.74 | 13.19 | 24 | |||
| Sofue | 30 | 4.76 | 6.52 | 23 | |||
| Xue | 60 | 5.76 | 11.45 | 24 | |||
| Klypin, A | 15 | 3.87 | 1.76 | 20 | |||
| Klypin, B | 15 | 4.53 | 2.65 | 20 |
4.2 Universal Rotation Curve trends
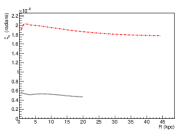
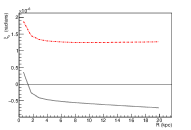
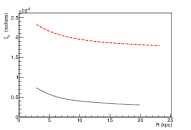
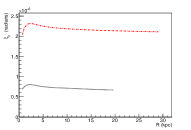
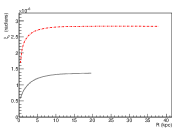
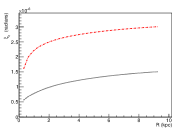
The galaxy-to-galaxy pseudo rapidity angle (Eq. 12) gives a simple explanation for the Universal Rotation Curve distribution (Persic et al., 1996). As can be seen in Fig. 4, the inflection of the reported rotation curves at high radii is mirrored by the function in the galaxy disk. The term,
| (18) |
is a map of the galaxy being observed onto our own Milkky Way, one-to-one in radius.
In terms of the gravitational redshifts,
| (19) |
In current analysis of the sample, all galaxy pseudo-rapidity angles tend to a constant, non-zero value at high radius, on the order of , and appear to act as envelope functions to the rotation curves observed.


5 Conclusions
In this paper we show how the LCM fitting formula can reconcile observations of Doppler-shifted spectra and photometry by the inclusion of relative galaxy curvatures. Relative curvature imposes the importance of the choice of a Milky Way luminous mass model, and we report our findings in this paper as to what we consider the most physical Milky Way model. With the unprecedented observational resolution of the Large Event Horizon telescope this portion of the LCM prediction can be falsified, and could further provide a constraint to our understanding of our Milky Way. The fitting formula presented in this paper is a first approach to a zero-parameter model in galaxy rotation curve modeling. We have shown the free parameter can be reduced to a constant value for a given choice of a Milky Way luminous mass profile.
Further, we have also shown that the LCM fitting formula can provide an alternate explanation to the Universal Rotation Curve groupings of Persic et al. (1996), based only on estimates of luminous mass. As can be seen in Fig. 3, the luminous profiles used to fit the rotation curves are well within physical bounds implied by photometry.
Although this is an attempt to explain rotation curves in a zero-parameter setting, any alternative gravitational model must be able to account for other phenomena currently attributed to cold dark matter. Thus, in future work, the LCM must address questions of weak lensing, galaxy mergers, clusters of galaxies and early structure formation. However, none of these problems can be investigated until there is an agreed upon estimate for the baryon distribution in the Local Group of galaxies. An equally interesting future question is how to phrase an LCM-style conjecture for the rotation curve of the Milky Way itself. Since we are within the emitter frame it will involve a map where the observer’s frame is embedded in the emitter’s global frame. The phenomenolgical implications of this question could provide testing much later in the future, since this prescription could be made for any emitter-receiver galaxy pair, and hence provide predictions for how rotation curves could be viewed from any arbitrary frame.
5.1 Acknowledgments
The authors would like to thank V. P. Nair, P. Schechter, R. A. M. Walterbos, T. Boyer, P. Fisher, R. Ott, K. Chng, and S. Rubin. J. A. Formaggio and N. A. Oblath are supported by the United States Department of Energy under Grant No. DE-FG02-06ER- 41420.
References
- Bosma (1978) Bosma, A. (1978). The distribution and kinematics of neutral hydrogen in spiral galaxies of various morphological types. Ph.D. thesis, PhD Thesis, Groningen Univ., (1978).
- Brun and Rademakers (1997) Brun, R. and Rademakers, F. (1997). Root. Nucl. Inst. & Meth. in Phys. Res. A, 389, 81–86.
- Carignan and Chemin (2006) Carignan, C. and Chemin, L. (2006). Extended hi rotation curve and mass distribution of m31. ApJ, 641, L109–L112.
- Cisneros et al. (2015) Cisneros, S., Goedecke, G., Beetle, C., and Engelhardt, M. (2015). On the Doppler effect for light from orbiting sources in Kerr-type metrics. Mon.Not.Roy.Astron.Soc., 448, 2733–2736.
- Cisneros et al. (2015) Cisneros, S., O’Brien, J. G., Oblath, N. S., and Formaggio, J. A. (2015). The Luminous Convolution Model for spiral galaxy rotation curves. ArXiv e-prints.
- Conroy et al. (2009) Conroy, C., Gunn, J., and White, M. (2009). The propagation of uncertainties in stellar population synthesis modeling i: The relevance of uncertain aspects of stellar evolution and the imf to the derived physical properties of galaxies. ApJ, 699, 486.
- Corbelli (2003) Corbelli, E. (2003). Dark matter and visible baryons in m33. MNRAS, 342, 199.
- de Blok et al. (2008) de Blok, W., Walter, F., , and Brinks, E. (2008). High-resolution rotation curves and galaxy mass models from things. AJ, 136, 2648.
- Dicaire et al. (2008) Dicaire, I., Carignan, C., Amram, P., Marcelin, M., Hlavacek-Larrondo, J., et al. (2008). Deep fabry-perot halpha observations of ngc 7793: a very extended halpha disk and a truly declining rotation curve. AJ, 135.
- Fraternali et al. (2011) Fraternali, F., Sancisi, R., , and Kamphuis, P. (2011). A tale of two galaxies, light and mass ngc 891 and ngc 7814. A&A, http://arxiv.org/abs/1105.3867.
- Hartle (2003) Hartle, J. (2003). Gravity. Addison-Wesley.
- Klypin et al. (2002) Klypin, A., Zhao, H., and Somerville, R. (2002). Extended hi rotation curve and mass distribution of m31. ApJ, 573, 597.
- Mannheim (2006) Mannheim, P. D. (2006). Alternatives to dark matter and dark energy. Progress in Particle and Nuclear Physics, 56, 340–445.
- Mannheim and O’Brien (2012) Mannheim, P. D. and O’Brien, J. G. (2012). Fitting galactic rotation curves with conformal gravity and a global quadratic potential. Phys. Rev. D, 85, 124020.
- Mannheim and O’Brien (2013) Mannheim, P. D. and O’Brien, J. G. (2013). Galactic rotation curves in conformal gravity. Journal of Physics Conference Series, 437(1), 012002.
- Milgrom (1983) Milgrom, M. (1983). A modification of the newtonian dynamics- implications for galaxies. ApJ, 270, 371.
- Misner et al. (1970) Misner, C., Thorne, K., and Wheeler, J. (1970). Gravitation. W.H. Freeman and Company, New York, NY, USA.
- Narayan et al. (1997) Narayan, R., , and Bartelman, M. (1997). Formation of Structure in the Universe: Lectures on Gravitational Lensing. A. Dekel & J. P. Ostriker.
- Navarro (1998) Navarro, J. (1998). The Cosmological Significance of Disk Galaxy Rotation Curves. arxiv:astro-ph/9807084.
- Navarro et al. (1997) Navarro, J., Frenk, C., and White, S. (1997). The structure of cold dark matter halos. ApJ, 462, 563.
- Persic et al. (1996) Persic, M., Salucci, P., and Stel, F. (1996). The universal rotation curve of spiral galaxies - I. The dark matter connection. MNRAS, 281, 27–47.
- Radosz et al. (2013) Radosz, A., Augousti, A. T., and Siwek, A. (2013). On the nature of cosmological redshift and spectral shift in Schwarzschild-like and other spacetimes. Gen.Rel.Grav., 45, 705–715.
- Rubin et al. (1980) Rubin, V., Ford, W., and Thonnard, N. (1980). Rotational properties of 21 sc galaxies with a large range of luminosities and radii. ApJ, 238, 471.
- Rubin et al. (1978) Rubin, V. C., Thonnard, N., and Ford, Jr., W. K. (1978). Extended rotation curves of high-luminosity spiral galaxies. IV - Systematic dynamical properties, SA through SC. ApJ, 225, L107–L111.
- Sanders and McGaugh (2002) Sanders, R. and McGaugh, S. (2002). Modified newtonian dynamics as an alternative to dark matter. ARA&A, 40, 263.
- Sofue (2013) Sofue, Y. (2013). Mass Distribution and Rotation Curve in the Galaxy, page 985. Oswalt, T. D. and Gilmore, G.
- Xue et al. (2008) Xue, X. et al. (2008). The Milky Way’s Circular Velocity Curve to 60 kpc and an Estimate of the Dark Matter Halo Mass from Kinematics of 2400 SDSS Blue Horizontal Branch Stars. AJ., 684, 1143–1158.