A Hard Ionizing Spectrum in Ly Emitters with Intense [O iii] Emission:
Analogs of Galaxies in the Reionization Era?
††affiliation: Some of the data presented herein were obtained at the W.M. Keck Observatory,
which is operated as a scientific partnership among the California Institute
of Technology, the University of California and the National Aeronautics and
Space Administration. The Observatory was made possible by the generous
financial support of the W.M. Keck Foundation.
‡‡affiliation: The observations were carried out within the framework of Subaru-Keck
time exchange program, where the travel expense was supported by
the Subaru Telescope, which is operated by
the National Astronomical Observatory of Japan.
Abstract
We present Keck/MOSFIRE spectra of the diagnostic nebular emission lines [O iii], [O ii], and H for a sample of 15 redshift Ly emitters (LAEs) and Lyman break galaxies (LBGs). In conjunction with spectra from other surveys, we confirm earlier indications that LAEs have a much higher [O iii][O ii] line ratio than is seen in similar redshift LBGs. By comparing their distributions on a [O iii][O ii] versus R23 diagram, we demonstrate that this difference cannot arise solely because of their lower metallicities but most likely is due to a harder ionizing spectrum. Using measures of H and recombination theory, we demonstrate, for a subset of our LAEs, that - the number of Lyman continuum photons per UV luminosity - is indeed dex larger than for typical LBGs at similar redshifts. Using photoionization models we estimate the effect this would have on both [O iii][O ii] and R23 and conclude such a hard spectrum can only partially explain such intense line emission. The additional possibility is that such a large [O iii][O ii] ratio is in part due to density rather than ionization bound nebular regions, which would imply a high escape fraction of ionizing photons. We discuss how further observations could confirm this possibility. Clearly LAEs with intense [O iii] emission represent a promising analog of those sources with similarly strong lines which are thought to be an important contributor to cosmic reionization.
Subject headings:
galaxies: evolution — galaxies: high-redshift.1. INTRODUCTION
To understand how cosmic reionization occurred during the redshift range , it is necessary to identify the responsible sources. Due to the steep decrease of the number density of quasars with redshift at (Fan et al. 2004), the currently popular viewpoint is that star-forming galaxies played the dominant role in delivering the necessary ionizing photons into the intergalactic medium (IGM; Robertson et al. 2015).
The key question is whether the typical output of ionizing photons from galaxies is sufficient. This requires knowledge of (i) the UV radiation emerging from their stellar populations, defined by Robertson et al. (2013) in terms of , the number of Lyman continuum (LyC) photons per UV( Å) luminosity and (ii) the fraction of such LyC photons that can escape scattering within the galaxy and its immediate vicinity. Neither of these important quantities is currently constrained for early galaxies so this is the primary uncertainty in claims that reionization is driven primarily by star-forming galaxies.
The present Letter is motivated by finding observational evidence that the ionizing spectrum is harder, and that and both increase with redshift, particularly for low mass, metal-poor systems characteristic of those that likely dominate reionization. Intense nebular emission, e.g., of [O iii], appears to be more common in high redshift galaxies (Schenker et al. 2013; Smit et al. 2014, 2015) and this has been interpreted as evidence for a harder ionizing spectrum. Although such emission lines are not directly accessible with ground-based spectrographs beyond , IRAC photometry can still trace their presence via an excess inferred in the SEDs. The most intense [O iii] emitters at located via IRAC photometry have confirmed Ly emission (Zitrin et al. 2015; Roberts-Borsani et al. 2015) which suggests they may have already created significant ionized bubbles for which a high value of is necessary (Stark et al. 2016).
Since neither nor cannot directly be observed beyond , we seek to find and study analogs of the reionization sources at , the highest redshift where direct measures of these quantities are possible. The inter-dependence of strong [O iii] emission and the leakage of LyC photons was first evaluated in the context of photoionization models by Nakajima & Ouchi (2014). They suggested that large values of the emission line ratio [O iii][O ii] may indicate a high value of . Furthermore, the [O iii][O ii] ratio is sensitive to the ionization parameter , which is, in ionization equilibrium, related to the ionizing photon production rate and the gas density , such that
| (1) |
A correlation between [O iii][O ii] ratio and is thus suggested. Recent supports for these conjectures are provided by significant LyC radiation detected in nearby intense [O iii] emitters (Izotov et al. 2016a, b; Schaerer et al. 2016).
In this Letter, we use the Keck near-infrared spectrograph MOSFIRE to compare the physical properties of a representative sample of intense [O iii]-emitting Lyman alpha emitters (LAEs) at with equivalent data for Lyman break galaxies (LBGs). Our goal is to understand their [O iii][O ii] line ratios in terms of a hard ionizing spectrum. Ultimately we seek to verify that such sources may also have a high and thus represent valuable analogs of the star-forming galaxies responsible for cosmic reionization.
|
2. Spectroscopic Data
2.1. Sample
|
|
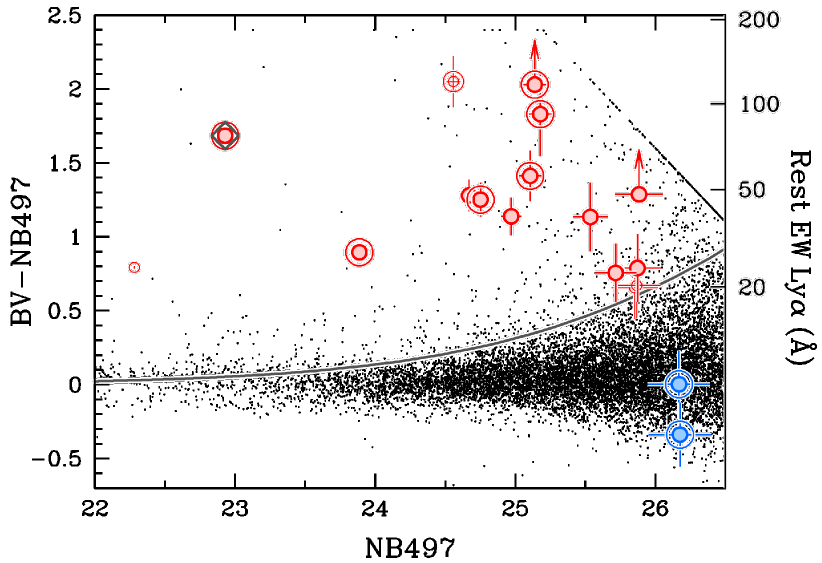
Our target sample is drawn from a Subaru imaging survey which has identified LAEs in the SSA22 field (Hayashino et al. 2004; Yamada et al. 2012; Micheva et al. 2015). LAEs at were selected via their photometric excess in a narrow band filter centered at 497nm (Figure 1). A limited amount of confirmatory optical spectroscopy has already been conducted for this sample.
For the present campaign, the MOSFIRE pointing was chosen to include a few candidate LyC leakers on the basis of ground-based imaging. We then completed the sample of 16 targets including other LAEs representative of the parent sample. We also included LBGs and one LAE. The LAE was initially classed as a LBG but optical spectroscopy revealed strong Ly emission. Among the total of 19 targets, were already confirmed from previous optical spectroscopy. One of the LAEs is a Type II AGN (Micheva et al. 2016) but the other targets show no obvious indications of AGN activity.
2.2. Observation and Data reduction
Observations were undertaken on UT 2015 June 20 and 21. Both nights were photometric with a seeing of –. MOSFIRE multi-slit spectroscopy was taken using the and band filters sampling the wavelength ranges of – and – m, respectively. Using a slit width of the resolving power is in the band and in . Individual exposures of sec ( sec) were taken in () with a AB nod sequence of separation. The total integration time was hours in and hours in .
Data reduction was performed using the MOSFIRE DRP111https://keck-datareductionpipelines.github.io/MosfireDRP. See also Steidel et al. (2014).. The processing includes flat fielding, wavelength calibration, background subtraction and combining the nod positions. Wavelength solutions in were obtained from OH sky lines, while in a combination of OH lines and Ne arcs was used.
Flux solutions and telluric absorption corrections were obtained from A0V Hipparcos stars observed at similar airmasses. This procedure also corrects for slit-losses since LAEs are unresolved in typical ground-based conditions (Malhotra et al. 2012) and the standard stars were observed in a similar manner. Flux calibrations were independently confirmed using a relatively bright star () placed on the mask.
2.3. Emission line identifications
One or more emission lines were detected at the level in of our targets. Based on previously spectroscopic redshifts and the expected redshift of for the bulk of the sample, sources ( LAEs and two LBGs at and one LAE at ) are readily identified with [O iii]. Two are considered to be H at and two further faint targets present no significant signal. The following analysis is therefore based on the successfully confirmed sources.
We measured [O ii]222We use the notation [O ii] as the sum of the doublet.,
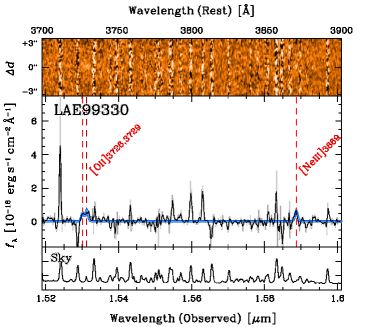
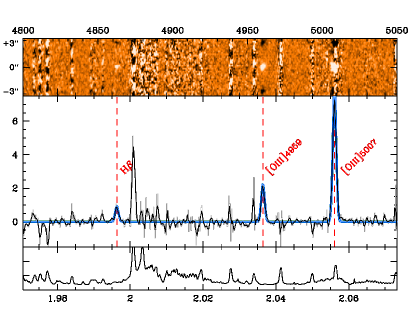
[O iii] and H line fluxes by fitting a Gaussian profile to each line with the IRAF task specfit in stsdas.contrib.spfitpkg.
In the fitting procedure, the redshift and FWHM of the [O iii] (i.e., the strongest emission line) were
adopted as Gaussians for the other lines. An HK spectrum of a representative LAE with
a demonstrating of the fitting process is shown in Figure 2.
Table 1 lists the measured [O iii][O ii] ratio and the R23-index, ([O iii]+[O ii])H, for each of the targets.
3. Results
|
3.1. The [O iii][O ii] ratio of LAEs and LBGs
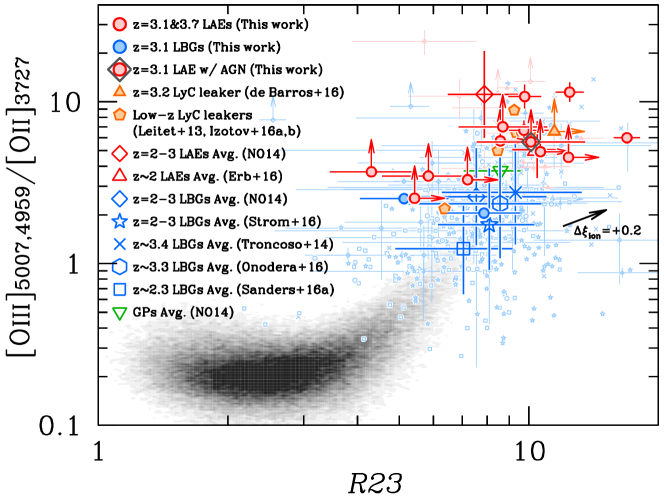
Figure 3 compares the results for our MOSFIRE 3.1 sample with other high redshift and local sources in the [O iii][O ii] ratio vs. the R23-index plane. The latter index is a valuable probe of the gas-phase metallicity. For the newly-observed sample, we assume no dust correction, an assumption we return to in Section 3.3. In comparing with literature samples, we classify galaxies as LAEs if the rest EW(Ly) exceeds Å (Nakajima & Ouchi 2014; Erb et al. 2016), whereas for the continuum-selected galaxies at (Troncoso et al. 2014; Sanders et al. 2016a; Onodera et al. 2016; Strom et al. 2016), we assume these are dominated by LBGs (cf. Shapley et al. 2003). No obvious AGNs are included in the literature samples.
Since we are interested in the relevance of intense [O iii] emission as a possible indicator of a high we also plot recent galaxies revealing significant LyC emission; Ion2 at (de Barros et al. 2016; Vanzella et al. 2016), five green pea galaxies at (Izotov et al. 2016a, b), and two local galaxies (Bergvall et al. 2006; Leitet et al. 2013).
Firstly, following Nakajima & Ouchi (2014), it is clear that our LAEs have the highest [O iii][O ii] ratio. A typical LBG at has an [O iii][O ii] ratio of , whereas the LAEs presented here lie above at the level with some as high as . Some LAEs may have even higher ratios given we cannot always detect [O ii] . Notably, this LAE-LBG difference is seen even within our own sample.
Secondly, LAEs have an [O iii][O ii] ratio higher than LBGs whose R23-indices are comparable. In local galaxies, a higher ionization parameter, , is found in less chemically-enriched galaxies. This correlation provides an empirical metallicity indicator for systems with strong line ratios (e.g., Maiolino et al. 2008). Although high- LBGs appear to follow the same relation (e.g., Shapley et al. 2015; Sanders et al. 2016a, b), LAEs lie above this trend indicative of an enhanced ionization parameter (e.g., Nakajima & Ouchi 2014). Galaxies have a metallicity of at a R23-index (Maiolino et al. 2008) that is typically found in our LAE sample (see also Trainor et al. 2016). On the other hand, if the [O iii][O ii] ratio were adopted as a metallicity indicator (Maiolino et al. 2008), the LAEs would have metallicities lower than those based on the R23-index and the Kobulnicky & Kewley (2004) method by dex.
3.2. A Harder Ionizing Spectrum for LAEs
We now turn to estimating the ionizing photon production efficiency, , for our MOSFIRE sample using recombination lines in our spectra. This quantity represents the number of LyC photons per UV luminosity (Robertson et al. 2013; Bouwens et al. 2015);
| (2) |
where is the intrinsic UV-continuum luminosity. The LyC photons production rate is determined by massive young stars and best constrained by the hydrogen recombination lines, in this case H.̇ We adopt Bouwens et al. (2015) representation of the Leitherer & Heckman (1995) relation between and the H luminosity (H), as
| (3) |
Note that the conversion assumes no escaping ionizing photons, i.e all are converted into recombination radiation. To recognize this, we adopt the notation , whose zero subscript indicates that the escape fraction of ionizing photons is zero. The quantity can be derived by dividing by ( ). The UV luminosity is measured from an SED around Å using the appropriate rest-frame broadband photometry assuming zero reddening. The SED fitting was done as described in Kusakabe et al. (2015).
The assumption of zero reddening is important since it clearly affects . We note Schaerer et al. (2016) find dust correction decreases for LyC leakers at 0.3 by dex. Castellano (2014) report a similar trend for LBGs. We return to this assumption in Section 3.3.
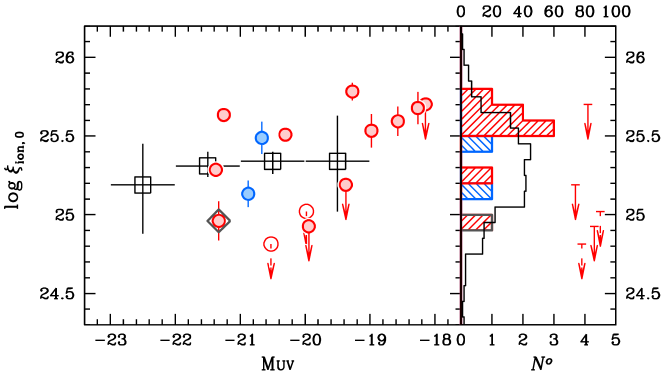
H is robustly detected in of our galaxies ( LAEs, LBGs and the AGN) and the derived values of are listed in Table 1. Among the LAEs whose H is not detected, two have less precise photometry and are removed from the following discussion as their values are less reliable. Figure 4 compares the distribution of as a function of the absolute UV magnitude for the various categories with those for LBGs analysed using a similar approach based on inferred H (Bouwens et al. 2015).
Notwithstanding the 3 with upper limits, the H-detected LAEs have an average larger than that inferred for LBGs by dex. They support the contention deduced from Figure 3 that LAEs typically have a harder ionizing radiation field than LBGs (also refer to Matthee et al. 2016). The difference is apparent at a fixed UV magnitude suggesting a higher production rate of ionizing photons.
The offset could be even larger if, as suspected from the large [O iii][O ii] ratio, is non-zero (see also Iwata et al. 2009; Nestor et al. 2013; Mostardi et al. 2013). For example, if , becomes larger than by dex. We note that two LAEs and one AGN-LAE have consistent with the LBG population. This might arise from a particularly high , a less significant Ly emission (Å), and/or a more mature stellar population (Robertson et al. 2013) inferred from SED fitting ( Myr).
3.3. Constraints on Dust in LAEs
In the foregoing analyses, we have ignored any corrections for dust reddening in our sample which would otherwise affect the results we present in both Figures 3 and 4.
This assumption is supported by two LAEs in our sample, LAE93564 and LAE104037, for which we are fortunate to see multiple Balmer lines and where the Balmer decrements are consistent with zero reddening, albeit with an uncertainty of E(BV) . For the other LAEs, SEDs based on our multicolor Subaru photometry further restrict the range of E(BV) values consistent with zero to within . If we assume a median E(BV) consistent with the SEDs and assume an SMC attenuation law333As adopted in Figure 4 for Bouwens et al. (2015)’s measurements. (Gordon et al. 2003), and the same color excess for the stellar and nebular emission, is only decreased by dex. This would not change our conclusion that LAEs have a harder ionizing radiation field than LBGs. Of course, any residual correction for dust reddening effect has an even smaller effect on the [O iii][O ii] ratio (a decrease of dex) and the R23-index (an increase of dex).
4. Discussion
We present Keck MOSFIRE measurements of the diagnostic nebular emission lines of [O iii], [O ii], and H drawn from a sample of and LAEs and LBGs. In comparison with similar measurements of other surveys, we demonstrate that LAEs have much larger [O iii][O ii] line ratios than those seen in LBGs. This enhancement cannot be fully explained by their low metallicities, given the locally defined relation between metallicity and ionization parameter. There are three possible explanations for this difference - (i) a larger gas density, (ii) a higher production rate of ionizing photons (and thus a larger mean ), and (iii) a different geometry of Hii clouds (which relates to a higher ). For (i)-(ii), following Equation (1), a dense ISM or a high production of ionizing photons will increase the [O iii][O ii] ratio.
We believe a denser ISM is an unlikely explanation because gas densities estimated from the resolved [O ii] doublet line ratio for LAEs are, on average, comparable to typical values for continuum-selected galaxies ( cm-3; Sanders et al. 2016a). Although only two of our LAEs have a well-measured [O ii] doublet ratio, both indicate a modest gas density of – cm-3.
A higher production rate of ionizing photons is a more natural explanation for the high [O iii][O ii] ratio as we have directly verified they have a high . However, the dex larger observed would only increase the ionization parameter by dex and the [O iii][O ii] ratio by dex at a fixed metallicity of (i.e., R23 ; Kobulnicky & Kewley 2004).
Additionally, the ionizing spectrum may be harder. In this case we also expect an enhancement in the R23-index. We can calculate the magnitude of this effect using photoionization models similar to those presented in Nakajima & Ouchi (2014), varying the stellar metallicity to represent a change in the hardness of the radiation field (cf. Steidel et al. 2016). We assume a gas phase metallicity of and an ionization parameter of log (Sanders et al. 2016a; Onodera et al. 2016). To simulate the effect of a harder spectrum, we compare two stellar metallicity cases: comparable to the gas-phase metallicity (e.g., Kewley et al. 2013) and a low value of . With these assumptions, our photoionization models predict both the [O iii][O ii] ratio and R23-index increase in the low metallicity case by only dex, with enhanced by dex. This change is illustrated in Figure 3 with a black arrow. This change of originates from the reduced UV-continuum since we fix the ionization parameter. If, conversely, the UV-continuum level is fixed, the higher would further increase the ionization parameter by dex and [O iii][O ii] ratio only by dex. Neither is sufficient to explain the high [O iii][O ii] ratio.
The third explanation would indicate a strong connection between the large [O iii][O ii] ratio and the escape fraction (Nakajima & Ouchi 2014). If Hii regions are density-bounded, the nebulae have a low column density of Hi and a high . The large [O iii][O ii] ratio arises since the outer zone that produces [O ii] is reduced while the inner [O iii]-producing zone is unchanged (e.g., Kewley et al. 2013). The R23-index is largely unaffected since hydrogen will be ionized throughout the nebula. For the ISM properties of a LBG, our photoionization models predict an [O iii][O ii] ratio enhanced by dex with an unchanged R23-index ( dex decrease) for of %. This explanation is compatible with the modest densities observed in the LAEs, since the [O ii] doublet probes the ionized gas density while density-bounded nebulae only affect the Hi density.
The only way to test whether such density-bounded Hii regions are dominant in high- LAEs and that this provides a contribution to the large [O iii][O ii] ratios, is to directly constrain the LyC leakage from 3 LAEs. This would permit us to break the degeneracies in the discussion above. The prospects appear promising given the similarity in line emission properties with the sources recently observed successfully with LyC photons (Vanzella et al. 2016; Izotov et al. 2016a, b; Schaerer et al. 2016; see also Henry et al. 2015; Verhamme et al. 2016). Regardless of the above degeneracy, our sample of LAEs represent valuable low redshift analogs of the sources with similarly intense [O iii] emission and harder ionizing spectra (Stark et al. 2015a, b; Sobral et al. 2015; Stark et al. 2016) that may have the necessary high to drive cosmic reionization.
| Obj. | EW(Ly) | spec(FUV)? | [O iii][O ii] | R23 | log | log SFR0 | log | MUV | |
|---|---|---|---|---|---|---|---|---|---|
| (Å) (1) | (2) | (3) | (4) | (5) | (Hz erg-1) (6) | ( yr-1) (7) | () (8) | (AB) (9) | |
| LAE93564 | yes | ||||||||
| LAE94460(†) | yes | ||||||||
| LAE97081 | yes | ||||||||
| LAE97176 | yes | ||||||||
| LAE103371 | yes | ||||||||
| LAE104037 | yes | ||||||||
| LAE89723(†) | no | ||||||||
| LAE91055 | no | ||||||||
| LAE97030 | no | ||||||||
| LAE97254 | no | ||||||||
| LAE99330 | no | ||||||||
| LAE104147 | no | ||||||||
| AGN86861 | yes | ||||||||
| LBG102826 | yes | ||||||||
| LBG104097 | yes |
Note. — (1) Rest EW(Ly). For the objects, the EW is estimated from the BVNB497 color. The EW of LAE93564 is derived from spectroscopy. A lower-limit is given if the object is not detected significantly in the image. (2) Confirmed or not from previous rest FUV spectroscopy. (3) Nebular redshift. (4) [O iii][O ii] ratio. (5) R23-index. (6) under the assumption of a zero . (7) SFR under the assumption of a zero , estimated from the H luminosity. An upper-limit of is adopted in Columns (4)–(7) if the line is not detected. (8) Stellar mass derived from SED fitting, which adopts an SMC dust law. (9) Absolute UV magnitude measured from an SED around Å. (†) The , stellar mass, and MUV estimates are less certain due to less precise optical photometry.
References
- Bergvall et al. (2006) Bergvall, N., et al. 2006, A&A, 448, 513
- Bouwens et al. (2015) Bouwens, R. J. et al. 2015, arXiv-eprints, arXiv:1511.08504
- Castellano (2014) Castellano, M., et al. 2014, A&A, 566, A19
- de Barros et al. (2016) de Barros, S., et al. 2016, A&A, 585, A51
- Erb et al. (2016) Erb, D. K., et al. 2016, arXiv-eprints, arXiv:1605.04919
- Fan et al. (2004) Fan, X., et al. 2004, ApJ, 128, 515
- Gordon et al. (2003) Gordon, K. D., et al. 2003, ApJ, 594, 279
- Hayashino et al. (2004) Hayashino, T., et al. 2004, AJ, 128, 2073
- Henry et al. (2015) Henry, A., et al. 2015, ApJ, 809, 19
- Iwata et al. (2009) Iwata, I., et al. 2009, ApJ, 692, 1287
- Izotov et al. (2016a) Izotov, Y. I., et al. 2016a, Nature, 529, 178
- Izotov et al. (2016b) Izotov, Y. I., et al. 2016b, MNRAS, 461, 3683
- Kewley et al. (2013) Kewley, L. J., et al. 2013, ApJ, 774, 100
- Kobulnicky & Kewley (2004) Kobulnicky, H. A., Kewley, L. J. 2004, ApJ, 617, 240
- Kusakabe et al. (2015) Kusakabe, H., Shimasaku, K., Nakajima, K., & Ouchi, M. 2015, ApJ, 800, L29
- Leitet et al. (2013) Leitet, E., Bergvall, Hayes, M., Linné, S., & Zackrisson, E. 2013, A&A, 553, A106
- Leitherer & Heckman (1995) Leitherer, C., & Heckman, T. M. 1995, ApJS, 96, 9
- Maiolino et al. (2008) Maiolino, R., et al. 2008, A&A, 488, 463
- Malhotra et al. (2012) Malhotra, S. et al. 2012, ApJ, 750, L36
- Matthee et al. (2016) Matthee, J., et al. 2016, arXiv-eprints, arXiv:1605.08782
- Micheva et al. (2015) Micheva, G., et al. 2015, arXiv-eprints, arXiv:1509.03996
- Micheva et al. (2016) Micheva, G., et al. 2016, arXiv-eprints, arXiv:1604.00102
- Mostardi et al. (2013) Mostardi, R. E., et al. 2013, ApJ, 779, 65
- Nakajima & Ouchi (2014) Nakajima, K., & Ouchi, M. 2014, MNRAS, 442, 900
- Nestor et al. (2013) Nestor, D. B., et al. 2013, ApJ, 765, 47
- Onodera et al. (2016) Onodera, M. et al. 2016, ApJ, 822, 42
- Roberts-Borsani et al. (2015) Robert-Borsani, G. W., et al. 2015, arXiv-eprints, arXiv:1506:00854
- Robertson et al. (2013) Robertson, B., et al. 2013, ApJ, 768, 71
- Robertson et al. (2015) Robertson, B., Ellis, R. S., Furlanetto, S. R., & Dunlop, J. S. 2015, ApJ, 802, L19
- Sanders et al. (2016a) Sanders, R. L., et al. 2016a, ApJ, 816, 23
- Sanders et al. (2016b) Sanders, R. L., et al. 2016b, ApJ, 825, L23
- Schaerer et al. (2016) Schaerer, D., et al. 2016, arXiv-eprints, arXiv:1606:00053
- Schenker et al. (2013) Schenker, M. A., Ellis, R. S., Konidaris, N. P., & Stark, D. P. 2013, ApJ, 777, 67
- Shapley et al. (2003) Shapley A. E., et al. 2003, ApJ, 588, 65
- Shapley et al. (2015) Shapley, A. E., et al. 2015, ApJ, 801, 88
- Smit et al. (2014) Smit, R., et al. 2014, ApJ, 784, 58
- Smit et al. (2015) Smit, R., et al. 2015, ApJ, 801, 122
- Sobral et al. (2015) Sobral, D., et al. 2015, ApJ, 808, 139
- Stark et al. (2015a) Stark, D. P., et al. 2015a, MNRAS, 450, 1846
- Stark et al. (2015b) Stark, D. P., et al. 2015b, MNRAS, 454, 1393
- Stark et al. (2016) Stark, D. P., et al. 2016, arXiv-eprints, arXiv:1606.01304
- Steidel et al. (2014) Steidel, C. C., et al. 2014, ApJ, 795, 165
- Steidel et al. (2016) Steidel, C. C., et al. 2016, ApJ, 826, 159
- Strom et al. (2016) Strom, A. L., et al. 2016, arXiv-eprints, arXiv:1608.02587
- Trainor et al. (2016) Trainor, R. F., et al. 2016, arXiv-eprints, arXiv:1608.07280
- Troncoso et al. (2014) Troncoso, P., et al. 2014, A&A, 563, A58
- Vanzella et al. (2016) Vanzella, E., et al. 2016, arXiv-eprints, arXiv:1602.00688
- Verhamme et al. (2016) Verhamme, A., et al. 2016, arXiv-eprints, arXiv:1609.03477
- Yamada et al. (2012) Yamada, T., et al. 2012, ApJ, 143, 79
- Zitrin et al. (2015) Zitrin, A., et al. 2015, ApJ, 810, L12